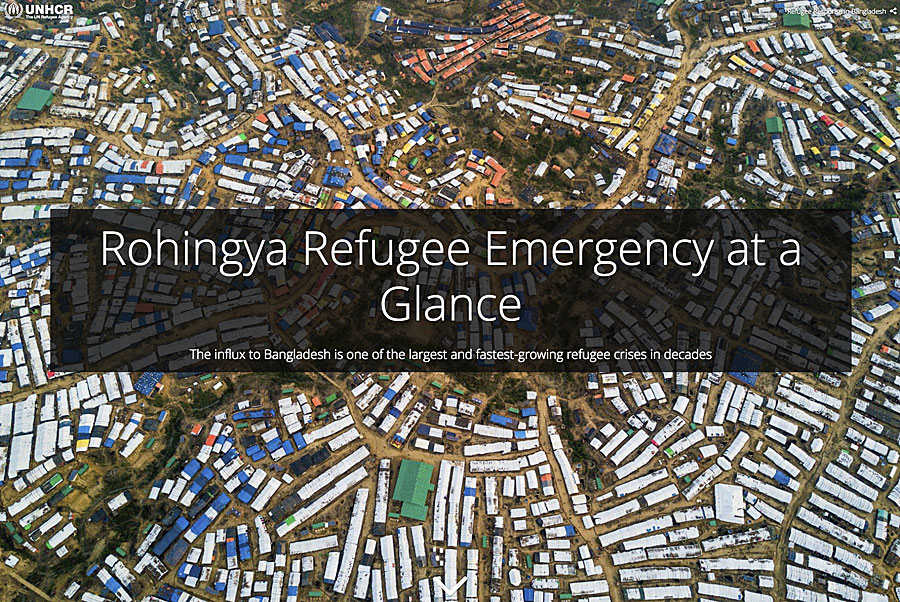
The winning entries in the 2018 Esri Storytelling with Maps Contest reflect the diversity of topics that the rapidly-growing community of story map authors want to document using maps and other media. Winning story maps covered subjects that ranged from the hazards threatening a massive refugee camp to the very different and less severe hazards that golfers face as they tee off at a South Dakota golf course.
The grand prize this year recognized the work of Cédric Vidonne of the United Nations Refugee Agency UNHCR [UN High Commissioner for Refugees]. Challenged by the agency’s director to help raise awareness about the threats faced by some 670,000 Rohingya refugees crowded into an instant city in Bangladesh near the Myanmar border, he worked intensively over two or three days to produce his first story map, Rohingya Refugee Emergency at a Glance.
The story vividly portrays the dangers that the coming monsoon season posed to the camp. Every structure in the camp is mapped and compared against landslide and flood risk. The story also discusses health issues, locates clinics and vaccination centers, and maps over 7,000 hand-operated water pumps along with nearly 20,000 latrines.
Did Vidonne think the story map lived up to UNHCR’s expectations? “[It was] very successful! It got a lot of attention internally and externally,” he said. “It has been featured on unhcr.org’s front page for more than a month. It also helped UNHCR raise awareness [about] the difficult situation in Bangladesh. A story map is [about] more than presenting and showcasing a situation; it also helps to find solutions.”
Vidonne was impressed by what an Esri Story Maps app could do.
“Being able to combine so many different datasets from so many different sources and then tell one unified story is amazing,” he said. “We have been able to work with multiple teams, from our UNHCR colleagues in Bangladesh doing all the data collection and groundwork to our teammates in Copenhagen [Denmark] that helped us with the natural disaster spatial analysis.”
Vidonne said that his story has triggered interest within UNHCR in producing additional story maps. “We have one that will be done really soon and already two other ones in the pipeline.”
Story maps were awarded prizes in several categories, including Travel, Destinations, and Recreation; Science, Technology, and Education; Infrastructure, Planning, and Government; Culture, History, and Events; and Conservation, Environment, and Sustainability.
First place in the Travel, Destinations, and Recreation category went to Spyridon I. Staridas for his vivid virtual tour of The Volcano of Santorini. His story map, created with the Esri Story Map Journal app, zooms in and out to set the geologic context and locate remnants of historical eruptions.
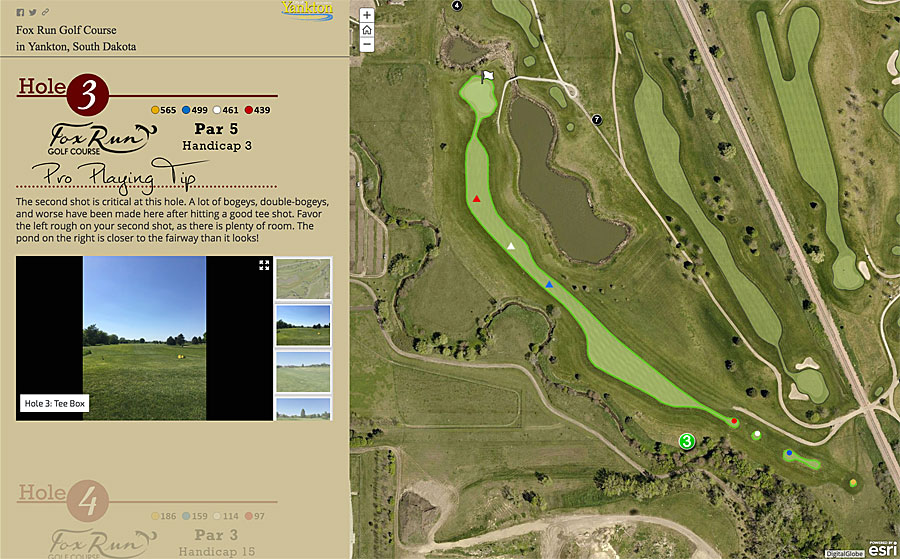
A tour of the Fox Run Golf Course in Yankton, South Dakota, garnered second place in the Travel, Destinations, and Recreation category. Using Esri Story Maps apps to feature golf courses can be a great idea if executed well. Kristin Yonke of the City of Yankton, South Dakota, did just that—with style. Her custom graphics and Pro Playing Tips make for a lively narrative.
Yonke wanted to showcase to the public what Fox Run Golf Course had to offer.
“The city had course booklets they only handed out during tournaments with some of the course information, but the problem was that you had to physically go to the course to get one,” Yonke said. She converted the booklet into what she called “an interactive and engaging experience that can be accessed [online] and used by everyone at any time.” The story map is available on the City of Yankton’s website.
“It has [proved] to be a wonderful promotional item for our city that is reaching more customers than ever before and drawing more money into our community from our out-of-town visitors,” she said.
Yonke finds creating story maps easy. “Esri has made configuring story maps so simple that creating them is the fun part of my job!,” she said. “With a little bit of time and creativity, anyone can get their ideas, stories, and information out to anyone on any device, and that is an incredibly powerful ability in this day and age.”
Last year’s grand prize winner, Daniel Coe of the Washington Geological Survey, was recognized again in 2018—this time, for his ambitious story The Bare Earth: How lidar in Washington State exposes geology and natural hazards. Coe, a multitalented GIS specialist, cartographer, and amateur photographer, won first place in the Science, Technology, and Education category.
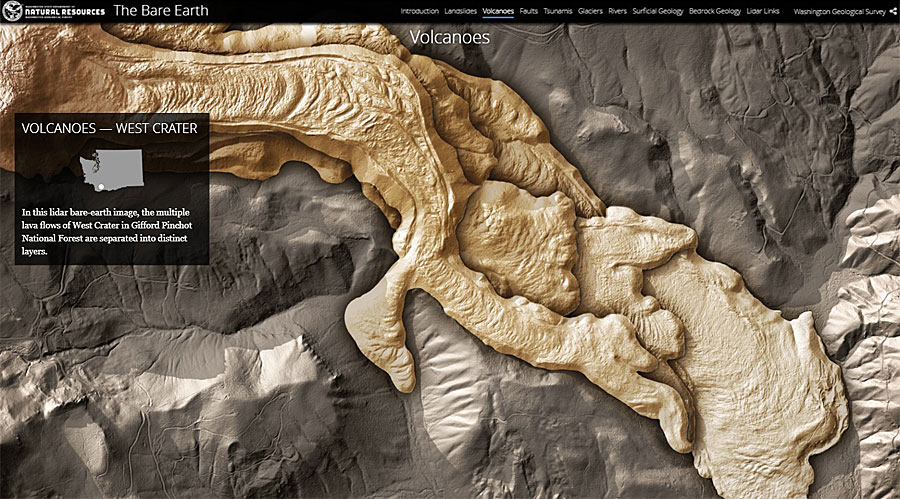
He created a multimedia extravaganza that mixes infographics, imagery, and stunning lidar visualizations to reveal how natural forces have shaped the landscapes of Washington. His story, created with the Esri Story Map Cascade app, artfully features small circular images, larger items with rounded corners, and immersive sections with swipe transitions comparing aerial imagery with bare earth lidar images that strip away vegetation to reveal striking landforms.
GIS specialist Amanda Huber, who used the Esri Story Map Cascade app to create My portfolio of work in GIS, received an honorable mention in the Science, Technology, and Education category. “I really wanted my portfolio to stand out in today’s job market,” she said. “I knew I wanted something more visually appealing than just a website with hyperlinks to display my work.”
She can use the story map when seeking work opportunities.
“I was able to feature my GIS work in a creative, dynamic, and visual way,” Huber said. “I added the URL to my résumés, cover letters, and LinkedIn account. This turned out to be a great method to present my work to prospective employers. I look forward to creating more story maps and featuring them on my portfolio story map in the future.”
In the Infrastructure, Planning, and Government category, Esri recognized the Norwegian foundation GRID-Arendal as first-place winner for a compelling story about Sanitation and Wastewater in Africa. Levi Westerveld of GRID-Arendal said that creating story maps “is always an exciting process. What I like the most is probably that very first step of the process during which we sketch out a storyboard. For each story map, I try to come up with new ways to show content.”
The story map makes effective use of video, including drone footage, to convey the scope and severity of Africa’s water, sanitation, and hygiene issues. Videos of local citizens, officials, and activists humanize the story.
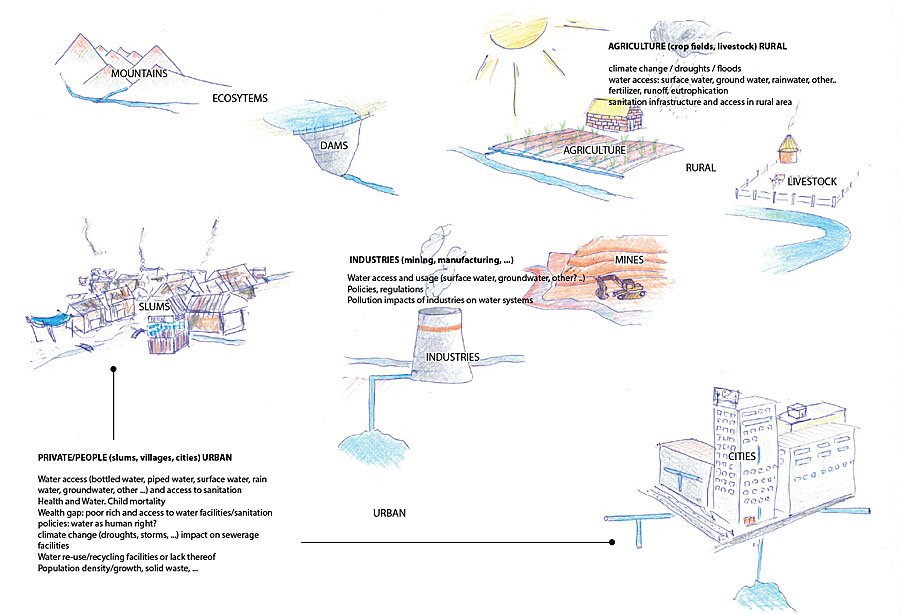
“I had the opportunity to travel to Kenya and collect video footage and interviews,” Westerveld said. “That extra time and flexibility we had to collect our own data really made for a great product. As a rule, I think having different scales of narration and content display all the way from local and personal interviews to regional interactive maps works well. Connecting these scales using story maps really allows us to visualize the full dimension and complexity of specific issues.”
The story with perhaps the greatest emotional impact of all the prizewinners is Pay or Die? Prison or Cemetery?, which won first place in the Culture, History, and Events category. Livia Jakob of Consciente El Salvador, an education nonprofit organization, tells the story of El Salvador’s homicide rate—the highest in the world—and its primary cause: criminal youth gangs. Many gang members emigrated to the US during El Salvador’s civil war. While in the US, they adopted a gang culture. Some members were subsequently deported, returning to El Salvador and spreading violence there.
The story adroitly combines maps, ranging in scale from global to local, with powerful photographs that convey the human cost of El Salvador’s murder epidemic.
The third-place winner in the Culture, History, and Events category was Incunabula: The Art & History of Printing in Western Europe, c. 1450–1500 by Stephanie Stillo of the Library of Congress. Stillo’s beautifully illustrated narrative was produced during a pilot project at the library that resulted in several informative stories. More story maps will be created that feature the library’s massive collections.
The first-place winner in the Conservation, Environment, and Sustainability category was Legalization of Indigenous Territories in Colombia by Brian Hettler of the Amazon Conservation Team.
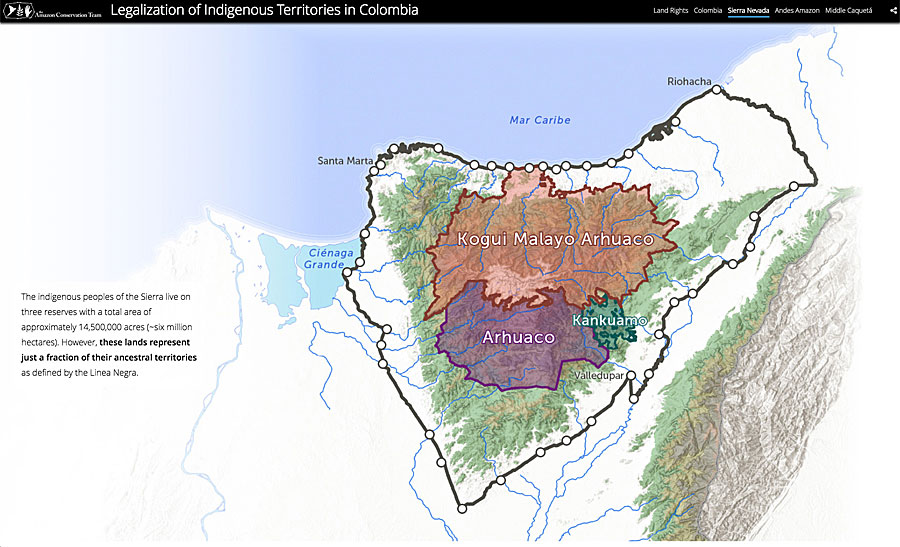
“We sought to highlight the importance of indigenous land rights to both the local communities and regional conservation efforts, while also presenting several recent success stories from Colombia,” said Hettler, a prolific story map creator and a past contest winner. “Thanks to the dynamic interactive maps, many people were able to see for the first time how these indigenous territories fit together and connect existing protected areas to form regional conservation corridors that are essential to maintaining healthy ecosystems.”
The Amazon Conservation Team uses Esri Story Maps apps, in part because the templates allow the organization to produce high-quality communications products, Hettler added. The Amazon Conservation Team has several story maps in the works, including an update to a narrative of the travels of ethnobotanist Richard Evans Schultes and a partnership with the Jane Goodall Institute that emphasizes the importance of community-first conservation strategies, highlighting case studies from Africa and South America.
To view all the winners of the 2018 competition, visit the Winners Gallery.
Peruse the stories. There’s no better way to get a feel for the ability of maps, combined with rich multimedia, to tell important, entertaining, and compelling stories about our world.
