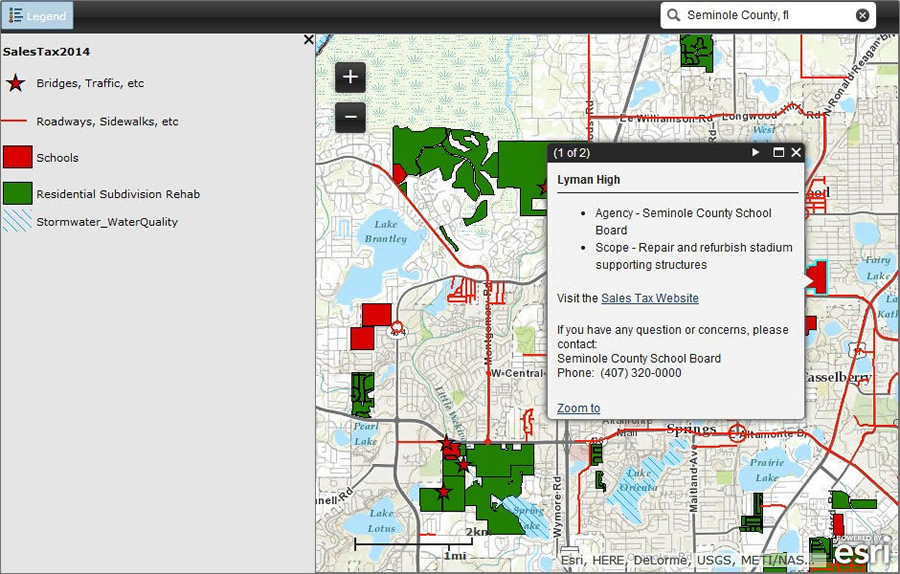
Officials in Seminole County, Florida, wanted to use maps to show voters how the revenue raised from a proposed one-penny sales tax increase would be spent if the tax hike received the green light. So several weeks before the tax referendum, Seminole County GIS used Esri ArcGIS to deploy online informational maps that showed which projects would be completed with the money from the one-cent infrastructure tax.
The county’s Proposed Projects Map displays the locations of and information about proposed capital improvement projects (CIPs) for infrastructure such as transportation, trails, and schools. It shows where upgrades would be made, including replacing school roofs and expanding classrooms and other school facilities, improving roadways, building and upgrading trails, replacing and repairing bridges and sidewalks, installing curbs and gutters, and improving water quality. Information about each project is in a pop-up window. The map also has an address search box and a simple legend.
Another web map shows capital improvement projects funded by sales tax increases that voters approved in 1991 and 2001. Esri ArcGIS Online and ArcGIS for Server were used to create and serve both maps, which were popular with the public in the days leading up to the vote.
An Obvious Solution
In February 2014, the Department of Public Works asked Seminole County GIS to add two maps to the web pages informing voters about the One Cent Infrastructure Tax; one for the proposed projects and one for past projects (i.e., the 1991 and 2001 sales tax referendums).
The requirements were that
- Residents would be able to easily find projects near them.
- The map apps would be simple to use.
- The maps would be available on mobile devices.
The time frame for finishing the project: short. The obvious solution: ArcGIS Online. The maps would be simple, include a short description of the projects in the pop-up windows, and be easy to view on all mobile devices.
Outreach and reporting for the county’s sales tax referendums in 1991 and 2001 had also included maps. In 2001, the sales tax referendum brochures [PDF] included two maps, with a basemap built with ArcGIS for Desktop and the projects and labeling imposed with graphics!
Since 2006, Seminole County has made public works capital improvement projects available using an ArcGIS Viewer for Flex app. This was one of the first interactive mapping applications provided by Seminole County GIS and worked well for a long time.
However, the Flex app was not available on mobile devices, needed a mini tutorial to help people navigate the features and before the advent of ArcGIS Online—to be viewed on mobile devices—would have required that native apps be built for the iOS and Android platforms.
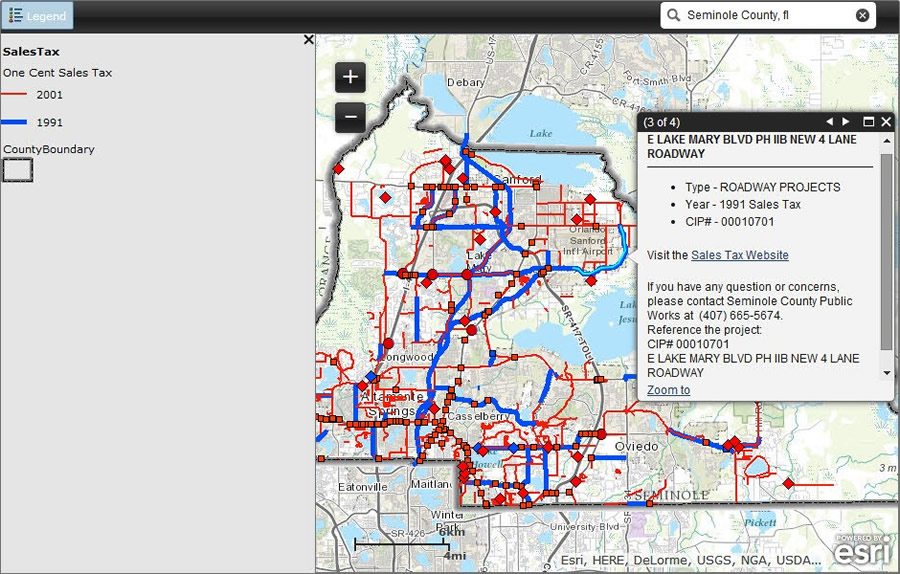
The 1991 and 2001 sales tax project data already existed as ArcSDE feature classes. These feature classes were published as a service with simple symbology and then deployed as an ArcGIS Online map for the past projects. The 1991 and 2001 projects were highlighted in two different colors and the topographic map was chosen as the basemap for its light background. Only the pop-up window was custom configured to include a link to the county website. This map took six hours to deploy from start to finish.
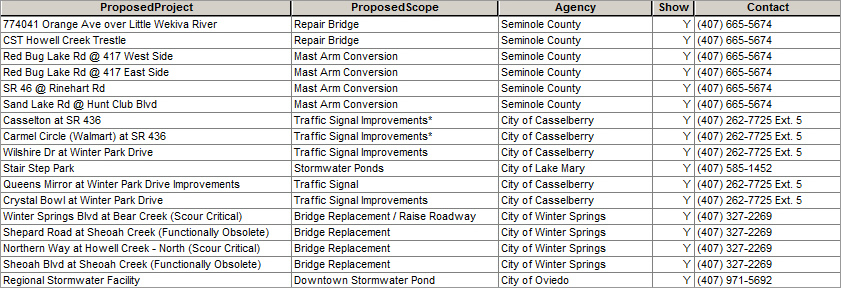
There were no existing features for future projects. Feature classes for future projects were quickly designed with the pop-up windows in mind. However, information had to be compiled from various municipalities and Seminole County Public Schools as well. The Public Works Department updated it, and the feature classes included the following:
- A name (identifying location or facility)
- A short description of the project (type of project, project start and finish locations)
- Information on whether it’s a county, city, or school project
- A contact telephone number
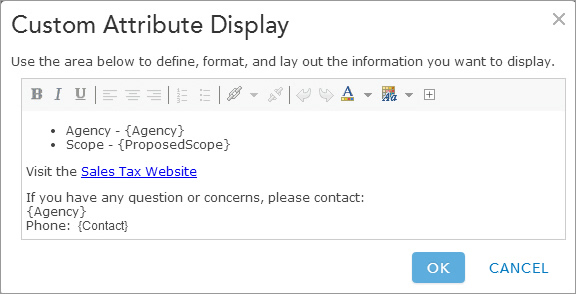
A web service was created on ArcGIS for Server, and the service was published as an ArcGIS Online map for proposed projects. The legend was kept simple—points, lines, and polygons with generalized categories. The pop-up window was custom configured so that the city/school board projects corresponded to their respective phone numbers and web page links. The map was embedded in the county website. While it took about a week to create the features for the projects, the map application took less than 10 hours to be deployed from start to finish.
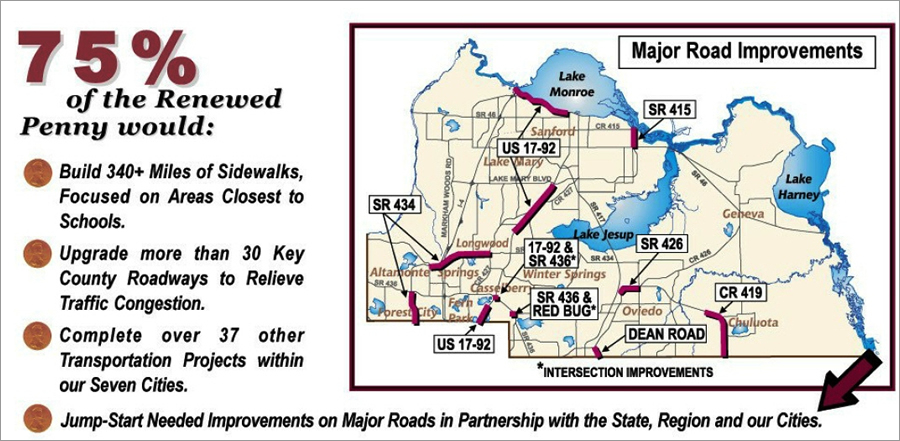
Voters passed the One Cent Infrastructure Tax in May 2014, raising the sales tax rate in Seminole County from 6 percent to 7 percent starting in January 2015. It is anticipated that the extra penny in sales tax will raise, on average, $63 million a year, to be shared by the county, the municipalities, and Seminole County Public Schools.
The map has received kudos from managers and users alike. “Your efforts to educate the community contributed to the approval of this measure and are a testament to your dedication to providing the highest level of service as possible to our citizens,” acting county manager Nicole Guillet wrote in an e-mail to the GIS department.
County engineer Brett Blackadar demonstrated its use on an iPad at a county commission board meeting last April. He said it’s available on cell phones and tablets too.
“[This is] an app our GIS folks came up with, which is pretty interesting and fun to play with,” Guillet said at the meeting, calling the app “innovative.”
