Taking that extended cruise or overseas vacation. Eliminating the long daily commute. Moving to a warmer climate. Dreams like these are fading fast for thousands of people in the United States who are nearing retirement age. Many have cancelled or postponed retirement because they lost a good job, the value of their house plummeted, or their 401(k) assets were decimated during the Great Recession. Some now believe they’ll keep working at least part-time just to pay the bills. Others who really enjoy their job and are still in good health want to continue working.
The US Census Bureau projects that by 2050, there will be 88.5 million Americans age 65 and older—more than double the population of seniors today. With more people staying in the work force longer, companies and government agencies must plan ahead to determine what types of goods and services they will need.
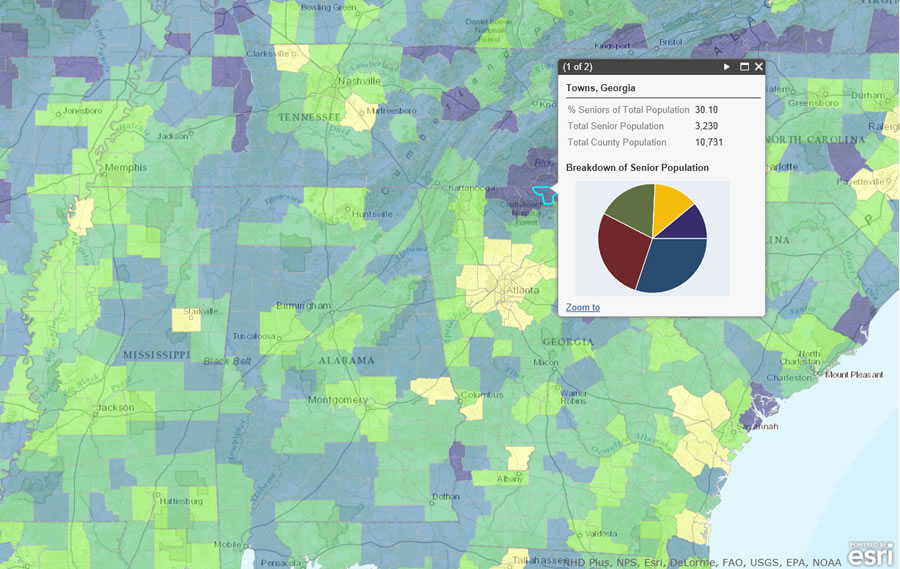
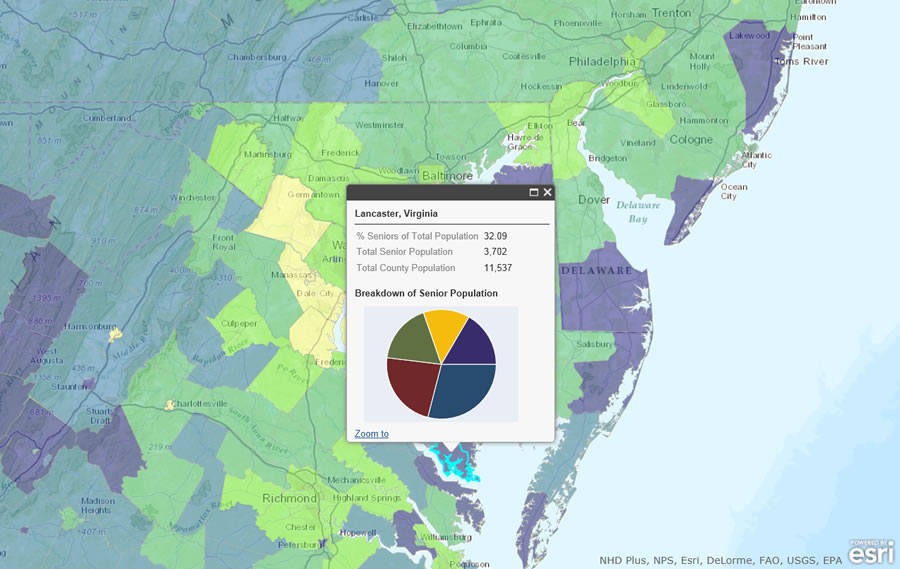
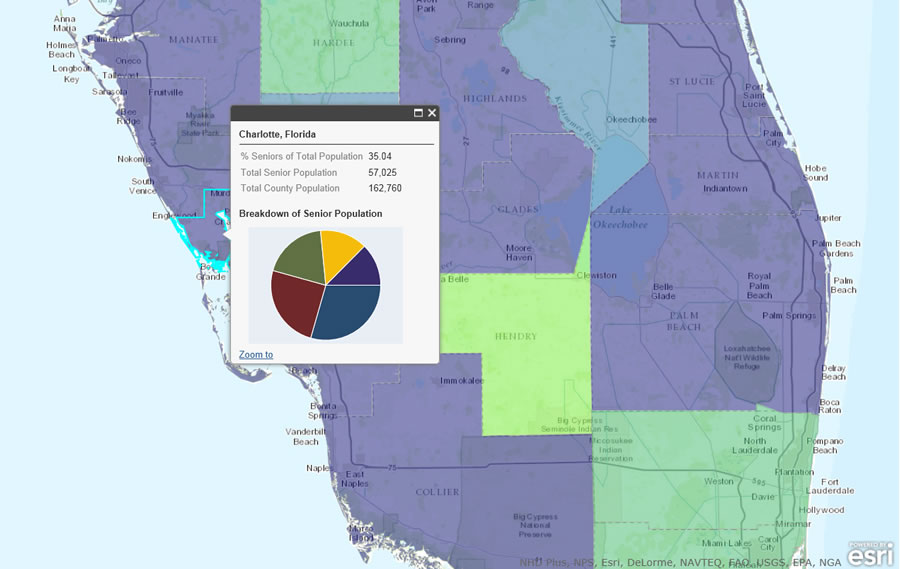
Explore this interactive Esri Web map to see where high percentages of senior citizens live in the United States. View Larger Map

Esri offers a wealth of data to analyze the demographic, consumer spending, and lifestyle trends among senior citizens, including those who will continue to work during the traditional retirement years.
Esri’s 2012/2017 Updated Demographics data includes current year-updates and five-year projections of population, age by sex, race/ethnicity, income, family type, current year disposable income, and more. Agencies and businesses can use this data to study and gain insight into the demographic composition of senior citizens by geographic area. It’s useful information for finding where and how seniors live and making decisions about how to better serve and communicate with them.
Lifestyle, product, and media preference information is available from Tapestry Segmentation. Tapestry Segmentation can be used to find out what types of books seniors read and what kind of TV programs they watch; the types of products and services they buy; and the leisure activities they enjoy. Tapestry Segmentation has nine specific segments that classify seniors—from affluent, active people age 55 and older (Silver and Gold) to more elderly people (Social Security Set) who live on low, fixed incomes.
With Consumer Spending Data, household spending by geographic area can be compared to the national average in categories such as food and drink, clothing, entertainment, financial products and services, and more. This data reveals which types of products consumers want and their spending patterns.
Data about the demand for products and services is available using Esri’s Market Potential. Demand in a specific geographic area for certain categories of products and services can be compared to the average national demand. The categories include automotive, dining out, electronics, financial services, groceries, health care, and travel.

How can all this data help government agencies, non-profits, and businesses serve working senior citizens now and in the future? The information can be analyzed and visualized to discern what types of goods and services they need in specific geographic areas.
Government agencies, for example, can use Esri’s data to study where and what types of services working seniors will need in the future, including low-cost health clinics near their homes or workplaces. Some seniors who continue to work will increasingly turn to public transportation as they quit driving their own vehicles. Local transportation planners will need demographic data to help locate new bus stops and bus shelters near these concentrations of senior populations.
Many older workers in both urban and rural areas, for example, may need or want access to senior health care programs, legal assistance, and recreational opportunities geared toward them outside regular business hours.
Some senior citizens also may be caring for elderly parents and will need services such as senior day care centers, home health aides, home delivery of medical supplies, and consultants to help with medical bills and insurance claims.

