One of the ways Esri encourages geospatial innovation is by helping newly launched businesses add location analytics to their products and services. Through the Esri Startup Program, hundreds of entrepreneurs have fast-tracked their business goals. Some use ArcGIS to enhance community engagement, while others employ the platform to strengthen collaboration. Read on to see how the following startups are doing this in both the natural world and workplace settings.

Constructing Virtual River Expeditions
The United States has 3.5 million miles of rivers and streams and more than 25,000 miles of navigable waterways. And one small startup wants to connect people to all these environments via a digital atlas.
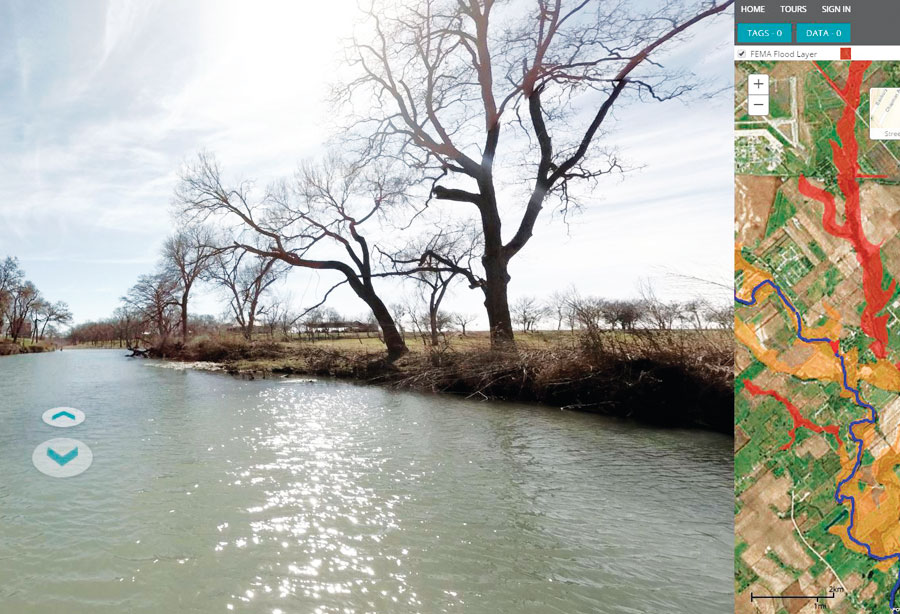
FishViews is embarking on this prodigious project one mile at a time, offering high-definition, 360-degree imagery that turns those simple blue lines on a map into colorful virtual water tours. But the company is not doing this alone. FishViews has invited the waterway community—governments, businesses, conservation groups, and all their stakeholders—to add to the curated map via ArcGIS.
Using rafts and boats (and going on foot when necessary), the FishViews team takes images from the middle of the river (or just off to the side). From this centerline, users can pan the images to see beautiful riverscapes and even go below the water, where they truly get a fish’s perspective. The app is user-friendly and provides two-way communication through tagging, wherein FishViews tags points of interest in the imagery, and viewers can respond to those tags.
Users can contribute additional data—including their own geolocated imagery—to the atlas as well so that they can analyze various environmental concerns, from habitat loss to water pollution. FishViews curates the data and makes it available in ArcGIS Online and on its own website. So users can publish their content in a wide-reaching platform while contributing to a data resource that’s valuable to scientists, kayakers, and kayaking scientists.
At Olympic National Park in Washington, scientists included FishViews in a multiagency riverscape atlas expedition to locate the biota and habitat features of the major rivers on the Olympic Peninsula. Project team members geotagged information about the distribution of fish and habitat features along the South Fork Hoh River from its source to the sea. Adding location information and visual context to the scientific measurements, FishViews created dynamic maps and built a portal to give the public access to the data collection. The resultant riverscape highlights biological hot spots along the river that are inhabited by the endangered bull trout.
Because FishViews’ imagery and geographic context make data-heavy scientific findings more interesting, conservationists were able to use the riverscape atlas to communicate their environmental concerns to policy makers. In addition, users can view the riverine photography and videos through virtual reality headsets, which really allows the river tours to come alive.

Collaborating Without Losing Control
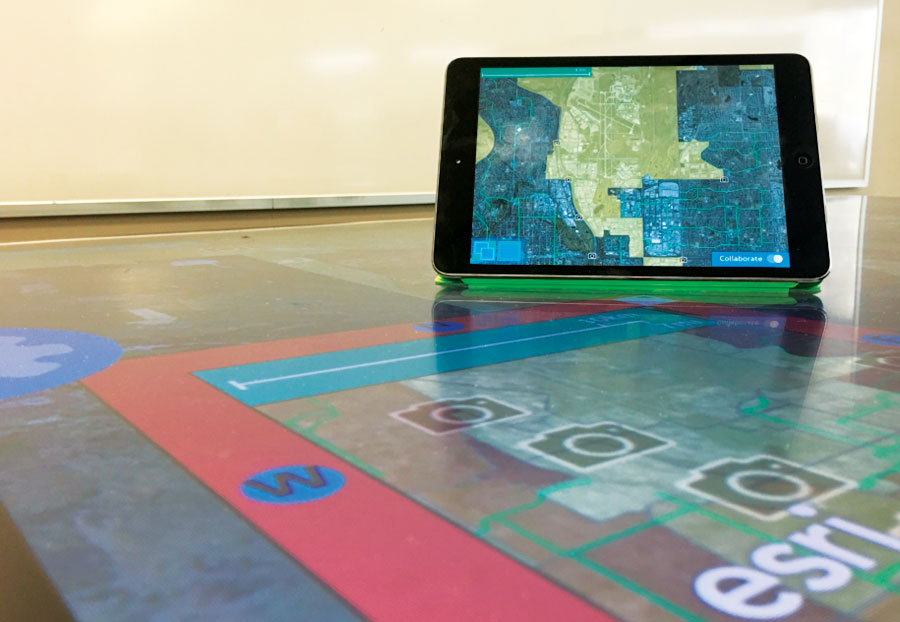
How can organizations work collaboratively without having to surrender their sensitive geospatial data? Startup VizworX has a solution: an interactive data viewer in which users come together in a common visual environment powered by ArcGIS Online.
With GeoViz, everyone can effectively communicate and participate in group decision-making because all meeting attendees can see their data in the context of what other group members are viewing. Yet, at the same time, nobody has to give access to or lose control over their data. This makes it easier for city planners, for example, to work with developers, businesses, environmentalists, and contractors. It also helps emergency responders get that critical common operating picture during a crisis.
Say a petroleum company wants to lay pipeline to connect an oil refinery with an existing pipeline a few states away. The oil company would probably prefer not to divulge detailed data that could make its pipeline infrastructure more vulnerable to attacks by vandals or terrorists. Likewise, a conservation group would likely prefer not to hand over its comprehensive species data, which could expose some animals to poaching.
Using GeoViz, a pipeline engineer, a conservationist, and a road planner could meet in person over a digital touchscreen table. They would each log in to their ArcGIS accounts, open their project data, and share it on the screen via the table’s map interface. Within the VizworX visualization environment, the three group members would bring their data together to see how the proposed pipeline corridor, sensitive wetlands, and planned road systems intersect. Each member would only show the level of detail that is appropriate for the meeting at hand. And, with the data presented in context, everyone would be able to rationally discuss problems and create solutions. Additionally, if the three professionals could not meet in person, they could also share data remotely via mobile devices. Again, collaborators would not be able to save or download anyone else’s information, but they would be able to fully engage with the data.
The VizworX visualization environment includes basemaps, image files, shapefiles, geolocated objects, photos, and other types of data. Its client software app runs on a Windows operating system that connects to ArcGIS Enterprise and accesses each user’s data via ArcGIS Online.
With interactive visualization technology from VizworX, organizations can engage with their data more effectively, ensuring better communication and solid decision-making.
Get Started with the Esri Startup Program
Companies founded less than three years ago that build software or platform-as-a-service products and generate less than $1 million annually may be eligible to participate in the Esri Startup Program. This three-year program provides qualified businesses with free ArcGIS platform technology to integrate spatial functionality into their products. Learn more about the Esri Startup Program.

