FEMA Coordinators Cory MacVie and Josh Keller Go Above and Beyond

In late October 2012, Superstorm Sandy pummeled the Northeast with violent winds, surging tides, and heavy rain and snow. In the immediate aftermath, tens of thousands of people were impacted. Houses were destroyed. Millions were left without electricity. Roads were impassable. Whole communities lay devastated from the storm’s path.
For those impacted by the storm—and for people with loved ones in the area—information, like where to find clean water and food, was a precious commodity.
One of the first questions people would ask: what happened to my home?
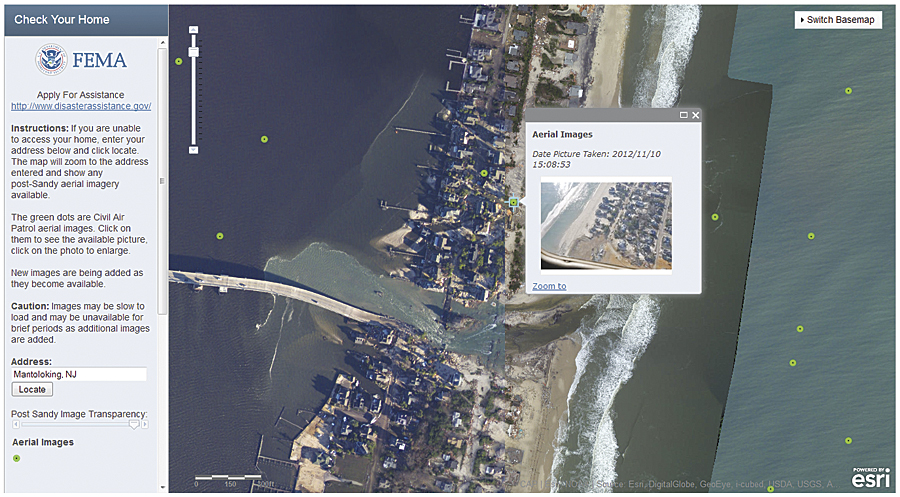
The Federal Emergency Management Agency (FEMA) was preparing in advance of the storm. As soon as Sandy finished its destructive path, staff arrived to provide aid and assistance, including mapping. FEMA regional GIS coordinator Cory MacVie, along with fellow FEMA geospatial coordinator Josh Keller, worked late into the night to create an application that allowed people to look at imagery that could help them see what happened to their home. It was made available—along with many other vital Sandy response mapping applications—to the public using FEMA’s recently developed GeoPortal platform. Built using ArcGIS Online and taking advantage of cloud capabilities hosted by Esri, the GeoPortal proved the perfect mechanism to get information out quickly. The application, called Check Your Home, provided easy access to imagery FEMA collected in coordination with Civil Air Patrol (CAP) and National Oceanic and Atmospheric Administration (NOAA) immediately after the storm.


“Like all FEMA employees, we can be deployed when needed,” says MacVie. “We both work with our local GIS personnel to support regional geospatial needs. For Sandy, we began assisting immediately.”
FEMA’s Superstorm Sandy GIS Efforts
FEMA activated thousands of employees for Superstorm Sandy, and its full arsenal of staff provided all manner of assistance. MacVie arrived October 31 in New Jersey, two days after Sandy made landfall. He is the regional GIS coordinator over Region VII in Kansas City, Missouri, and is responsible for Kansas, Nebraska, Iowa, and Missouri.
Keller worked remotely from his region to support those in the field. He is the GIS coordinator for FEMA Region X, located in Bothell, Washington, and is responsible for Alaska, Idaho, Oregon, and Washington.
MacVie first deployed as the remote-sensing specialist in New Jersey and was the first FEMA GIS support on scene in Trenton, New Jersey, at the state Emergency Operations Center. Two weeks later, he was sent to Tinton Falls, New Jersey, at the joint field office as it was being set up to coordinate the recovery effort. At each location, he produced a variety of geospatial products, such as the magnitude of damage, the extent of storm surge, and the damage to infrastructure. These products then aided federal and state decision makers with numerous logistic and operational decisions related to personnel and resource allocation.
Prior to Superstorm Sandy, Keller had been working on FEMA’s GeoPortal, which is a platform for FEMA to publish applications for use by both response agencies and the public. Built using ArcGIS Online, FEMA’s GeoPortal allowed FEMA staff to build useful information and analysis tools and immediately make them available. The agency didn’t have to spend time and resources on maintenance and hardware. It could focus on end-user wants and needs in designing applications.
“When Sandy looked like it was going to impact the East Coast, I was activated to support the National Response Coordination Center remotely, especially in the use of the GeoPortal,” says Keller. “Since the portal was new, we had little data and few people trained in publishing to the portal. I assisted with training, technical questions, etc.”
FEMA had many GIS personnel around the country, including Keller, publishing GIS data that was being collected and made available on the GeoPortal. This data included aerial imagery, surge models, damage assessments, open and closed gas stations, power outages, school closures, and more. This type of information was of great assistance to federal, state, and local officials as they determined the prioritization of resources.

Check Your Home
In a meeting on November 4, which included FEMA deputy administrator Richard Serino, MacVie presented a map showing the aerial imagery collected up to that point. It consisted of 65,000 images of damaged structures. Within two more weeks, more than 140,000 images were collected.
The oblique imagery was captured by CAP, whose volunteer pilots flew several flights a day over the designated states. The collections also included a layer of NOAA’s orthoimagery, which provided almost complete coverage of the impacted areas.
“One of the things that we threw together very quickly prior to the Check Your Home application was the ingesting of Civil Air Patrol geotagged photos,” says Keller. “In the past, they would upload the photos to the USGS [US Geological Survey] Hazards Data Distribution System website, where they would later be downloaded and viewed. But this often did not take advantage of the geotagging.”
Keller wrote a Python script to process the geotagged JPEG images from CAP and generate a shapefile that was automatically published to the GeoPortal. That script reduced the time it would take to acquire, process, and publish CAP photos from days to hours or minutes. This became the basis for the Check Your Home application.
Late on the night of November 5, MacVie contacted Keller to brainstorm how they could make a simple tool for the public to use. They both worked through the night over the phone to create an application that would allow users to type in an address and view before and after imagery of that location.
At the time, there were still more than 50,000 known displaced individuals in the New Jersey Barrier Islands. The majority of the Barrier Islands had not been reopened yet. MacVie worked on the design and layout of the site while Keller handled the coding, and later he moved the application from the development environment to the production environment.
As Keller fine-tuned the code, MacVie coordinated technical and policy logistics with FEMA headquarters, FEMA External Affairs, and Esri to prepare a production environment to host the site.
The initial application was a customized Esri portal template. It was up by November 6 at 3:00 a.m. In five hours, the concept became a reality.
Both Keller and MacVie wanted to make sure that once the site was up, it didn’t crash if mainstream media outlets picked it up. The site was in alpha stage within 24 hours, and they announced a soft launch for testing purposes with a large geospatial group. After additional improvements, the site was launched as version 1.0 and officially went public November 7 within only 48 hours of its original conception.
Within 24 hours, the application received thousands of views. Feedback was positive.
“The site was well received by senior leadership at FEMA, and it will be used in future disasters where aerial resources are available,” adds MacVie. “In the near future, we will make it even easier to use and possibly accompany the site with a small video explanation and tutorial on its purpose.”

