With New High-Resolution Imagery, New York Area Is Better Prepared to Weather Storms

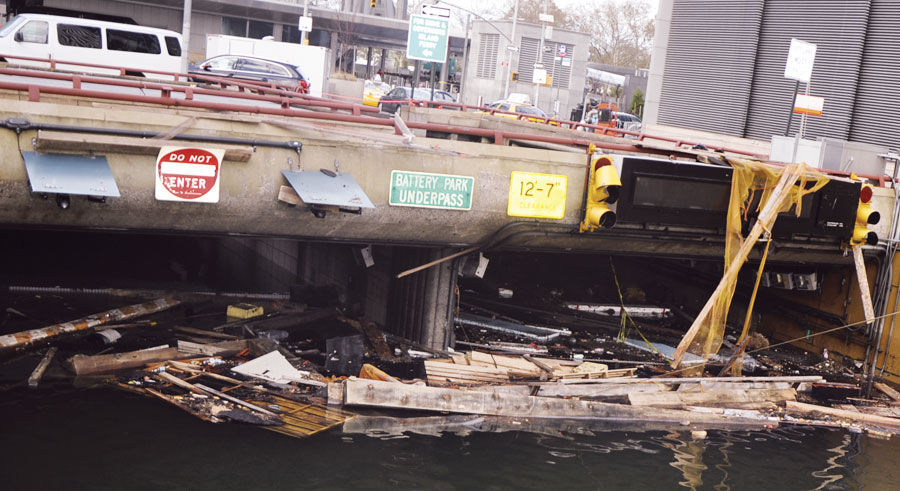
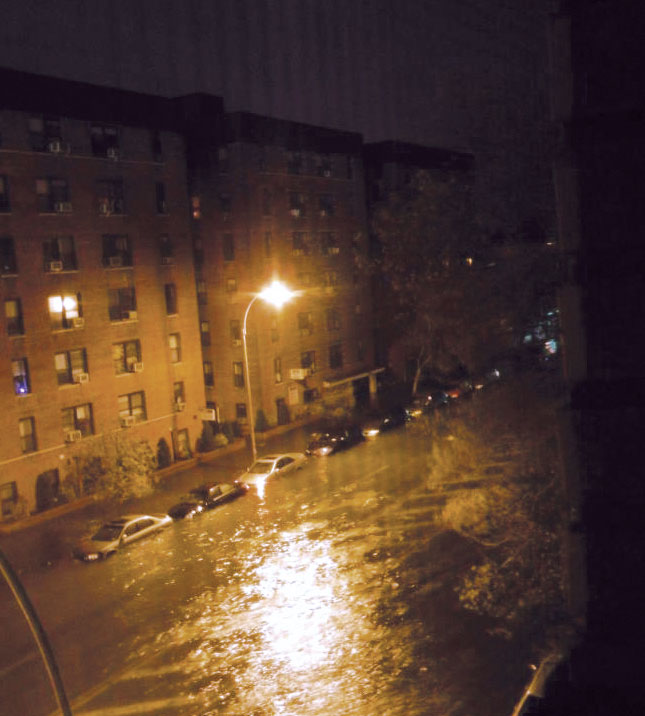
Hundreds of thousands of people were ordered to evacuate before Hurricane Sandy hit the United States’ East Coast in late October 2012. The storm—which reached category 3 status before weakening to a (still powerful) post-tropical cyclone prior to making landfall in New Jersey—became the second-costliest tropical storm in United States history.
In Suffolk County, on the east side of New York’s Long Island, the Office of Emergency Man-agement worked hard to keep residents safe.
“During Sandy, we rescued 250 people from their flooded homes [and] evacuated two major hospitals and several adult homes,” said Edward Schneyer, director of emergency preparedness for the Suffolk County Office of Emergency Management.
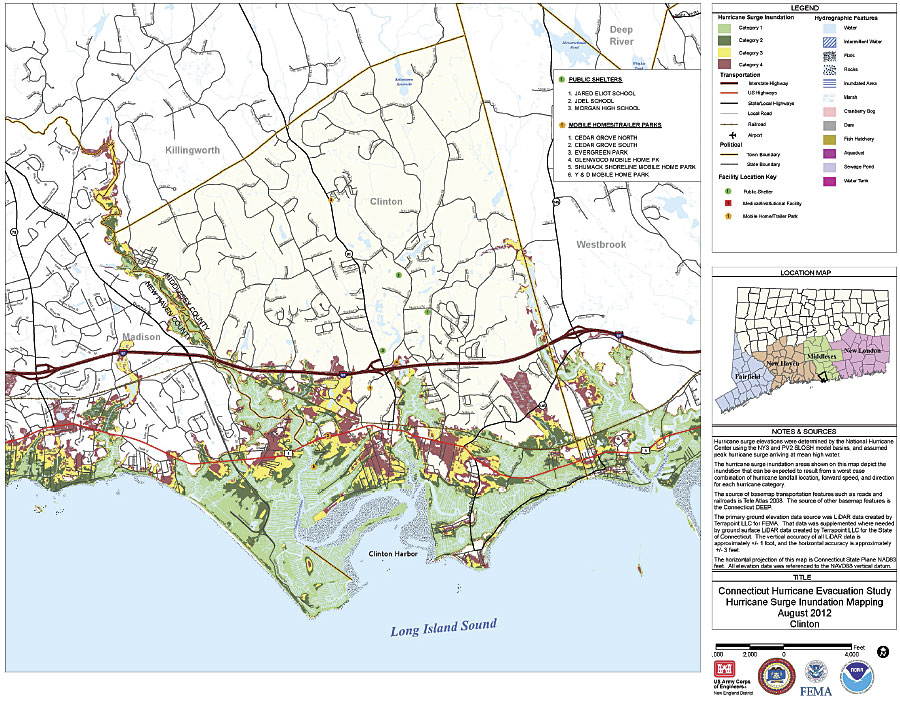
He said he and his colleagues at the agency were able to do this effectively because they had storm surge maps created by the US Army Corps of Engineers (USACE), New York District. These maps—which depict where significant amounts of water are likely to get pushed up from the sea and onto land during a tropical storm—help emergency managers in all hurricane-prone states understand the potential extent of storm surges for category 1–4 storms. They identify areas where people should evacuate if faced with the threat of a storm surge.
The USACE recently used ArcGIS for Desktop to update these maps with higher-resolution imagery and modeling from the National Hurricane Center’s Storm Surge Unit so that agencies can have more accurate information to use when educating the public about how to protect themselves and their property.

Evacuation Planning Made Easier
Developing the storm surge maps is the first step in analyzing hazards for the hurricane evacuation process.
“Historically, 49 percent of human casualties from hurricanes are due to storm surge,” said Donald E. Cresitello, USACE Hurricane Evacuation Study program manager for the State of New York. “Other impacts—like riverine flooding due to rainfall, falling trees due to high winds, and indirect impacts like carbon monoxide poisoning and electrocution—can cause deaths [too].”
The Army Corps manages hurricane evacuation studies for the National Hurricane Program. The USACE, New York District, is the agency responsible for creating storm surge maps in the New York area as well. To produce the New York Hurricane Evacuation Study Hurricane Surge Inundation Maps, it collaborates with the New England and Baltimore districts of the USACE.
The New York District’s storm surge maps go to emergency managers in New York City, Westchester County, and Nassau and Suffolk Counties on Long Island. To help emergency managers learn how to use the maps, the Army Corps also supplies them in HURREVAC, a decision-making software developed by Sea Island Software for the National Hurricane Program.
Agency officials can use the maps “for evacuation planning [and] to redefine their hurricane evacuation zones, identify where shelters should be located, and identify where assets should be staged prior to impact from a storm,” said Cresitello.
“The storm maps serve as a very valuable resource for both government and private sector agencies, as well as private residents,” said Schneyer. “As a government agency tasked with emergency management responsibilities pertaining to evacuation and sheltering of the public, we use the maps to gain insight and perspective into the geographical area impacted and use this information to determine the number of buildings or population potentially impacted by a flood.”

The Suffolk County Office of Emergency Management can also use the information in the maps to preidentify damage assessments before a storm even hits the region. This is very helpful for an area like Suffolk County, which has approximately 1,000 miles of shoreline and 225,000 residents in its hurricane evacuation zones.
Mapping with New, High-Resolution Data
To make the higher-resolution storm surge maps, the USACE used ArcGIS for Desktop. It took the latest storm surge elevation information from the National Oceanic and Atmospheric Administration’s (NOAA) SLOSH model (which stands for Sea, Lake, and Overland Surges from Hurricanes) and layered it over high-resolution lidar imagery provided by sources such as the US Geological Survey and offices of emergency management in New York City and New York State. The imagery, which had horizontal resolutions of 0.7 to 2.0 meters, showed the topography of areas in New York that could be affected.
“To come up with the actual depth of water through GIS, we [overlaid] the data out of NOAA’s SLOSH model and [subtracted] out the ground elevations using digital elevation models,” said Cresitello.
The interagency team working on the project also wrote a Python script to automate tasks such as subtracting the land elevations from the SLOSH model water surface elevations and exporting the maps into PDFs. The team then created maps using Data Driven Pages and geodatabase annotation to automatically build a series of layout pages that showed the potential storm surges for the different counties.
Better Allocating Post-Storm Resources
The new maps are a considerable improvement from the older maps because their higher-resolution storm surge modeling data and topography are more detailed and accurate than before. The new maps not only show the landward extent of inland storm surges, but they also depict the depths of the water (in feet) during different categories of storms. Additionally, the maps illustrate areas that will face more flooding and areas that will experience less.
“Knowing what the depth of water may be in those areas helps emergency managers better perform their initial response after a storm and helps them know what kind of impacts they may expect during these types of storms,” said Cresitello.
This will allow emergency managers to better focus their limited resources as they make critical decisions and lead recovery efforts.

“These storm maps provide the geographical area of primary concern where efforts and resources need to be focused to make essential and accurate damage assessments to determine life and property hazards,” said Schneyer. “In the initial stages of a response, our recovery resources are limited—especially for an event the size of Sandy. If resources are dispatched to areas that were not impacted, valuable time is lost mobilizing and reassigning those resources.”
Bringing Awareness to Residents
New York’s Hurricane Surge Inundation Maps are also for use by the general public.
“These maps provide an important level of awareness to residents that either live in a flood area or are preparing to purchase property located in a potential flood zone or hurricane storm surge zone,” explained Schneyer.
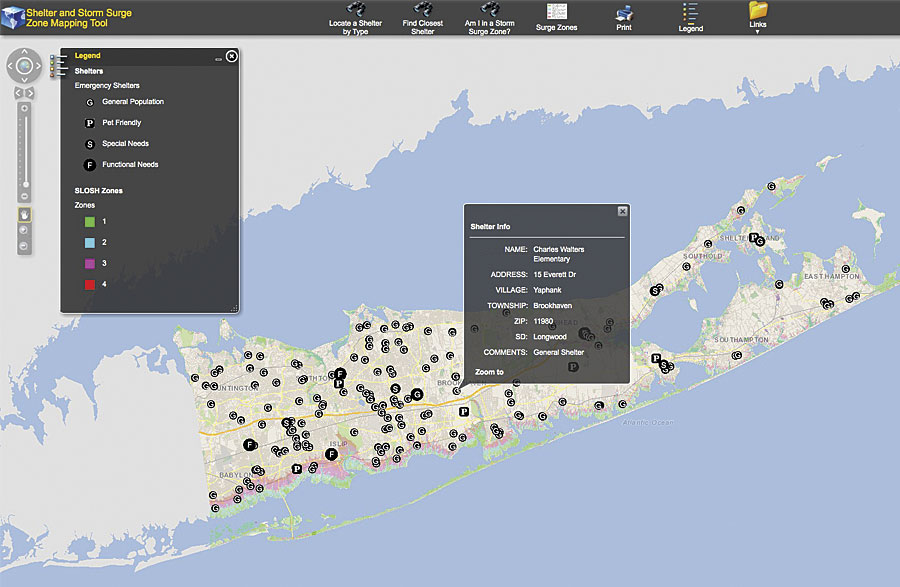
That is why the Suffolk County Office of Emergency Management is bringing this awareness directly to its residents. Agency officials have entered the information from the Army Corps’ maps into an interactive map on the county’s website. Residents can use the web-based map viewer to locate their homes and see if they live in a hurricane storm surge zone. The map displays nearby shelters as well.
The Army Corps also wants the public to use these resources.
“It’s important for people to know their specific zone,” said Cresitello. “The public should be aware of what evacuation zone they live in and should listen to their local officials…so they don’t question or ignore an official emergency evacuation order.”
During Hurricane Sandy, many people who should have evacuated didn’t, and they were stranded without help. They faced many dangers, including electrocution from downed power lines and fires from massive gas leaks.
“We don’t want the public deciding on their own if they should evacuate or not,” continued Cresitello. “If a location is in danger, then they should heed the evacuation order. It doesn’t matter if it’s six inches or 10 feet of water.”
“The more information—especially information resulting from scientific studies and available technology—the more situationally aware we and our residents will be,” added Schneyer. “This very valuable resource is an excellent tool for public education, emergency management planning, and emergency preparedness in general.”
The counties that the USACE, New York District, work with, including Suffolk County, had access to the maps when the 2016 hurricane season began.
About the Author
JoAnne Castagna, EdD, is a public affairs specialist and writer for the US Army Corps of Engineers, New York District. She can be reached via email or on Twitter as @JoAnneCastagna.

