The Metropolitan Utilities District (M.U.D.), based in Omaha, Nebraska, serves more than 600,000 people in the metro area and manages natural gas and water utilities. M.U.D. has utilized geographic information system (GIS) technology for more than 10 years. The implementation of ArcMap supported Utilities Viewer, an application that replaced paper workflows and reduced calls to dispatch. Utilities Viewer provided access to information via iPads and tough books, which improved workflows. But there were limitations. The application required an active internet connection, which wasn’t always available, and the remote connection made viewing an entire map area slow. In addition, syncing to local databases often failed. Over time, technology advanced and various applications contributed to improvements. GIS was synced with SAP, field applications became faster and more robust, and dashboards were developed to showcase data and analytics.
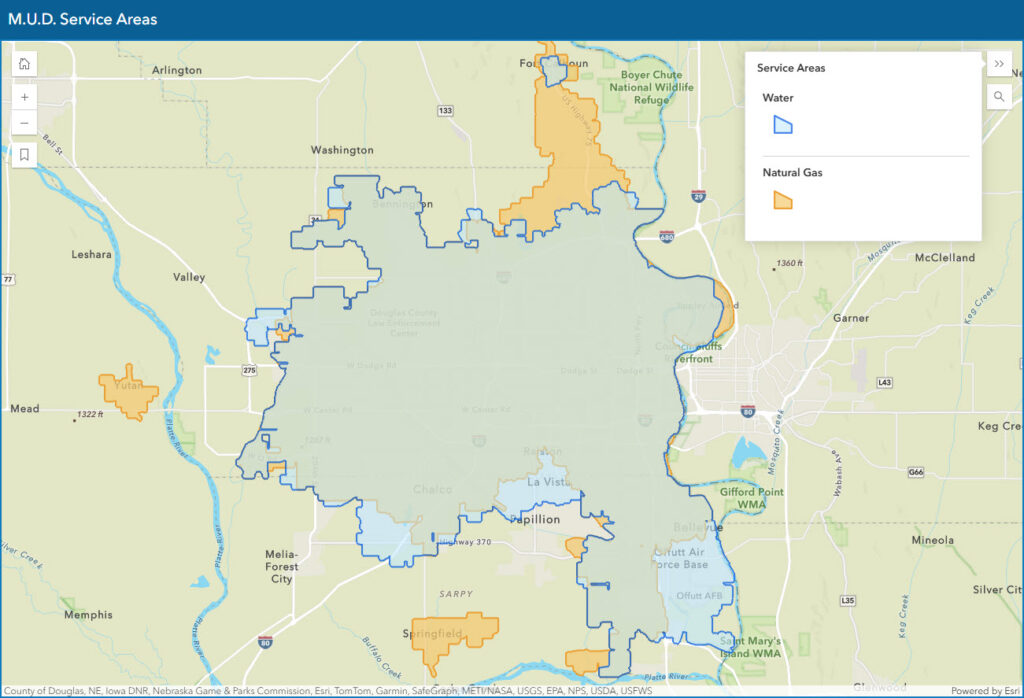
cost-effective natural gas and water in the Omaha, Nebraska, area.
Although M.U.D. has supported modern GIS-based solutions for more than a decade, staff still struggled to streamline outage and project management. Regulatory requirements, like the Lead and Copper Rule Revisions, put pressure on M.U.D to take the next step.
M.U.D. made the decision to implement Esri’s ArcGIS Enterprise and migrate to ArcGIS Utility Network. The GIS team began laying the foundation for their transition from ArcMap and the geometric network to ArcGIS Pro and Utility Network. This began with a thorough data review to identify data gaps and errors, and a strategy to improve data quality. The result is an accurate, real-world data model with full network connectivity.
Making the move to ArcGIS Utility Network
Staff at M.U.D. wanted to utilize enterprise and web mapping capabilities with the goal to streamline technology and support modernization initiatives. They knew that ArcMap was being deprecated and would no longer provide what they needed to meet their goals. Leadership at M.U.D. supported the move to Utility Network and focused on several initiatives that would improve system management in the following ways:
— Utilize improved data quality to upgrade and support hydraulic modeling and identify risk
— Develop an outage management system and lead service inventory
— Build a foundation that will support short term and long-term goals, including enabling field staff with mobile applications and high-accuracy GPS receivers to improve efficiency
M.U.D. decided to start with pilot projects on their gas and water systems with the goal of growing understanding of Utility Network and its’ capabilities. Working through the steps to set up a gas utility network provided much-needed experience mapping system data into the Utility and Pipeline Data Model. The team went through several iterations of the Gas Utility Network before achieving the goals, understanding, and functionality they wanted.
Performing the pilot project also included a review of architecture. M.U.D. staff participated in an architecture workshop hosted by an Esri senior system engineer. Within a year, a plan was executed to deploy new servers providing a robust environment for Utility Network implementation. Setting up a well-architected framework was essential for ensuring the success of Utility Network implementation for M.U.D. utilities.
“Take Esri’s advice to clean up your data and start with a pilot project. The pilot sets up a workbench that can be modified to meet your needs and support your migration. You will learn a lot and be better prepared for full implementation.” —Lindsay Dreckman, GIS Manager, Metropolitan Utilities District (M.U.D.)
ArcGIS Enterprise and Utility Network have empowered staff with a central GIS hub, powerful desktop capabilities, and GIS-based mobile applications. The ability to easily access information and to create maps and apps and share them with collaborators has improved existing workflows and enabled the GIS team to support organization-wide initiatives.
Hydraulic Model Development
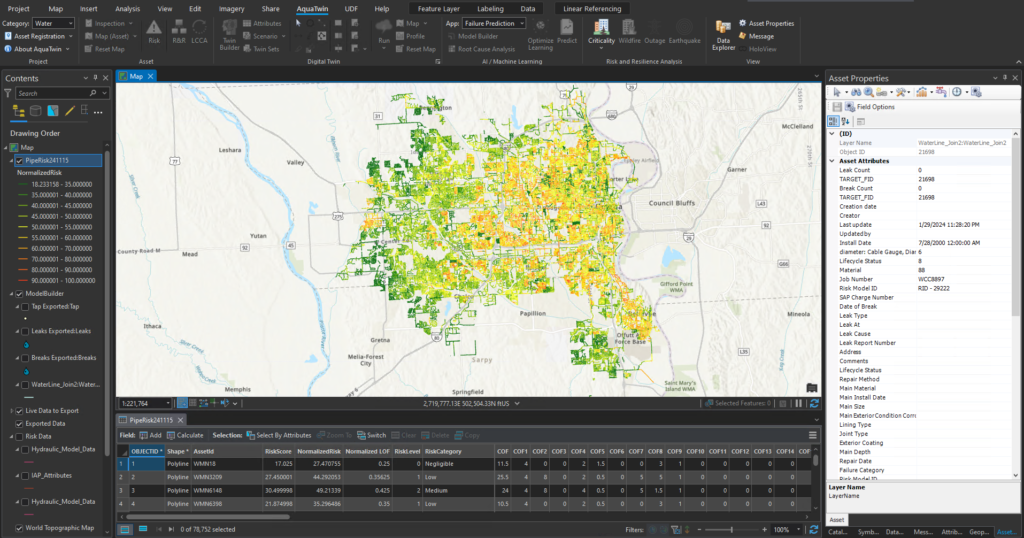
M.U.D. started developing a hydraulic model prior to implementing Utility Network. Because the hydraulic model required high-quality, accurate information, it aligned well with what was needed to support UN migration. Once they implemented Utility Network, M.U.D. engineering staff moved away from their ArcMap software-based model and implemented a solution from Aquanuity. Aquanuity’s AquaTwin Water software provides an all-inclusive water system hydraulic modeling solution built into ArcGIS Pro.
Using Utility Network as the foundation for M.U.D.’s hydraulic model provided several new benefits. When using the geometric network as the foundation, engineering staff had to spend significant time doing data cleanup after the data was in the model. Utility Network rules and connectivity requirements provide consistent, high-quality data, which has reduced the need to clean up the data when renewing the model.
“Using data from the UN [ArcGIS Utility Network] has resulted in less time fixing connectivity issues in the hydraulic model. The built-in connectivity rules ensure good data, which is very important when modeling flow through our system, knowing what’s connected to what and how the system flows together.” —Evan Martin, Director, Infrastructure Integrity, M.U.D.
Analytics Identify Risk and Enhance Sustainability
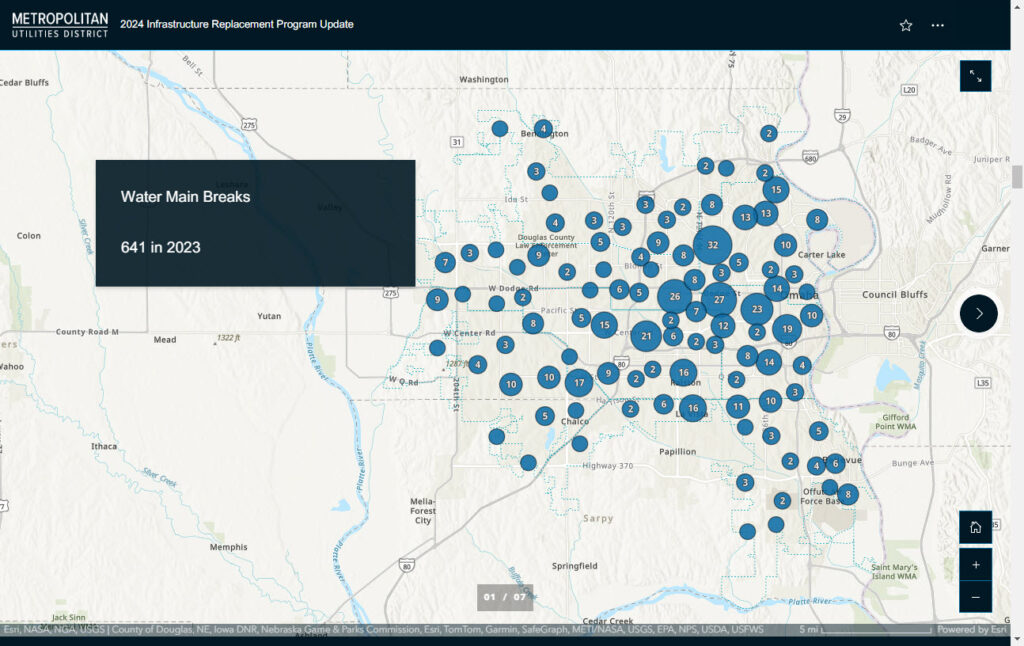
M.U.D.’s robust water main break information (digitized records going back to the late 1950s) creates a foundation for risk modeling and planning. Staff use GIS to identify critical customers and previous projects in the area and to review asset information such as main size, material, pressure, and slope. This information feeds the Aquanuity software, resulting in risk prioritization and better-informed capital improvement planning.
Results from the risk model are published to a web map and shared across departments within a story created with ArcGIS StoryMaps. This format enables clear communication about risk to water mains, prioritization of capital projects, and replacement program strategies, and also provides a clear display of project areas and boundaries.
Engineering Project Life Cycle / Capital Improvement Planning
Two great maps have been developed to communicate information explaining how M.U.D. creates a strategic capital improvement plan (CIP). One map shows water main break information and material type and is shared with the board of directors to help them understand why the CIP targets specific neighborhoods, and not others, for water main replacement. The other map visualizes the growth of M.U.D.’s water system. Exploring this map shows how the system has expanded west through the city over several decades.
Building an Outage Application
Prior to GIS modernization at M.U.D., staff used a custom tool in ArcMap that required them to identify meters within an outage area on the map using a lasso. The tool would then export the information from the identified area into a spreadsheet. After this step was completed, a mobile mapping application was used to review each valve. The application required field staff to click on each valve, one at a time, and determine how many turns it would take to close the valve. Data inaccuracies often led to communication gaps between the field staff and customers.
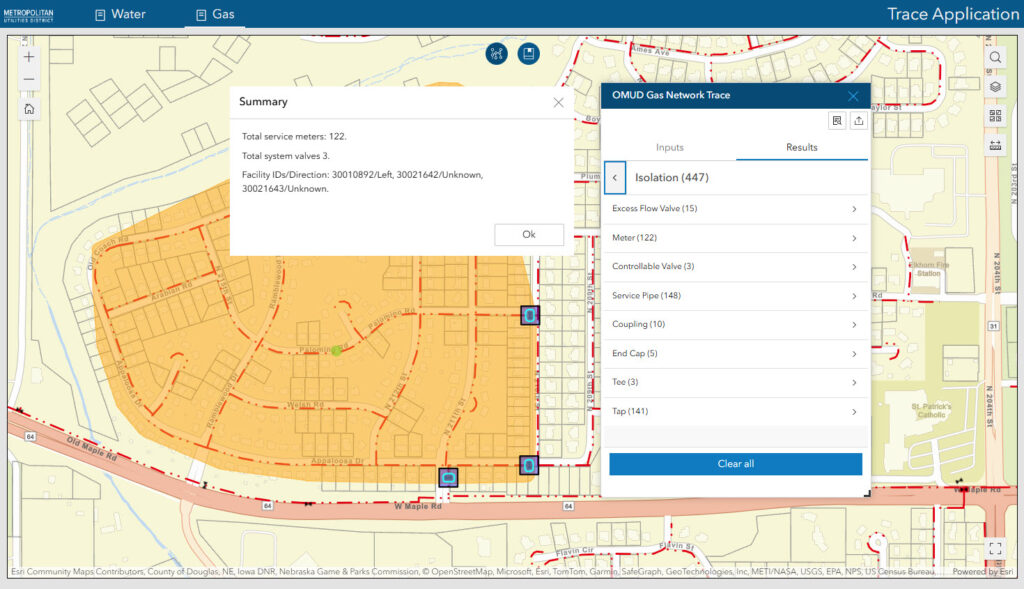
Shortly after upgrading to ArcGIS Enterprise, ArcGIS Pro, and ArcGIS Utility Network, M.U.D. launched a project focused on creating a new outage application. The GIS team’s goal was to not only provide a new tool, but to improve the existing workflow as well. They used ArcGIS Experience Builder to create an app that leveraged Utility Network trace configurations and facilitated integration with SAP and the ArcGIS Enterprise portal to notify customers of an outage in their area. Trace functionality within the application enabled staff to view a map from the field, tap on a main to identify an outage point, and perform a trace that provided the number and location of valves that needed to be closed in order to isolate a leak or main break. It also showed the total number of customers impacted. This easy-to-use application eliminated the need for field crews to use multiple solutions. The outage application is the first step in initiating a lengthy process that includes multiple stakeholders. After the application is used and released, the meters within the outage area are sent to SAP for customer notifications and an autogenerated polygon is placed on a web map. Another application is used to close the outage after it is resolved and send a message to customers letting them know everything should be back to normal.
In addition to creating the new application, the GIS team was challenged to put the app into use. At first, field crews were reluctant to use the application, but a tornado proved the value of the new workflow. As M.U.D. prepared for the approaching tornado, field personnel equipped with the new outage application arrived on the scene. With little effort they were able to identify isolating valves and generate a list of impacted customers. The app pulled customer information from SAP and displayed it in a dashboard that enabled the corporate communications team to work with customers. After the tornado, the GIS team continued to enhance the application based on feedback from field crews. Today, the tool can trace an outage, summarize valves and customers, publish a polygon, sync to SAP for customer notifications and generate a list to relight customers. The move to ArcGIS Utility Network laid the foundation for this success.
“Our outage tool allows users to run tracing on an iPad in the field to make real-world decisions. The tool allows for flexibility that is necessary in emergency situations.” — Lindsay Dreckman, GIS Manager, M.U.D.
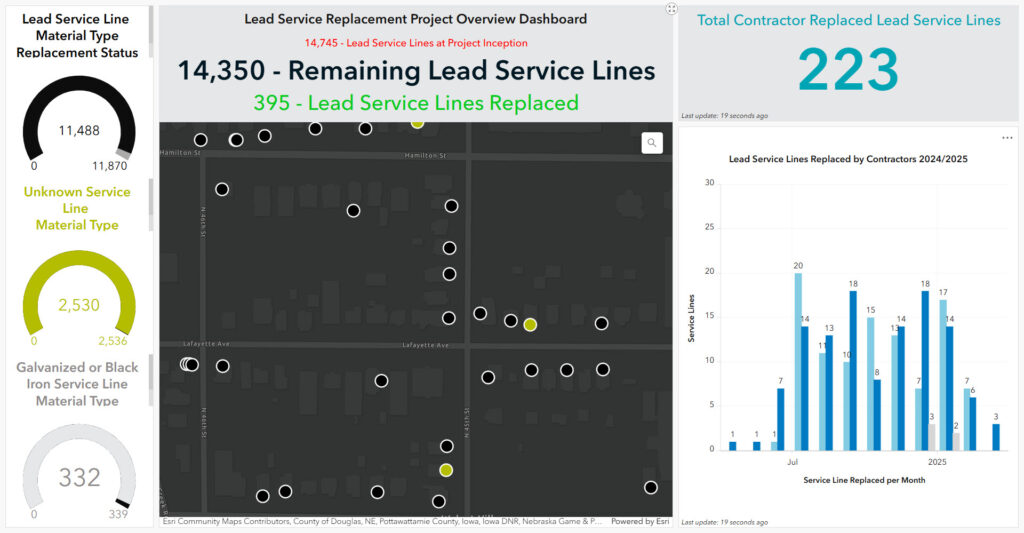
Identifying and Replacing Lead Service Lines
Complying with the US Environmental Protection Agency’s (EPA) Lead and Copper Rule Revisions and being prepared for the Lead and Copper Rule Improvements was another initiative M.U.D. staff focused on during their GIS modernization. They needed to develop workflows and applications that would enable streamlined identification and replacement of lead service lines in their service area. The GIS team wanted to utilize the high-quality data within Utility Network and avoid creating an additional database.
The initial goal was to compile a water service line inventory that could be published to a public-facing map. M.U.D. worked with Esri to create a Python script that utilizes the utility network trace capabilities to tie linear asset data to meter points. M.U.D. is prioritizing lead service line replacements in areas with high densities of homes with infants and children as well as areas with high concentrations of lead service lines.
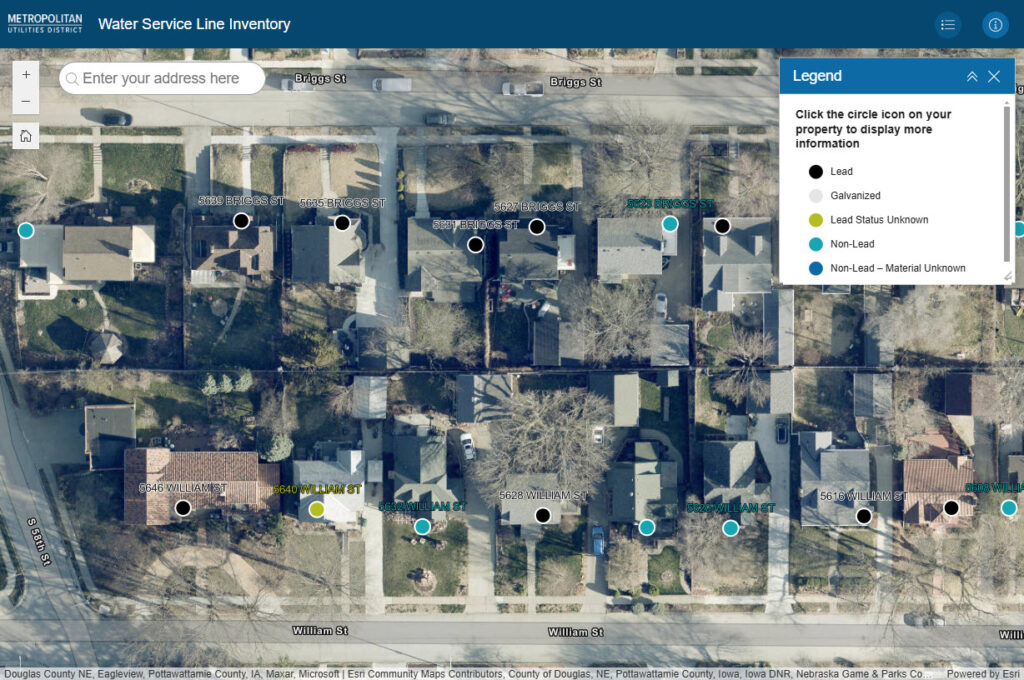
ArcGIS Workflow Manager and ArcGIS Survey123 are being used to streamline workflows supporting lead service line identification and replacement. The replacement work is primarily done by plumbers, not M.U.D. staff. ArcGIS Online facilitates GIS-based solutions to increase collaboration and transparency during replacement projects between plumbers and staff. Plumbers use a survey to collect material type information found at the tap, on each side of the valve, and at the meter, along with capturing photos at each location. This helps determine if a replacement is required and collects data required for state reporting.
ArcGIS Dashboards are used by the plumbers to see their assigned work. Pop-ups driven by ArcGIS Arcade connect plumbers to the pre- and post-inspection surveys. When a survey is submitted, Workflow Manager runs in the background to link the rest of M.U.D.’s staff to complete quality checks and route updates back into the GIS system. Dashboards are also used for managing project work and replacement schedules.
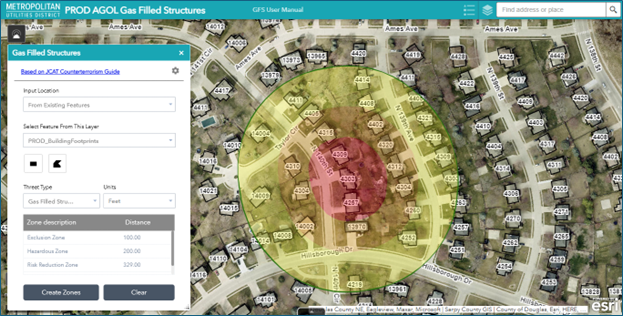
Responding to a Gas-Filled Structure Situation
The M.U.D. security department was a leader in publishing the ruling for the American Gas Association and how to respond to a gas-filled structure. The GIS team used the threat analysis widget to generate zones of exclusion around a property. This tool not only creates situational awareness for field crews, but is also shared with the fire departments and first responders arriving on the scene.
Partnering for Success
M.U.D. has been an Advantage Program partner with Esri for more than 15 years. Esri technical advisors and Esri Professional Services partnered with M.U.D. during the pilot programs for Utility Network. Esri was selected to assist in the implementation of ArcGIS Enterprise and migration to ArcGIS Utility Network. Their expertise and experience with Enterprise deployments and Utility Network implementation, along with their knowledge of M.U.D. data models created during the pilots, made them an invaluable partner.
Collaboration between Esri Professional Services and M.U.D. GIS staff also aided development of the outage application and solutions supporting regulatory requirements set by the Lead and Copper Rule Revisions.
Staff at M.U.D. and Esri are looking forward to continued collaboration as they support goals to
— Automate reporting.
— Streamline corrosion control and cathodic protection workflows.
— Use Workflow Manager and SAP to automate the creation of work orders for service line replacement (aka digital service cards).
— Configure and update the outage workflow and application to track duration of an outage.
— Implement use of the outage application for planned work.
— Improve the as-built process and integrations with AutoCAD.
Stay Connected with Esri’s Water Team
ArcGIS is an extensive information system that enables modernization of workflows with easy-to-use applications for the field and office. Strengthen your organization with solutions that will increase efficiency and provide insight for decision-makers. Visit the Esri Water Utilities web site for more information.
Join the Water Utilities Community
Follow #EsriWater on social media: X | LinkedIn
Subscribe to the Water Industry newsletter “Esri News for Water Utilities and Water Resources“
About the author