If 2020 has taught us anything, it is this: change is the only constant. The events of 2020, like COVID-19, wildfires, hurricanes, and social unrest, have impacted the way we work and live. And for organizations, how they react to these events and plan for similar events can determine their success.
Successful organizations have long recognized that accurate data drives better decision-making. As the world around us changes, we need to think beyond traditional business data like sales numbers or growth rates. We need to incorporate data that measures the forces impacting our business such as pandemic events, economic shifts, climate change, and social risks across the globe. Technology advancements give us new data that we previously did not have or were cost-prohibitive. Examples such as aggregated human movement data, social media, and real-time event data are just a few of these new data we can leverage.
When companies realize the benefits of location technology and how Esri technology can support them, their next questions always lead to data. Where do I get the data? What type of data do I need? How do I use the data I have in my business systems? All these are valid questions that require an understanding of your desired outcome.
I’ll focus on human movement data and give more insights into this type of content and highlight some companies that provide this type of data. We often get questions about how human movement data is created and how it can be used best with Esri technology—human movement data in simple terms.
What is human movement data?
Human movement data is collected from devices like cars, phones, and fitness trackers. Instead of identifying individuals, the data is anonymized to create a broad picture of where people move.
What can human movement data tell us?
Using human movement data, we can learn where people are traveling throughout the day and how this differs at night. We can see how the time of day influences human movement through your area of interest. We can also identify commute times, popular daytime and evening locations, origin and destination, visits, dwell time, and more.
How do I use human data in conjunction with GIS?
You can derive demographic and lifestyle characteristics and associate these with polygons at the ZIP code, census blocks, street segments, or intersection levels. This process is called geoenrichment that results in information products showing buying power, demographics, and lifestyle interests coming in and out of neighborhoods at certain times of the day.
What questions can human movement data answer?
We can start to understand changes and see patterns in demographics and consumer behavioral traits over time. Movement data helps organizations discover patterns of behavior for human mobility, store visits, and traffic routes. Understanding current and historic movement patterns can help you predict outcomes for future events whether that is a retail spending analysis or a pandemic event.
How do I get started using new data sources?
We share some human movement data, but let’s not forget the wealth of data in your organization. Forward-thinking companies are making business decisions by combining their existing business data with state-of-the-art content previously not available. By leveraging Esri’s ArcGIS location analytics environment, you can help your organization gain new insights, identify risks and opportunities, and make better-informed decisions.
Let’s outline some examples of how companies are leveraging human movement data from our partners through the ArcGIS Marketplace to develop new insight:
- UberMedia—UberMedia provides mobile location data, analytics, and media measurement for businesses of all sizes to better understand and capitalize on the behaviors of its consumers and the performance of its competitors. By combining consumer data with spatial analytics and mobile capabilities, Esri users can deliver the precision detail required to improve the overall customer experience and give consumers more reasons to buy.
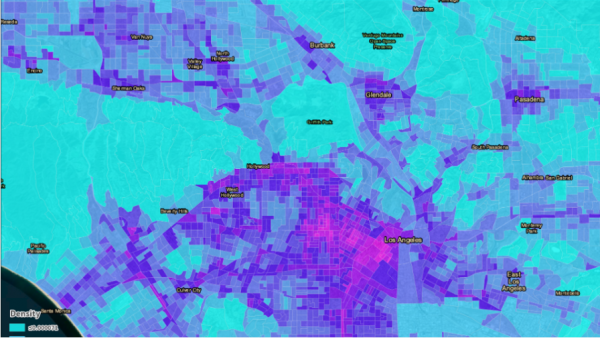
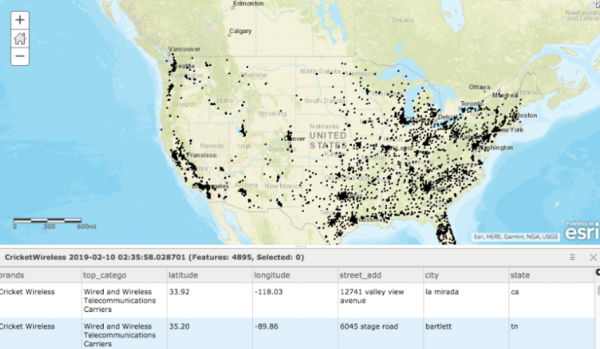
- SafeGraph—SafeGraph provides points of interest (POI) datasets with business listing, building footprint, visitor insights, and foot traffic data for every place people spend time or money in the US. Leveraging this data and Esri’s powerful spatial analytics provides users with the ability to understand at a granular level what is going on in the market. Learn more here.
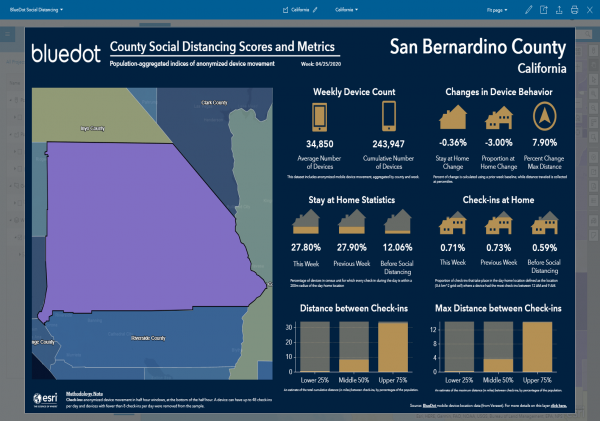
- BlueDot’s social distancing data is available in the Esri COVID-19 GIS Hub for every county in the United States via this link. It contains many different attributes about the behaviors of people in each county and how those behaviors change. Learn more here.
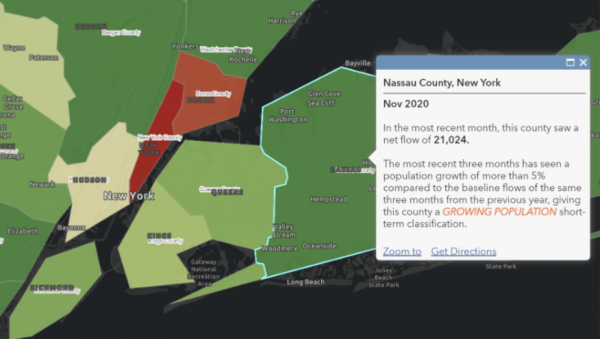
- Unacast—The Emerging Areas dataset examines the inflow and outflow of people along with their income indicators and classifies the area’s growth and change in composition. You can identify the features/characteristics of an “emerging area” and then rank the areas that are overindexed for those characteristics. Learn more here.
The short video below discusses five examples of new data sources like human movement data now commonly used by analysts and data scientists to make better-informed decisions in the face of an ever-changing market environment.


