In 2025, a teenage girl named Lauren Olamina leverages her geography skills to escape fires raging in her suburban Los Angeles neighborhood, exacerbated by climate change, social upheaval and economic instability.
I didn’t read this in the news. She did not go viral on social media. She is a character in a science fiction novel written in the 90’s by Octavia Butler.
But she is all of us.
Spoiler alert…she doesn’t escape. She goes on, rather, to settle a small community that adapts.
This too will be all of us, or more specifically, could be all of us. We have choices to make, and we have tools to help us know how to make them.
I don’t know if Butler knew about GIS in the 90’s when she wrote her two Parable novels, but just east of Los Angeles in Redlands, California, Esri was well underway as a growing company whose values centered on building geographic tools to empower our communities to reveal actionable insights in how we plan the business of living.
On a visit to Esri’s headquarters a few years ago, I spent some quiet time in our library on campus. In the library exists binders stuffed with the agendas and proceedings of every Esri User Conference we have ever had. I pulled the binder of my birth year and skimmed the contents.
What struck me was that our message has not wavered in all those years. GIS reveals and untangles the complexity of interplay between our economic systems, social systems and environmental systems. Armed with that ability, GIS also allows us to virtually “pluck” on the strings of these systems and predict scenarios before we experience them in real life.

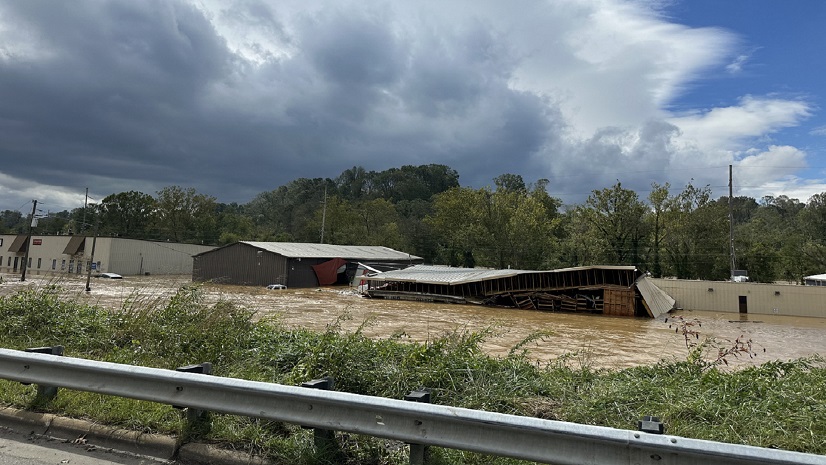
What happened in Los Angeles was predicted. What happened in Asheville with Helene was predicted. We can also predict that climate impacts will be experienced everywhere, in different ways and to varying severity, and craft plans to help us mitigate and adapt to those predictable scenarios.
Prediction and time travel are two enticing themes we see in storytelling over and over again, especially in science fiction. It pulls deeply on the human desire to avoid terrible things and warn our future selves.
GIS is not science fiction, and yet it allows us to both make predictions and to time travel… to examine the patterns of the past and present that allow us to peer into our future and shape that future with greater wisdom and insight. It is real, it is has been here for a long time, and organizations of all kinds all over the world are embracing it for climate action planning.
But planning is not enough. How many times, post-disaster, do we read stories about how we had a plan for this, but we simply failed to implement it? We must implement those actions and make them systemic in how we conduct our everyday business of living and decision-making. I’m heartened to know that communities are using GIS to do that too and I’ve asked my colleagues to share those examples with me.
I am no Octavia Butler, but if this blog inspires communities to see a vision of themselves as they could be – and to make the choice to implement their GIS investment holistically, and to operationalize climate action plans into the everyday business of living… it will be a success.
I am often asked by other customers to point to that singular customer who is the shining example of what a “perfect” GIS implementation looks like. I always tell them that the race for that title is still ongoing, and they have a chance to be that customer! For a little inspiration, we can certainly pull examples. It is in that spirit that I share the following. Below are some case studies that touch on how different aspects of government have leveraged their GIS investment to transform their business practices for a more resilient and sustainable future. While each of these stories are very real, perhaps we can take a moment to be a sci-fi writer and imagine these stories as coming from a single city… our city… our future.
The City of the Future: Case studies
LAND RECORDS
“When the wildfires hit, the critical nature of parcel data immediately became clear. Recovery would be impossible without it,” is a quote from this case study, Navigating Parcel Migration Amid Maui’s Wildfire Aftermath. What do land records have to do with implementing climate action plans? If communities are to adapt to a future we can predict, then it starts at the ground-level – the basic units of how government organizes the landscape: Parcels. Modernizing our business systems and workflows into modern GIS is an act of sustainability in and of itself… positioning governments to gain greater insight and respond more quickly during extreme scenarios, and even attribute climate risk down to the parcel level like many cities have done with Esri Business Partner Fernleaf’s AccelAdapt.

TRANSPORTATION
The impact to roads in Western North Carolina, resulting from Hurricane Helene, continues to have a major impact on traffic here. As I write this, I-40 is still closed for repairs while new sections collapse. A major cut-through in Asheville is completely gone, resulting in crippling rush-hour traffic and major economic centers isolated from communities that need them. Transportation agencies have a massive role to play in developing a climate-smart community. Maryland Department of Transportation (MDOT) is a great example of how GIS allows them to operationalize climate scenarios into their planning and design processes – allowing them to make justifiable and defensible decisions that reduce costs while ensuring more sustainable and equitable outcomes well into the future.

PUBLIC WORKS
Perhaps one of the ripest opportunities for visionary leadership is within public works departments. Take, for example, this story from the City of Miami Beach. With so much focus on resisting the inevitable impacts of climate change, the city is positioned instead to take advantage of certain aspects.
“As sea levels rise and saltwater pushes up, there’s a layer [lens] of freshwater between the surface of the land and the saltwater,” explained Coley. “If we lose that, our vegetation will go away. But by using blue and green infrastructure, we can constantly replenish that freshwater lens and abate the sea level that’s rising beneath us.”
“Flooding is a nuisance, but that freshwater is a very valuable asset to the city for preserving its freshwater lens and keeping seawater down,” added Alvarez. “In this way, we can convert what is initially a liability for the city and bring it into use.”
This case study outlines how this is even made practical and feasible. The city has consolidated its public works projects into GIS, allowing them to look at them through additional layers of climate projections and the city’s existing infrastructure. Their GIS successfully integrates the past, the present and the future – where projects have been implemented and how they’ve performed, what projects are currently happening and where issues like flooding are still persistent, and what modern climate projections tell them about how to approach their capital improvements more efficiently and effectively, with multi-benefit outcomes. Beyond just better planning and implementation, illustrated by the quote above, the city is positioned to know how to take advantage of their periodic flooding instead of being crippled by it.

Designing Your Future: Getting started
In 2025, I’m looking to collaborate with my colleagues across a variety of industries to illustrate many more examples of how communities and organizations of all kinds use their GIS technology to operationalize climate action plans for resilience and sustainability. Your community might be that next example – you can shape the City of the Future.
To sharpen your skills, we are once again offering the GIS for Climate Action Massive Open Online Course (MOOC) so make sure you’re enrolled in this free training course!
Additionally, please check out more information and resources in our brochure, Confronting the Climate Crisis: GIS for Climate Action Planning and/or on our website.


