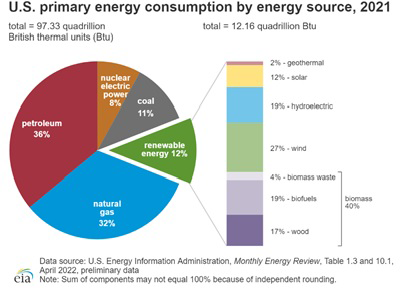
The US Energy Information Administration (EIA) recently published a stunning chart that shows all the energy the US consumed in 2021. The number is an amazing nearly one hundred quadrillion BTUs. For those who forgot your high school physics, BTU stands for British Thermal Unit, a measure of energy. The EIA used BTUs to combine all energy usage forms using one metric. Fossil fuels produced eighty percent of all energy consumed.
If we get to 100% decarbonization, we will have to generate, deliver, and use four times as much clean energy as we do today. Much of the energy currently consumed using fossil fuel will be delivered using electricity. So for those of us in the electric utility business, we will be very busy.

What’s the Plan?
So that means that most of our power production will have to migrate to non-fossil fuel sources. That’s a lot of wind farms and solar systems. Since these sources are variable, we will probably need as much storage as we have generation capacity since we will not have many large-scale power plants to prop up the voltage. Elon Musk believes that if we built a huge solar farm in the Southwest desert, we could power the entire US with solar energy. He believes it would take 10,000 square miles, about the size of Lake Erie. There is much speculation about the area needed, which depends on the panels’ efficiency, placement, and control. Whatever the number is, it is big.
The location will be critical. So we will need an aggressive plan to locate this much solar capacity. That’s where GIS comes in. We must ensure that we don’t make the mistakes we made during the 1950s and early 1960s with urban renewal. We must be careful about environmental, cultural, aesthetic, and social equity issues. The beauty of GIS is that it models these factors in all kinds of detail. And using GIS spatial analysis, we can incorporate these factors well before we employ the backhoe and the wrecking ball.
That’s Just for Power Generation
Aside from power generation, the US will also need to upgrade the delivery grid. And by a lot. By some estimates, the grid will need to expand its capability by two or three times. One of the utilities’ most difficult tasks today is siting large transmission lines. High voltage lines are dangerous and, to some, unsightly. Given the issues with high winds knocking down trees on transmission lines and causing wildfires, we may see many Public Utility Commissions demanding that utilities bury their transmission lines. That will substantially increase the cost and complicate the difficult siting process. Again, GIS will be a key tool for routing the new transmission lines.
How to Power All These Cars
Note that thirty-six percent of our energy use comes from petroleum. Oil is mostly used in transportation. The move to electric cars and trucks is rapid and will take a big bite out of that eighty percent fossil fuel usage. Many look at hydrogen as another clean energy source for transportation, particularly for big rigs and freight trains. However, clean hydrogen will be produced by electricity as well.
If all goes according to plan, gas-powered cars will be things of the past, like phones hanging on the wall, telephone booths, or horse-drawn carriages. There are nearly 300 million light vehicles registered in the US today. If all of them were electric today, the low and medium-voltage distribution systems would be overwhelmed. While there is still time, utilities need to use GIS tools, such as ArcGIS Utility Network, to model the transition. They will also need to use spatial analysis to determine what demographic is most likely to buy an EV and where they are. And that’s just for home chargers. They must determine where developers and car makers will site high-capacity fast chargers. Car manufacturers see the move to EV as a golden opportunity to get into the energy supply chain, so collaboration with the auto industry is necessary for utilities. Again, they will need the help of GIS to work with these new market entrants to determine exactly where the impact of new types of charging, such as induction charging and technologies such as vehicle-to-grid systems, is most likely to appear.
It’s All About Where
While transportation represents a huge chunk of greenhouse gases, most homes, factories, and businesses use fossil fuels for heating. To fully decarbonize, those facilities will be migrating to electricity as well. The challenge will be determining when and where this transition will likely occur. Again, it’s all about where.
GIS is special in that it is not just about making digital maps. Sure it does that remarkably well. But it is also a system of record, capturing the location of every piece of the massive electric grid. And the condition of those assets. And their relationship to each other, the customers, and the land. It’s all connected. GIS makes those connections. GIS is also about discovery, helping developers, planners, and utilities to find the right location for the massive amount of new equipment that will show up in a hurry to meet these enormous future challenges.
Finally, GIS helps people get information easily through real-time web maps and dashboards – letting the stakeholders, you and me, the media, and the people in charge know what’s going on now and what will happen tomorrow, next week, and the next decade. So we can all be prepared.
Oh, the answer to the quiz in the title is 15 zeros. That’s a huge number. Learn how GIS helps utilities plan for today and tomorrow.

