By Chelsea Boozer and Alex Harper, GIS Manager, Central Arkansas Water
From the management of underground assets, such as pipes, valves, and meters to an automatic fire hydrant inspection notification system and efficiencies in our billing system, GIS increases the quality of service our utility provides every day.
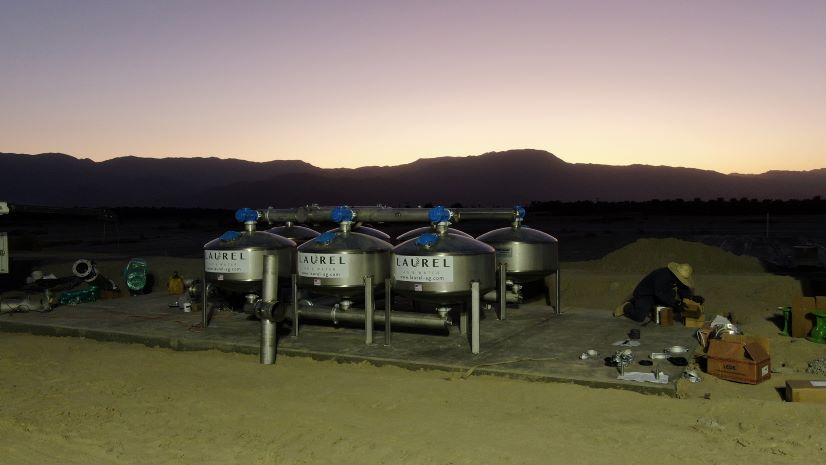
Central Arkansas Water (CAW) is based in Little Rock, Arkansas, and serves nearly 500,000 people in 23 surrounding communities. We maintain more than 2,600 miles of pipe.
The utility began using Esri technology in 1996. Since then, we’ve continually expanded, taking advantage of the capability to configure GIS-based tools to meet the needs of our organization.
“GIS provides a lifeline from the workers in the field to critical information to help them on a daily basis, whether it’s being able to quickly locate a valve, isolate a main break, or to find a meter to assist a customer,” CAW’s director of distribution, Blake Weindorf, said. “GIS enables us to have this information literally at our fingertips.”

Access to Information from the Field Improves Operations
CAW has digitized and attributed every known main, valve, and meter in the water distribution system. Our system is composed of 41,622 valves; 16,376 hydrants; 202,000 meters; and 2,600 miles of pipe, all within a 721.18-square-mile service area.
Previously, every crew truck carried around a physical map book to look up main and valve placements. CAW uses Cityworks, a GIS-centric asset and work management system. Cityworks enables crews to open ArcMap on a laptop. Over time, we started utilizing iPads as our mobile devices in the field. Today, crews are able to use ArcGIS Field Maps or Cityworks to view maps on their mobile devices.
“With the click of a button or touch of an iPad, CAW staff can get the exact dimensions of valves and hydrants. They can also access original plans and as-builts, as well as information on pressures in the system,” Weindorf said.
We have linked the hydraulic model to the map, which allows crew members to hover over a main and immediately see the pressure level. They can see the material type if known, and repair history. Having easy access to key knowledge allows them to work not only more efficiently but also more accurately.
These tools also help us know when pipes need to be replaced and know where aging pipes are in our system.
“The GIS department has really benefited us, especially with the custom tools,” said distribution assistant director Danny Dunn.
CAW is transitioning from ArcMap to ArcGIS Pro. ArcMap has been robust and useful out of the box, and is adaptable to a utility’s needs. CAW has 24 tools within ArcMap that we built to improve workflows for non-GIS users. The tools make it easy for users to query and get the information they need. Most of the functionality of these tools has been incorporated into ArcGIS Pro as geoprocessing tools or others. As CAW transitions to ArcGIS Pro, we expect to gain extended functionality.
“Our GIS staff is innovative, allowing us to implement additional tools upon request, such as a lead service verification app,” Weindorf said.
Maps and Apps for Fire Hydrant and Valve Inspection
CAW’s GIS department created maps and apps to support our valve inspection program.
We piloted it against a third-party vendor who would do similar work. We concluded that over the course of five years, we could inspect all valves in the system for about $468,000. Alternatively, the third-party would charge more than $1.6 million for the same work over the same time period.
“The GIS technician wasn’t solely responsible for the savings, but they enabled us to successfully perform inspections with in-house staff, which saves CAW more than $1 million every five years by performing our own valve inspection versus using outside contractors,” Weindorf said.
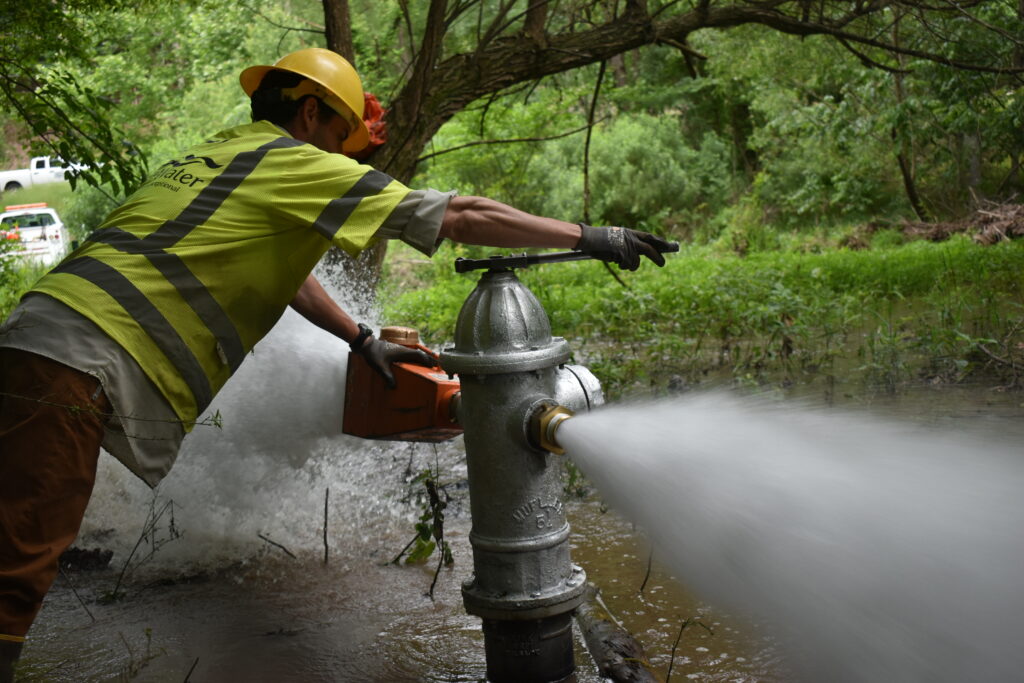
GIS staff also created a fire hydrant inspection layer for our system maps. Before this, our distribution department inspected hydrants when repairing others nearby or responding to a customer complaint.
We symbolized the map layer based on inspection status, allowing field workers to use the map to quickly assess hydrant inspection needs within an area. Every three years, all hydrants automatically revert back to being symbolized as uninspected. Now we know every hydrant has been inspected and is in good shape. Consumers often overlook the fact that fire protection is a huge part of a water utility’s responsibilities, and GIS helps us ensure that the communities we serve are protected.
The map layer also allows us to draw a polygon to select all hydrants in a geographic area to include on a work order for a crew. Previously, every hydrant had to have its own work order. Enabling our crews to do work in the most efficient way empowers them to provide a high level of service and take pride in their work.
All this work shows how CAW has been proactive to the United States Environmental Protection Agency (USEPA) Lead and Copper Rule. By creating these inspection applications and doing the inspections before the rule was in place, CAW is ahead of the deadline.
Web Maps and Predictive Modeling for Lead Service Line Identification and Replacement
The lead service verification app is an ArcGIS Online app that was set up for field crews to enter inspection results. When field crews inspected a service, they noted whether they found it to be a lead service that needed to be replaced. By analyzing GIS data entered over many years, CAW staff could target older parts of our system that had a higher chance of being lead. This allowed CAW to identify and replace all lead services on the public side of our system.
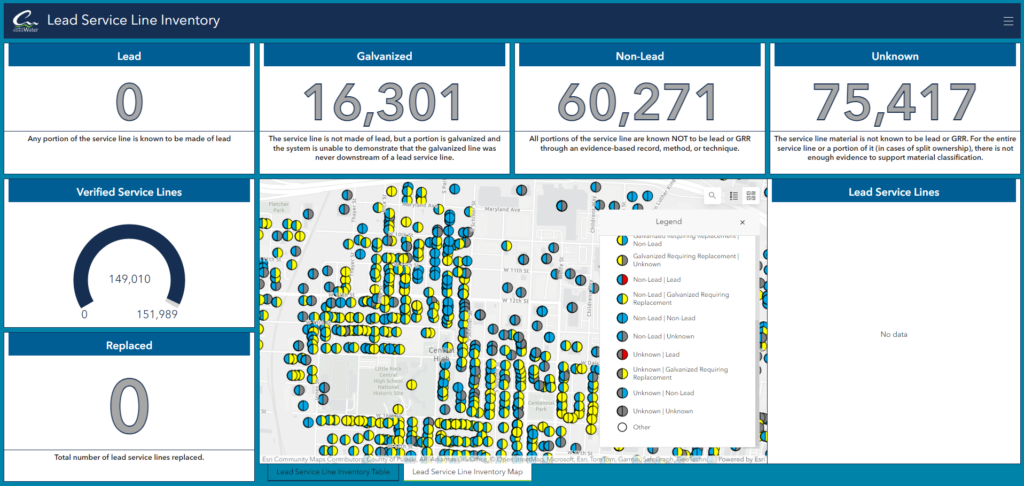
Updates to the EPA’s Lead and Copper Rule now require the classification of service lines to include the customer-owned side of the service line. The skills of the GIS Analyst have become even more important because of this new requirement. Like many other water utilities, CAW has never captured data on the customer-owned side of the service line. By following the guidelines laid out by the EPA, CAW has been able to utilize a wide range of GIS data (parcels, structure types and years, main years, replacement years, material, etc.) to target areas for additional inspections. CAW has decided to do a pilot study area utilizing artificial intelligence (AI) and predictive modeling to make this process more efficient. By partnering with Trinnex and utilizing their leadCAST modeling solution, CAW hopes to save field resources by only targeting those areas that have a more than average to high likelihood of lead being on the customer-owned part of the service.
Supporting CIS and Billing
GIS supports the billing and customer information system (CIS) in several different ways.
GIS is the system of record for locations or addresses that are eligible for utility service. Addresses for new utility connections are vetted using GIS address point layers and the tax parcel ownership layer.
Additional GIS layers may assist in the setting up of a new location in CIS and setting the rates and allowable fees, as various map layers show the sanitary sewer, sanitation, improvement district, debt service district, ZIP code, etc. CAW includes fees for 15 partner agencies in its water customers’ bills.
When a service order generated in CIS requires a response by an on-site representative or crew, the order is automatically routed to Cityworks, where it will be assigned. Cityworks and GIS allow our distribution staff to visualize where their service locations are and obtain information about the assets related to the work they are to perform.
Finally, GIS can be used to visualize and analyze data trends from the CIS. For example, water quality customer complaints or other issues tracked in CIS may be mapped in GIS to discover patterns. The sanitary sewer departments frequently map water consumption data from CIS in GIS so that they perform engineering planning when looking at capacity issues in the collection system.
Managing Construction Projects
Our engineering department employees aren’t excluded from the benefits of a robust GIS program. We have a layer for engineering-managed construction projects. The features are symbolized by project status: under construction, completed, etc. The under-construction drawings are hyperlinked to the features, allowing quick and easy review. After completion, the project as-builts are submitted to GIS for scanning and digitization. These are linked to the related mains via a custom tool created by CAW.
If our dispatch team gets a call in the middle of the night, they can click a hyperlink and view the breakdown of who the contractor is, which CAW employees are assigned to the job, what phase it is in, and any other up-to-date project information such as whether it passed the pressure test or if bacterial samples were taken.
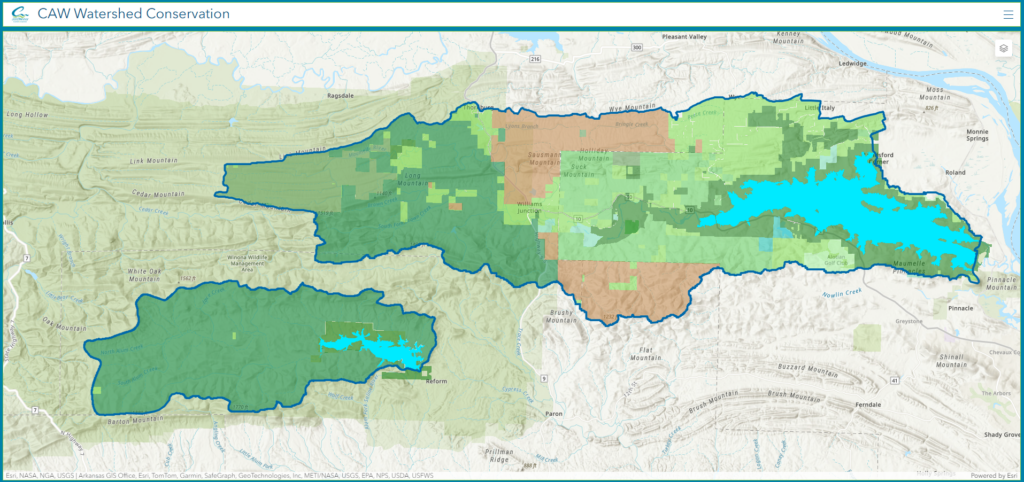
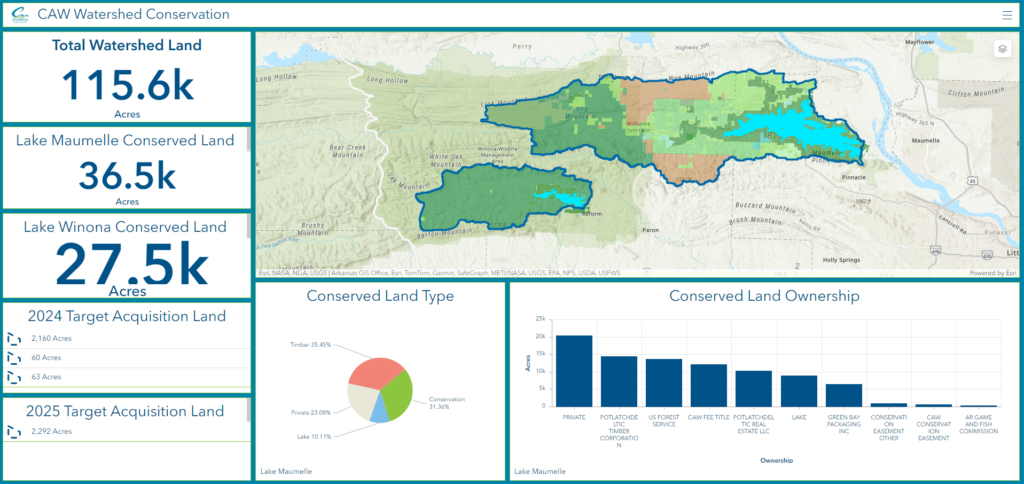
Dashboards Provide Data for Watershed Management
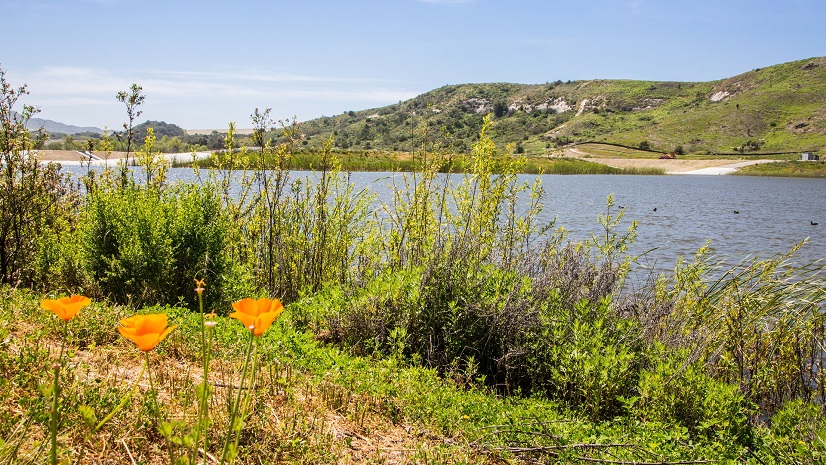
Our GIS team works with our water quality division, which is charged with protecting our watershed by mapping an oil pipeline that runs north of Lake Maumelle, our primary source lake, and mapping the Ouachita National Recreation Trail that ends in our watershed.
We also partnered with the Arkansas Game and Fish Commission to create management and hunting zones, and we have burn zones for when CAW conducts prescribed forest thinning to improve water quality.
Watershed protection manager Raven Lawson said, “Our GIS capabilities allow us to do so much more than simply look at layers and static features on maps. Between our two watersheds (Lake Maumelle and Lake Winona), we are responsible for keeping an eye on over 115,000 acres; that’s a lot to do from the ground.
“We use the GIS information we have to assess the watershed landscape and make major conservation and management decisions. When we are looking to purchase property or preparing for planting forest and prairie landscapes, we look at GIS data to determine development potential and conservation value of properties. We also study historic and nearby species compositions to restore landscapes to more closely match what should be there and increase our potential for successful projects. We can also visualize how and where water will flow across the landscape and determine what along those paths could be potential issues for the water quality in our reservoirs. Having this technology and information is critical to our natural resource management activities,” she said.
GIS Provides a System of Record for Facilities
It’s not only our underground assets and land that have been mapped in GIS. We have even mapped all our facilities and set up relational databases for materials inside.
Our Jack H. Wilson Water Treatment Plant, for example, is mapped so that technicians can click on an area and see every lightbulb and all electronic equipment or parts in that section. Maintenance crews use this to create work orders on our pumps. They can see the type of pump, the brand, and the specific parts.
Integrating GIS and AVL for Improved Fleet Management
CAW uses GIS to enable crews to open our service area map and see where any other crew truck is located. With the use of the PreCise MRM LiGO Automatic Vehicle Locators (AVL) solution, CAW consumes an Esri feature service into its GIS and map documents to be able to view vehicle locations at any given moment without having to switch maps.
Using a GPS tracking solution allows CAW managers to improve productivity, work efficiency, fuel management, and worker safety.
Since CAW uses Cityworks as its work order management system, the Esri feature service can be brought into the Cityworks map to show real-time vehicle location and inventory for distribution dispatch to dispatch vehicles more efficiently. They can click on a truck and see the equipment it is carrying.
If truck #100 needs an 8-inch clamp but doesn’t have it in stock, the crew would have to drive back to our warehouse to get the part. Now, they can see that truck #101 has a spare 8-inch clamp and is only three miles away. They can arrange to get that part from the other truck. This saves time and money for the utility and increases the level of service to our customers since we can repair mains quicker.
Outage Notification and Notify Improve Customer Service
The second phase of our CIS implementation was automatic outage notification to customers. GIS can determine meters affected by planned and unplanned water main shutdowns. Once meters are identified by a water outage in GIS, a query can be sent to the CIS to gather the affected customer information, including the preferred contact method, so that outage information can be automatically delivered to a customer via text, email, or phone message.

CAW deployed Esri’s Water Outage solution to quickly respond to main breaks and other potential service outages. Paired with ESP Logistics Technology’s Notify application and widget, CAW can trace an outage and select meters of the customers that are affected by the outage. The meters are joined to the customer contact information from the CIS and those that have signed up for notifications can be notified by email, SMS, or voice calls.
Staff can identify on the map where a main break has occurred and immediately know every customer affected by the break. In the past, the process was to manually select services and notify customers of the outage information or boil order. The next step is to configure our systems to automatically send a text notification to anyone affected by a main break.
CAW and Pulaski Area Geographic Information System
CAW is a charter member of Pulaski Area Geographic Information System (PAgis), which originally formed as a result of a grassroots effort in 1988. The largest part of CAW’s service area falls within the boundary of Pulaski County in central Arkansas. With the signing of an interlocal government agreement by its four original charter members, PAgis now operates as an independent government agency specializing in the acquisition, maintenance, and distribution of GIS-related data within Pulaski County for its member agencies. PAgis has grown to nine members and is housed in CAW facilities and managed by CAW staff.
PAgis has completed development of a high-quality, centralized enterprise class geodatabase with many layers that are shared and updated each month based on member input. PAgis’ daily focus is on maintenance of framework (basemap) data layers that provide the foundation for each member’s GIS data applications and meeting the needs of local engineering firms planning for development in the region. Their focus on the basemap layers allows members like CAW to focus on their own specific data needs.
More information about PAgis can be found at www.pagis.org.
Planning for the Future
CAW has several upgrades on the horizon. We are planning to upgrade and move our ArcGIS Enterprise environment to the cloud with the help of CyberTech as an implementation partner. This will require several business workflows and processes to be updated to meet the needs of CAW staff. By moving our system from an on-premises system to a cloud-based system, CAW field staff should have access to maps and applications with very little system downtime.
CAW has utilized the geometric network for several years. As we continue to modernize on ArcGIS Pro, we will need the functionality of ArcGIS Utility Network to continue supporting utility workflows. Migration to ArcGIS Utility Network is planned within the next few years.
Because GIS is such an integral part of CAW, it continually must evolve with our business practices and with new technology.
GIS provides a lifeline for the workers in the field to critical information to help them on a daily basis.
Blake Weindorf, Director of Distribution, Central Arkansas Water
Stay Connected with Esri’s Water Team
ArcGIS is an extensive information system that enables modernization of workflows with easy-to-use applications for the field and office. Strengthen your organization with smart water solutions that will increase efficiency and provide insight for decision-makers. Visit the Esri Water Utilities web site for more information.
Follow #EsriWater on social media: X| LinkedIn
Subscribe to the Water Industry newsletter “Esri News for Water Utilities and Water Resources“
Download the digital water report “The Role of GIS in the Digital Water Transformation“
About the author