ArcGIS Dashboards allows you to monitor field operations in real-time. This is especially useful for monitoring projects created in ArcGIS Workforce. Before you can visualize project data in a dashboard, you need to create a joined feature layer view of Workforce layers. This will combine separate layers and tables from the Workforce schema so that the data in your dashboard is clear and informative.
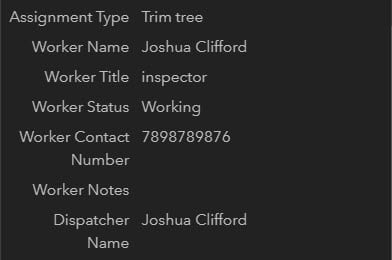
One reason for doing this is to combine the Assignments layer with the Assignment Types table. The Assignments layer on its own will only show the Global ID value of the Assignment type. By joining the layer and table together, the name of the Assignment Type will show up in dashboard components and in the pop-up for each assignment as shown below.

You can create a joined feature layer view using either ArcGIS API for Python or ArcGIS Online. This workflow is not supported in ArcGIS Enterprise and does not apply to Classic projects.
Use ArcGIS API for Python
ArcGIS API for Python allows you to create a joined view layer and a dashboard with one Python script. After you download the Workforce scripts and install ArcGIS API for Python, you’ll be ready to create a dashboard in minutes. Before you proceed, review the requirements for installing ArcGIS API for Python.
Download Workforce scripts
First, clone or download the workforce-scripts GitHub repository. This contains the Python scripts for Workforce as well as the version of ArcGIS API for Python needed to automate Workforce projects. Once it is downloaded, navigate to the “workforce-scripts” folder in either the terminal or the command prompt. A Windows operating system is used for this example.
cd C:\Users\user\Desktop\workforce-scripts\
Install ArcGIS API for Python
To automate and script Workforce projects, you must use ArcGIS API for Python 1.8.3 or later. Version 1.8.3 is included in the workforce-scripts file.
Run the following command in either a Python script or Python console to create the virtual environment with the correct dependencies and to install ArcGIS API for Python 1.8.3:
conda env create --file environment.yml
Next, activate the environment:
conda activate workforce-scripts
Once you’ve created and activated the environment, you are ready to create a joined feature layer view and a dashboard.
Create a joined feature layer view
First, navigate to the scripts folder in either the terminal or command prompt:
cd C:\Users\user\Desktop\workforce-scripts\scripts
Use the create joined view script shown below to combine the assignments, assignment types, workers, and dispatchers into a single layer and generate a dashboard.
python create_joined_view.py -org https://arcgis.com -u username -p password -project-id <project-fs-item-id> -name <output-layer-name> --create-dashboard
You’ll need to modify the following parameters in the script:
- -project-fs-item-id: The item ID of the project’s feature service
- -name: Specify the name of the output layer
Note: The feature service item ID can be found in the URL of the Workforce web app when the project is open: https://workforce.arcgis.com/project/<project-fs-item-id>/dispatch
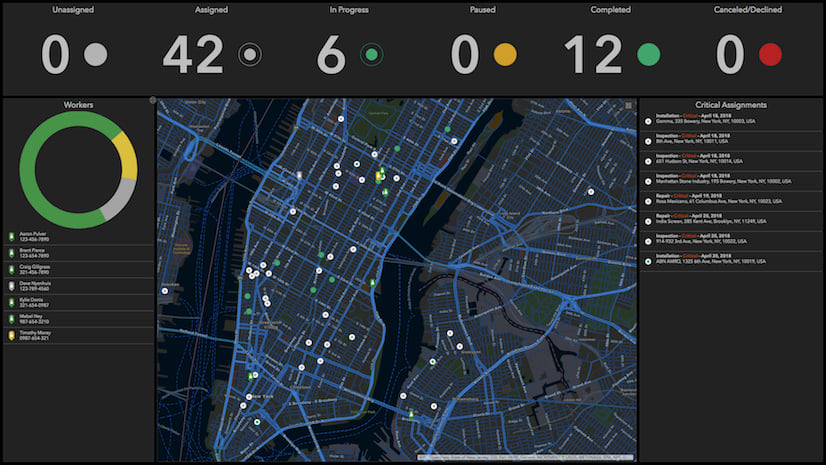
Once you’ve run this script, the new joined view layer, web map, and dashboard are created and added to My content in ArcGIS Online. The default dashboard will look like the image shown below.

If you click on one of the assignments, you’ll see that the pop-up shows the name of the Assignment Type, and not the Global ID. The pop-up also shows the Worker Name and Dispatcher Name. This is because the Workers layer and Dispatchers table are included in the joined view layer.
Customize the dashboard by clicking Edit Dashboard on the dashboard’s item page.
Use ArcGIS Online
You can use the Join Features tool in ArcGIS Online to create a joined view layer from the Assignments Layer and the Assignment Types table. Once you create your layer, you can add it to a map and create a dashboard.
Create joined view layer
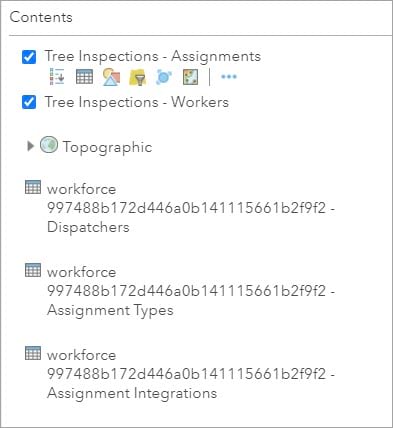
Navigate to the item page of the Workforce feature service and click Open in Map Viewer Classic. A web map opens with the two layers and three tables that make up the feature service.
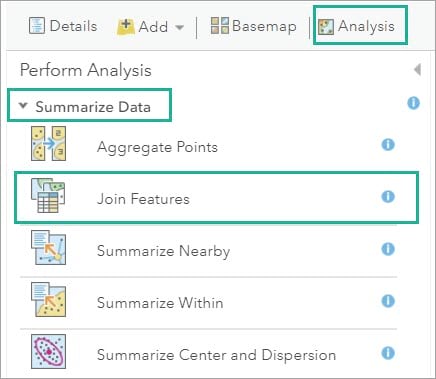
Click Analysis. Click the Summarize data drop-down menu, then click Join Features.
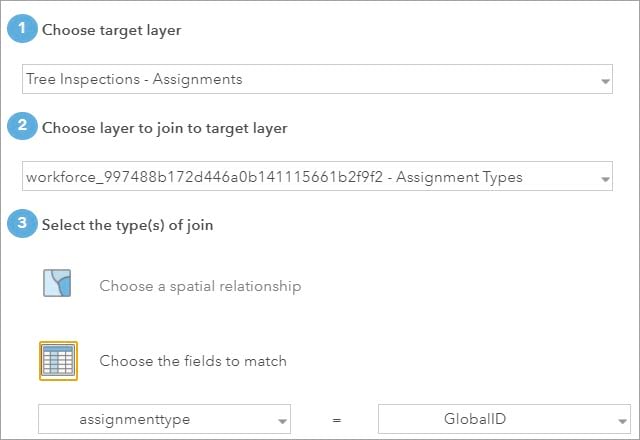
The Join Features tool appears, as shown below. Under Choose target layer, select the Assignments layer. Under Choose layer to join to target layer, select the Assignment Types table. Select Choose the fields to match and set the Target field to assignmenttype and the Join field to GlobalID.
Check Create results as hosted feature layer view. This allows the data to stay up to date as the source data changes. Hosted feature layer views containing joins will be read-only. Click Run Analysis.
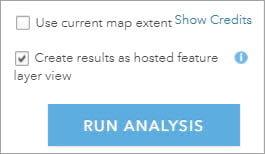
Once you run the analysis, your new joined layer is created and added to the map. Next, you’ll configure the pop-up so the assignment types will appear when you click on an assignment. Click More Options  on the joined layer and click Configure Pop-Up. The configure pop-up pane appears. Under Pop-up Contents, click Configure attributes. The Configure Attributes window appears as shown below.
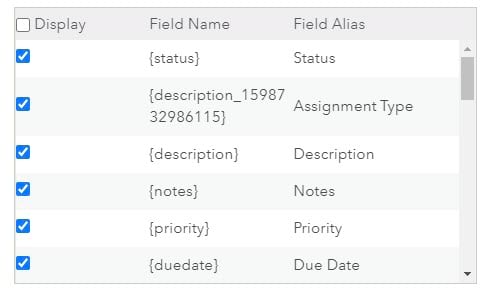
The Assignment Types table stores the name of each assignment type in the Description field. The joined layer stores this information in a field named description with an appended ID. Locate this value and select the check box so it’s displayed in the pop-up. Change its Field Alias to Assignment Type. The field alias is the name that will appear in the pop-up. Configure your pop-up with any additional fields you want displayed, then click OK to save your changes.
Save the feature service and new layer as a new map
First, uncheck the Assignments layer, so only the joined layer and Workers layer are shown on the map. You won’t need the Assignment layer since the same information is part of the joined layer. Click Save, then Save as. Be sure to give the map a meaningful title, some tags, and a summary. Click Save map.
Create a dashboard
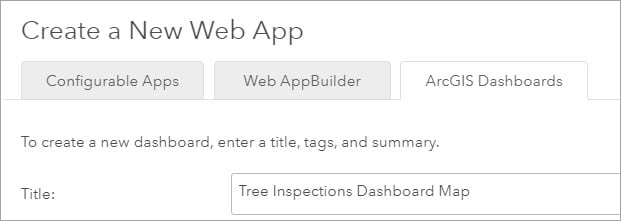
Click Share, then click Create a Web App. Click the ArcGIS Dashboards tab and give your dashboard a meaningful title, some tags, and a summary. Click Done. The new dashboard automatically opens.
Now that you’ve created a joined layer, you can display assignment type names in your dashboard.
Next steps
You are now ready to customize your dashboard to monitor your Workforce project. Be sure to check out Monitor your Workforce Project using ArcGIS Dashboards and ArcGIS Dashboards Resources to create a dashboard that works for your organization.



Article Discussion: