
As an urban planner in San Francisco, you’re interested in developing the Mission Bay area to promote growth and support an increase in population and jobs. To visualize and analyze your planning scenario, you’ll use ArcGIS Urban – a 3D planning tool that allows you to design new scenarios and use dashboards to compare their impact against the current situation, in addition to sharing your vision with others.
Please note that this blog post is out dated. See Getting Started With ArcGIS Urban: creating your first plan for an updated tutorial using the latest version of Urban.
In this tutorial you will:
- Create an Urban Model for Mission Bay
- Add 3D building features and parcel data
- Draw new zoning boundaries
- Assign zoning and building types
- Use dashboards to compare scenarios
You will need:
- ArcGIS Urban license
- An ArcGIS Online account with a Publisher role
Create an Urban Model
You can create an Urban Model through ArcGIS Online on the Content tab.
- Sign in to your ArcGIS Online account and click Content.
-
- If you need an ArcGIS Urban licensed account, you can sign up for a free 60-day trial through Learn ArcGIS.
2. Click Create and select Urban Model.

3. Fill in the following information:
- Title: SF – Mission Bay
- Tags: San Francisco, Mission Bay, Scenario 1
- Summary: This model will explore planning scenarios for the Mission Bay area.
4. Click Ok.
ArcGIS Urban opens. When you create a new model, you have the option to use a template, or start with an empty model.
5. Click New and for Template, choose USA Default. Then click Set up Urban.
The application will take a few minutes to create services. The USA Default template will open onto a blank Scene.

The USA Default template includes basic data for zoning types, building types, overlays, and project statuses that you can use instead of importing your own data.
Add data
Now that your model is created, you will navigate the planning area and add 3D buildings and parcel data.
1. In the search bar, search for and select Mission Bay, San Francisco, California.
The map zooms to the area.
2. Press the X in the search bar to remove the location point.
3. On the top right of the toolbar, click the Manage button.

The Settings tab opens.
4. In the Settings tab, under General, for City Name type San Francisco.
5. Under 3D Base Layers, for Existing Buildings Layer for schematic visualization (SceneLayer), click the Select Item button.
The Portal Item Picker opens.
6. From the dropdown select ArcGIS Online.
7. Search for and select Buildings_MissionBay owner:Learn_ArcGIS. Click Ok.

The layer is under 3D Base Layers. Now you’ll add the Parcel data.
Normally, as an urban planner, you would bulk upload the entire city’s parcel data, but for now you will only include parcel data for Mission Bay. If needed, you could also use the Add Parcel tool to draw individual parcels into the plan. For more information, read through the Preparing your data and Data manager layers documentation.
8. On the toolbar, click Layers and select Parcels. On the Parcels page, click Add.
9. In the Portal Item Picker window, set search to ArcGIS Online. Then search for and select Parcels_MissionBay owner: Learn_ArcGIS. Click Ok. In the From Feature Layer:Parcels window, for Edges, choose – and click Ok.
In the next window, you can match attribute fields to be used in the model. All fields in the Parcels_MissionBay feature layer have been automatically matched.
10. In the From Feature Layer:Parcels window, for Edges, choose – and click Ok to confirm the field match. Then Ok again after the 72 features have been imported.
A blue loading bar will appear at the top of the screen while ArcGIS Urban imports the data. If the bar runs for several minutes you may need to refresh the tab.
11. On the top left of the toolbar, click the Menu button, then select Overview to return to the Scene.

3D buildings are added for the city of San Francisco. You can navigate around the scene by left-clicking to drag, right-clicking to tilt and using the mouse wheel to zoom.

Draw the planning area
The planning area for your scenario defines the extent of the plan. The planning area is also where you will later configure the parcels and zoning types.
1. On the top right of the toolbar, click the Add button and select Zoning Plan.
2. On the new toolbar, click Parcels to include the parcel data in this plan.
3. In the bottom right, click the Tilt View button to switch to a top-down view. Then click the Compass to set North as up.

The new zoning area will be in Mission Bay, San Francisco. It will extend between China Basin Park (North) to 16th Street (South) and between 7th Street (West) and Terry A Francois Blvd (East).
4. Outline the planned zoning area by clicking on the map.

5. Double-click to finish drawing. Then click Add Plan.
6. In the Plan Settings window add the following information:
- Name: Mission Bay Zoning Plan
- Address: Mission Bay – San Francisco, California, USA
- Description: Mission Bay is 303 acre neighborhood on the east side of San Francisco. Originally an industrial district, it is also now home to the University of California – San Francisco campus.
- Start Date: July 8th 2019
- Uncheck End date same as start date.
- End Date: July 12th – 2029

7. Click OK.
Your plan is added to the search panel and to the map view. By default, it includes with the following scenarios:
- 0 – Existing Conditions: The current conditions of the people and places that cannot be modified.
- 1 – Scenario 1: The default scenario that can be edited in the Plan Designer.
No project data has been added so the Existing Scenario is empty.
Add parcels and zone boundaries
Once a plan has been created, it can be edited in the Plan Designer. You can edit the plan by manually drawing features, such as zoning boundaries, but you can also upload features as you previously did with the parcels. You’ll update the parcel features by adding an additional feature, then define the zoning boundaries within your planning area.
1. On the Plan Detail card, click Options then click Edit.

The toolbar changes to show Development mode for the Plan Designer. You now have access to Develop, Allocate, and Space Use modes.
2. On the top left of the toolbar, click the Menu button, then turn off Existing buildings. Click the Menu button again to close it.

You already added Parcel data from the Data Manager, which is now visible in the planning area as black outlines. You can also manually add parcels by tracing them with the Add Parcels tool.
3. On the Workflow toolbar, click Edit Geometry then click Add Parcels.

The drawing interface appears. You can draw new parcels inside the planning area. When tracing new parcels, the final vertex of the parcel should either intersect the first point, or you should double-click to finish drawing. When you are finished drawing the polygon will turn orange and you can click Ok.
4. Trace a new parcel in between Long Bridge St and China Basin St.

5. Click OK. Then click outside the parcel to deselect it.
The new parcel is added to the rest. Next, you’ll add zones.
Zoning boundaries can be uploaded as a feature layer or can be drawn manually in the designer. Since you are experimenting with the new zoning plan, you will manually add it into this model using the Add Zone tool.
6. On the toolbar, click Zoning. The Zoning workflow toolbar appears.
7. On the workflow toolbar, click Edit Geometry then click Add.

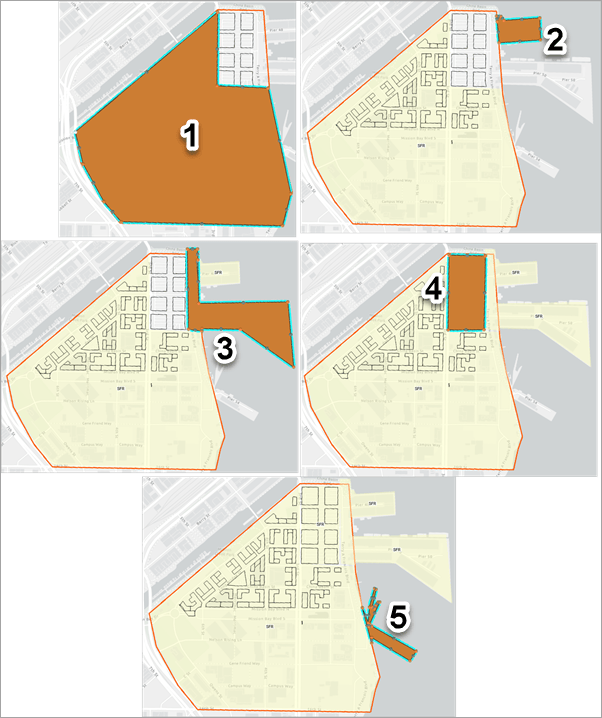
A drawing interface appears. There are five zones in the Mission Bay plan.
8. Draw each of the five zones as pictured below.
Note: After you draw a zone, you need to click Ok, then select the Add tool again.
The Zoning boundary is added to the view and the Single Family Residential (SFR) zoning type is automatically assigned. In the Zoning pane, you can see the total breakdown of zoning types by land area.
Design and apply new zoning types
After adding the zoning boundaries, you can assign zoning types to teach. By default, SFR is applied, but you can use the default zoning types included in the USA Urban template, or add new zoning types. You will add a Mixed-Use zoning type, and then designate each area.
1. Click on Zone 1 to select it.
In the Zoning side panel, information about the select zone can be viewed. The SFR indicates it is Single Family Residential and the RES_SF indicates the space use type also Residential Single-Family.
2. In the Zoning side panel, in the information box, click Modify.
You have the option to select a pre-defined zoning type that was included in the template, or add your own custom type. In this case, you’ll define a new zoning type.
3. Click the + Add button. In the New Zoning Type window, fill out the following information:
- Label: MB-00
- Description: Mission Bay Mixed Use
- Color: #e69d3a
- Maximum Coverage: 1
- Maximum FAR: 10.5

4. Under Tiers & Setbacks, click Add Tier.
5. For the Tier 2, you’ll configure additional parameters:
- Start height: 65 ft
- Side interior setback: 10 ft
- Side street setback: 10ft

7. Click Ok.
The new Mission Bay Mixed Use zoning type is now available in the Zoning Types side panel. You can apply zoning types by selecting the zoning boundary in the map, and then selecting the assigned type from the Zoning Types side panel.
8. Assign the zoning types to each zoning boundary as follows:
- Zone 1: Mission Bay Mixed-Use
- Zone 2: General Commercial
- Zone 3: Open Space
- Zone 4: Downtown Core
- Zone 5: Open Space

Design and apply building types
After zoning types are applied, you can apply building types to each parcel. A building type will allow you to visualize what a typical structure for the specific type might look like – such as commercial, residential, or offices. Certain building types are only allowed in their appropriate zoning areas. The USA Urban template that you selected includes several different kinds of building types to use, but you can also create your own.
1. On the toolbar, click Development. Then click the Allocate tab.

2. If necessary, zoom in to view the parcels layer.
3. Select a parcel in the Downtown Core (Purple area, #4) zone.
4. In the Allocate tab, under Building Types Mix, choose Industrial Tech + Flex. Then type 100%. Click Assign.
5. Select the rest of the parcels and assign them a building type appropriate for the zone.
Tip:

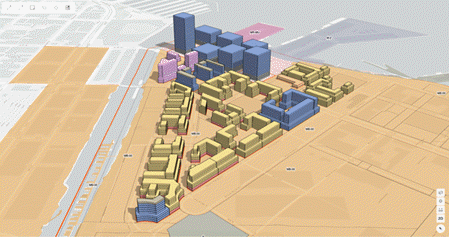
Note: Your visualization may look different from the image depending on which building types you assigned.
Assess capacity impact
The Urban Dashboard allows you to compare capacity indicators, such as Population, Households, and Jobs, from the Exisiting Scenario and the proposed scenario – Scenario 1. The indicators are calculated based on the Space Use types assigned to each parcel building. For example, residential building types increase the capacity for households and retail building types increase job capacity.
The city of San Francisco has defined specific population, household and job targets for the Mission Bay development plan. You’ll input these numbers into the dashboard for comparison.
1. Click on the Space Use tab.
Based on which building types you chose, the Space Use Types breakdown will display the total floor area and breakdown. Then, based on the space types parameters, the Capacity indicators will update.
2. On the toolbar, click Capacity.

Note: Your indicators will differ.
The Capacity indicators are a quick way to assess the impact of your development – how many jobs could be generated and how much energy use should be anticipated and from which sectors.
3. Expand the different indicators to see their breakdown.

In order to reach the city’s targets for population, households, and jobs, you can create new planning scenarios, or adjust Scenario 1’s assigned building types and zones. Your planning scenario is currently private, but when you reach a satisfactory plan you can share it with stakeholders.
In this tutorial, you’ve created a new development plan for Mission Bay by adding 3D building features and parcels then creating zoning areas within Mission Bay. You created custom zoning and building types, then assigned them to your features. Finally, you analyzed the impact of your decisions on population, households, and jobs by using the Urban Dashboard.
Learn more about ArcGIS Urban by visiting the product page and exploring more content in the Learn ArcGIS gallery.


Article Discussion: