Note: This blog article covers the classic Esri Story Maps which are in mature support and scheduled to be retired in late 2025. Story authors are strongly encouraged to use the new ArcGIS StoryMaps to create stories.
For more information about transitioning to the new StoryMaps, see ArcGIS StoryMaps resources. For more information about the transition from classic Esri Story Maps to the new ArcGIS StoryMaps, see Esri Story Maps: Now in mature support.

Story Map Tour is a popular Story Map, ideal for presenting a set of photos or other media along with captions, linked to an interactive map. It has been used to author interesting tours such as Places to Go in San Diego, Explore the Adirondacks, and many others you can find at the Story Map Tour Gallery.
Map Tours can use photos or media that are hosted on photo sharing sites like Flickr, Google Photos, YouTube or other web locations. While these are typically static, you can create a more dynamic Map Tour if the media are updated and overwritten at their hosted location, or if the URL points to streaming video.
*
Example: Queensland Traffic Cams
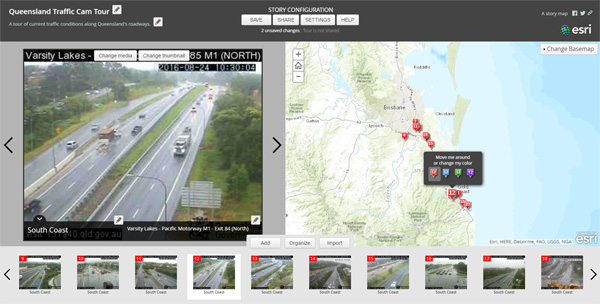
Traffic web cams make for interesting real time Story Map Tours. Many “live” cams are implemented by grabbing a snapshot from the traffic cam and overwriting the existing URL location for each camera snapshot at regular intervals, usually every few minutes. Other traffic cams include live streaming video.
For this example, a spreadsheet was created containing the lat/long of traffic camera locations from the Queensland, Australia, Department of Transport and Main Roads.
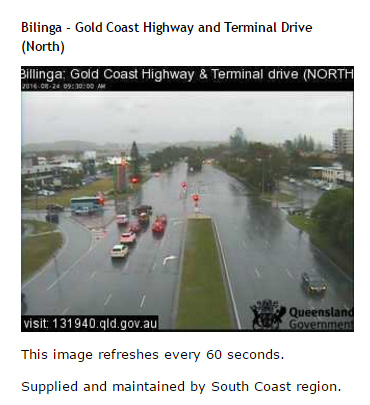
Fields were added to provide the information needed for the Map Tour. including URLs to photos captured from the traffic cams. See Create a Story Map Tour using a spreadsheet for more information.
The edited spreadsheet contains the following fields:
- Lat/Long – location of traffic camera
- Name – used in the photo title in the map tour
- Description – shown alongside the name in the larger map tour photo
- URL – web location of larger size photo
- Thumb_URL – web location of thumbnail photo
- Color – used by the map tour to define the marker color
- Website – not needed for the map tour, but used in our web map pop-up
The Queensland traffic cam photos are available in only one size – a little larger than ideal for the thumbnails, and a bit smaller than ideal for the larger photo, but close enough that we could use the same photo as-is for both the thumbnail and featured photo in the tour. A key ingredient to our real time tour is that each traffic cam snapshot is overwritten in place at its URL location every 60 seconds.
View and download the spreadsheet
*
Build the Map Tour
Two workflows can be used to build the live traffic Map Tour; you can start with a web map, or start with the Map Tour builder. In general, it’s recommended that you start at the Story Maps website, and launch the Map Tour builder from there.
Start with a map
Follow these steps to author a map tour using the downloaded spreadsheet and authoring a new web map.
Step 1 – Download the spreadsheet from the link above, and drag and drop the spreadsheet onto a new web map. Configure the web map as desired.
Step 2 – Save your map, and click Share. Then click Create A Web App.

Step 3 – Choose Build a Story Map, then locate and click Story Map Tour.
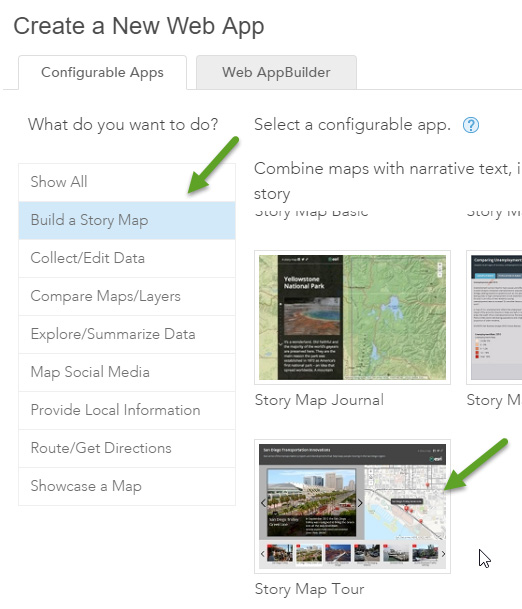
Step 4 – Click Create Web App
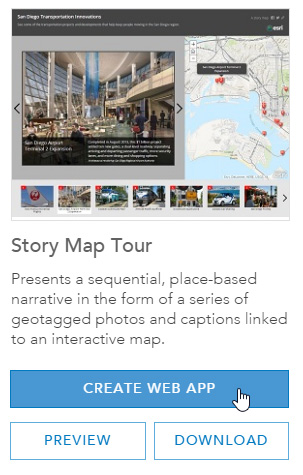
Then enter a title, tags, and summary.
Step 5 – Complete the Map Tour using the builder. Since the spreadsheet contains most of the information needed by the builder, only a few changes will be needed to finalize your tour. Add a title, subtitle, and change Settings as desired, then Save and Share.
Start with the Map Tour builder
Step 1 – Launch the Map Tour builder from the Story Maps website. There are several ways to launch the builder, one way is to click the Apps tab, locate Story Map Tour, and click Build.
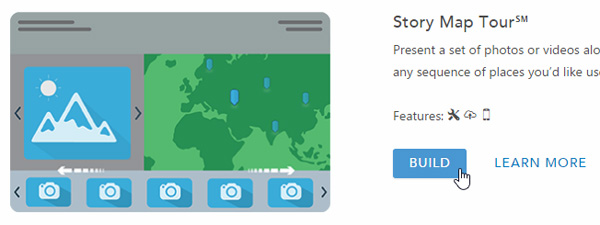
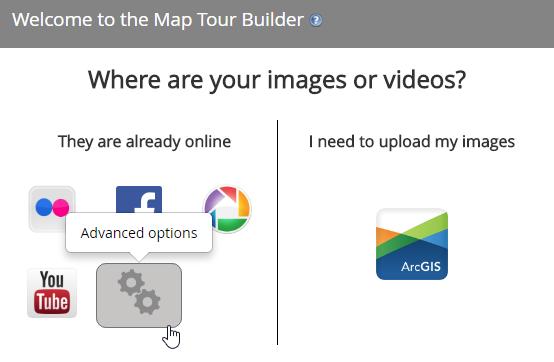
Step 2 – Click Advanced Options (the gears).
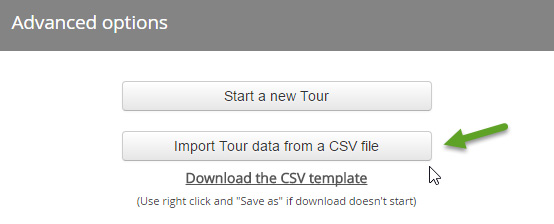
Step 3 – Click Import Tour data from a CSV file.
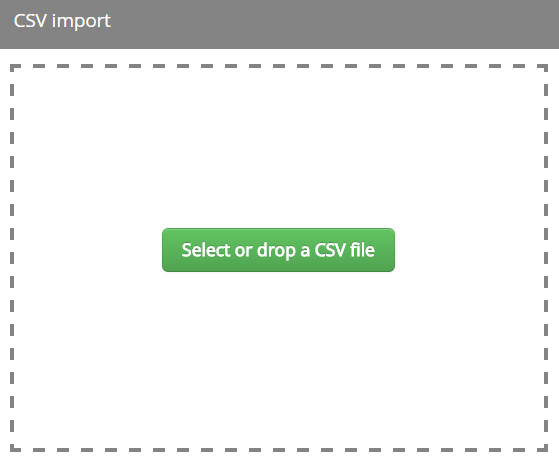
Step 4 – Select, or drag and drop the downloaded spreadsheet.
Step 5 – Complete the Map Tour using the builder. This is the same as Step 5 above. When finished, save and share your story map.
*
More examples
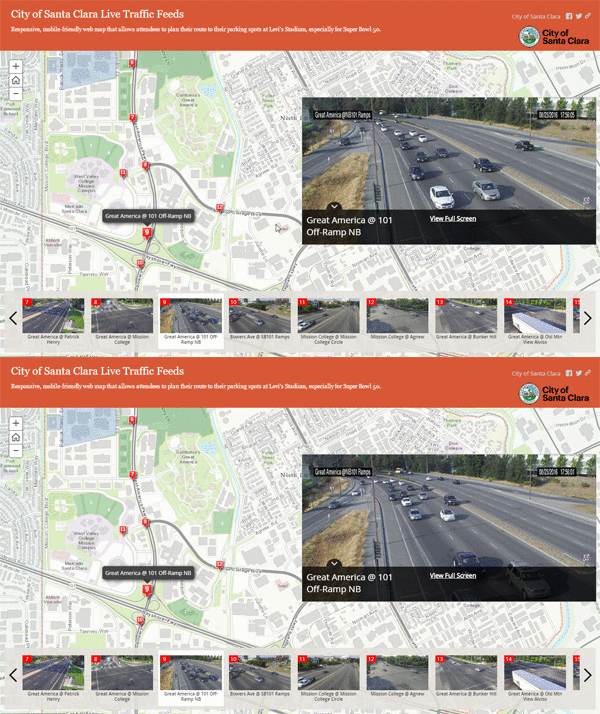
This example from the City of Santa Clara features streaming cam shots from traffic cam locations throughout the city.
Your can view the Map Tour or download the CSV containing the cam locations and build your own streaming web cam tour using the steps above.
*
For more information
This post was originally published on September 24, 2013, and has been updated.

Commenting is not enabled for this article.