2024 has been a busy year! Join us as we go over highlights of the new and improved capabilities for raster analysis introduced over the course this year!
What’s new in Spatial Analyst in 2024?
The ArcGIS Spatial Analyst extension provides a broad range of powerful spatial modeling and raster analysis capabilities. Common applications include distance analysis, suitability modeling, terrain analysis, surface analysis, surface interpolation, and hydrological analysis. Create, query, map, and analyze raster data, and perform integrated raster/vector analysis.
Listed here are some of the major improvements and innovations in Spatial Analyst functionalities across the ArcGIS suite of software this year:
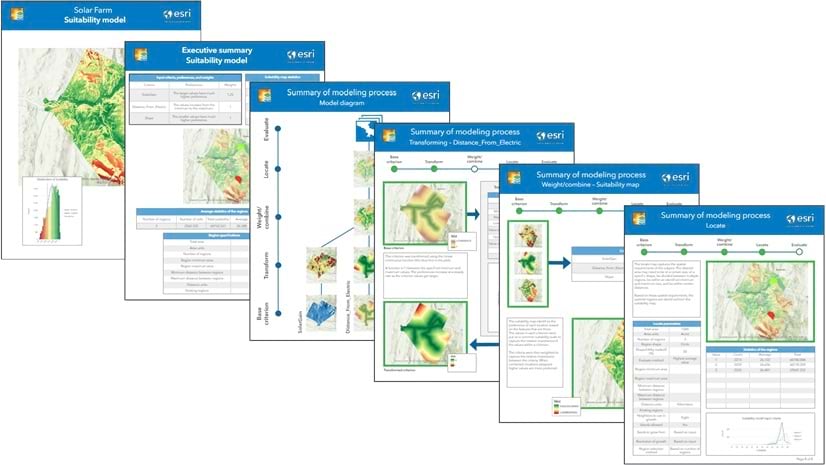
- Suitability Modeler: Generates a report to represent the key decisions.
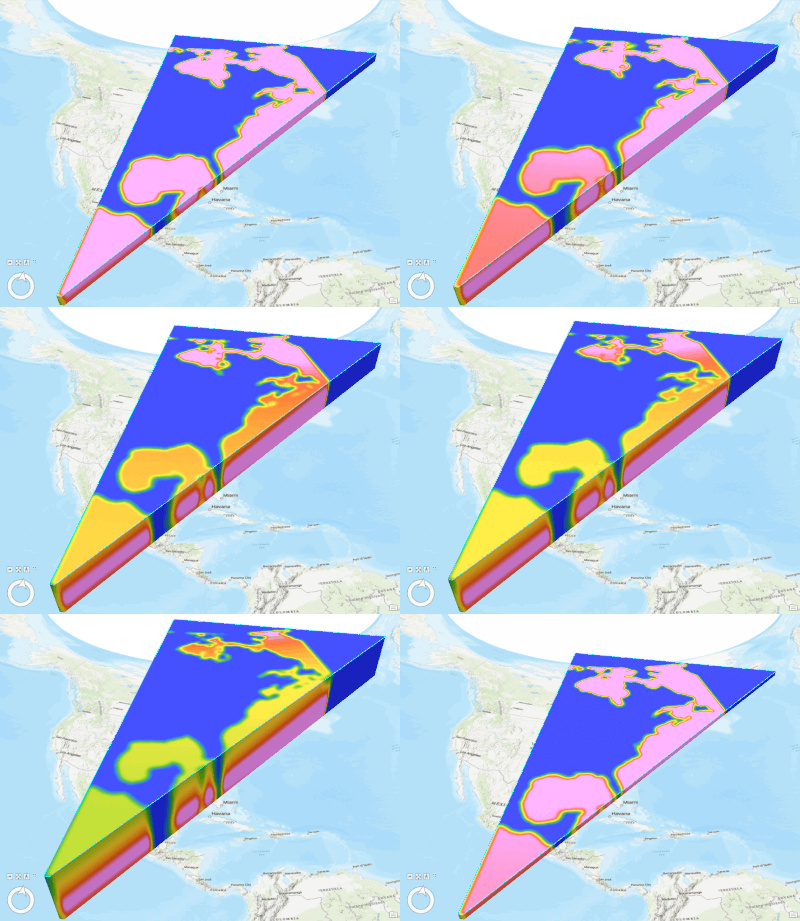
- Density analysis: The Space Time Kernel Density tool creates voxel layer output.
- Distance analysis: Supports hiking function and calculations around the globe.
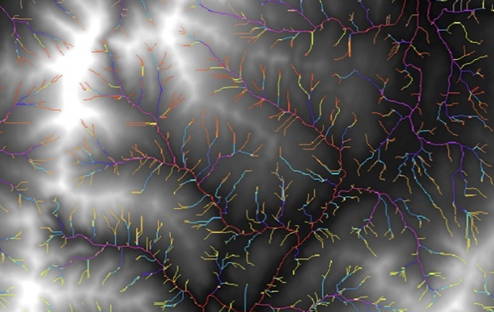
- Hydrology analysis: New Map Viewer tools and performance improvements.
- Solar analysis: New parameter to control the speed and accuracy of the computations.
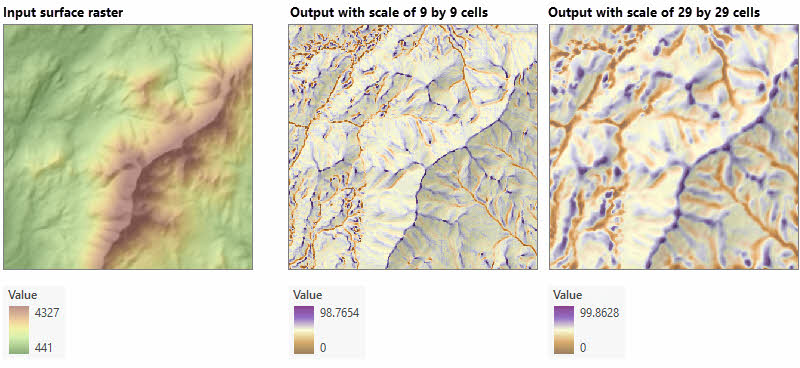
- Surface analysis: New Feature Preserving Smoothing, Multiscale Surface Difference, and Multiscale Surface Percentile tools.
- Zonal analysis: New Zonal Characterization tool.
Ready? Let’s dive in
Suitability Modeling
You can now Generate a suitability model report as a PDF that presents the key decisions made when creating a model in the Suitability Modeler in ArcGIS Pro. You can share the report with stakeholders and decision makers or use it to better understand the model. This report includes a flow diagram of the model, details on the transformations applied, the weights, a final map that shows the most suitable areas, and optionally a summary of the located regions.

An additional enhancement is the ability to define locations to exclude from the analysis. The appearance of the maps, legends, and plots was enhanced. Accessibility was improved by providing an option supporting viewers with the primary forms of color vision deficiency (CVD).
Return to main menu
Density analysis
The Space Time Kernel Density tool in ArcGIS Pro can create an output voxel layer that represents the density of the input points as magnitude per-unit-area across multidimensional space and time.
What does this mean? You can now easily explore the results as a 3D volumetric visualization!

Return to main menu
Distance analysis
There are two new vertical factor options for the Distance Accumulation and Distance Allocation tools (and raster functions). Use the Hiking Time option to account for the adjustment in walking speed when the steepness of the ground changes. Use Bidirectional Hiking Time to find the average time to hike in one direction on an out-and-back hiking trail. This functionality is available in ArcGIS Pro, as REST APIs in ArcGIS Enterprise and ArcGIS Enterprise on Kubernetes, and Map Viewer in ArcGIS Online.
Do you ever perform distance analysis for a global extent? Several distance tools and raster functions can now calculate least cost paths around the entire world. The Distance Accumulation, Distance Allocation, Optimal Path as Line, and Optimal Path as Raster tools no longer treat the edge of the map as a barrier. The conditions required to enable this capability is using the geodesic distance method and having the data in either a GCS or a cylindrical projection. This functionality is available in ArcGIS Pro, as REST APIs in ArcGIS Enterprise and ArcGIS Enterprise on Kubernetes, and Map Viewer in ArcGIS Online.
Return to main menu
Hydrology analysis
If you study water, ArcGIS Pro has some significant performance improvements for the following tools: Basin, Flow Length, Snap Pour Point, and Stream Order tools.
If you are a Map Viewer user in ArcGIS Enterprise, ArcGIS Enterprise on Kubernetes, or in ArcGIS Online, you can now complete your hydrological workflow with the availability of all Spatial Analyst Hydrology tools. Three tools newly available are: Derive Stream as Line, Derive Stream as Raster, and Stream Link.

Return to main menu
Solar analysis
The Sun Map Grid Level parameter was added to the Feature Solar Radiation and Raster Solar Radiation tools in ArcGIS Pro to control the speed and accuracy of the computations. These tools also received enhancements in their support for GPU processing that improved performance and scalability.
Return to main menu
Surface analysis
Three new tools are added in ArcGIS Pro for surface analysis.
Use the Feature Preserving Smoothing tool to smooth out a surface raster by removing small scale surface variation (noise), while preserving the meaningful landscape features.
The other two tools, Multiscale Surface Difference and Multiscale Surface Percentile, identify specific landscape characteristics of a surface raster at multiple scales.

Additionally, two Map Viewer surface analysis tools, Geodesic Viewshed and Surface Parameters, are enhanced with new parameters in ArcGIS Enterprise, ArcGIS Enterprise on Kubernetes, and ArcGIS Online.
Return to main menu
Zonal analysis
We know you love Zonal Statistics as Table tool and often use it iteratively to summarize the values for multiple input rasters for the same zone input. With the new Zonal Characterization tool in ArcGIS Pro, you can now do this in one shot!

Zonal Statistics and Zonal Statistics as Table functionalities have new majority and minority related statistics options across all ArcGIS suites of software.
Return to main menu
But wait, there’s more!
Additional Spatial Analyst updates include the following:
- Raster functions and raster function templates in the Map Viewer can be created or modified to create a custom visualization or analyze raster layers. You can save a list of raster function templates that you have worked on within the web map. You can use them again or share with others.
- New tools in the Map Viewer in ArcGIS Enterprise, ArcGIS Enterprise on Kubernetes, and ArcGIS Online: Locate Regions, Nibble
- New raster function in the Map Viewer in ArcGIS Enterprise, ArcGIS Enterprise on Kubernetes, and ArcGIS Online: Aggregate Multidimensional raster
- New tools in the REST APIs: GeodesicViewshed, TabulateArea, ZonalGeometryAsTable, ZonalStatistics.
We have a collection of new analytical blogs with solutions and applications:
- Multi-objective modeling with sub models using the Suitability Modeler by Kevin Johnston
- How to fill NoData holes in rasters by Juan Laguna
- Doing more with Density tools: Understanding spatial patterns of data in ArcGIS Pro by Rakibul Ahasan
For more information by release, check out the blogs and what’s new documentation pages below to try out the latest features:
- What’s new for Spatial Analyst in ArcGIS Pro 3.4
- What’s new for Spatial Analyst in ArcGIS Pro 3.3
- What’s new in ArcGIS Image Server in 11.4
- What’s new in ArcGIS Image Server in 11.3
- What’s new in analysis in ArcGIS Enterprise on Kubernetes in 11.4
- What’s new in analysis in ArcGIS Enterprise on Kubernetes in 11.3
- What’s new in imagery in ArcGIS Online (November 2024)
- What’s new in imagery in ArcGIS Online (June 2024)
- What’s new in ArcGIS Image for ArcGIS Online (February 2024)
Wrapping it up
Wishing you all a wonderful holiday season!
Write to us on the Spatial Analyst Forum with your ideas, suggestions, and questions—We’d love to hear from you.
Bring on 2025!


Article Discussion: