This blog introduces a common challenge facing rock climbers and gives an example of how the Native Maps SDKs were used to develop a tool to help.
Introduction
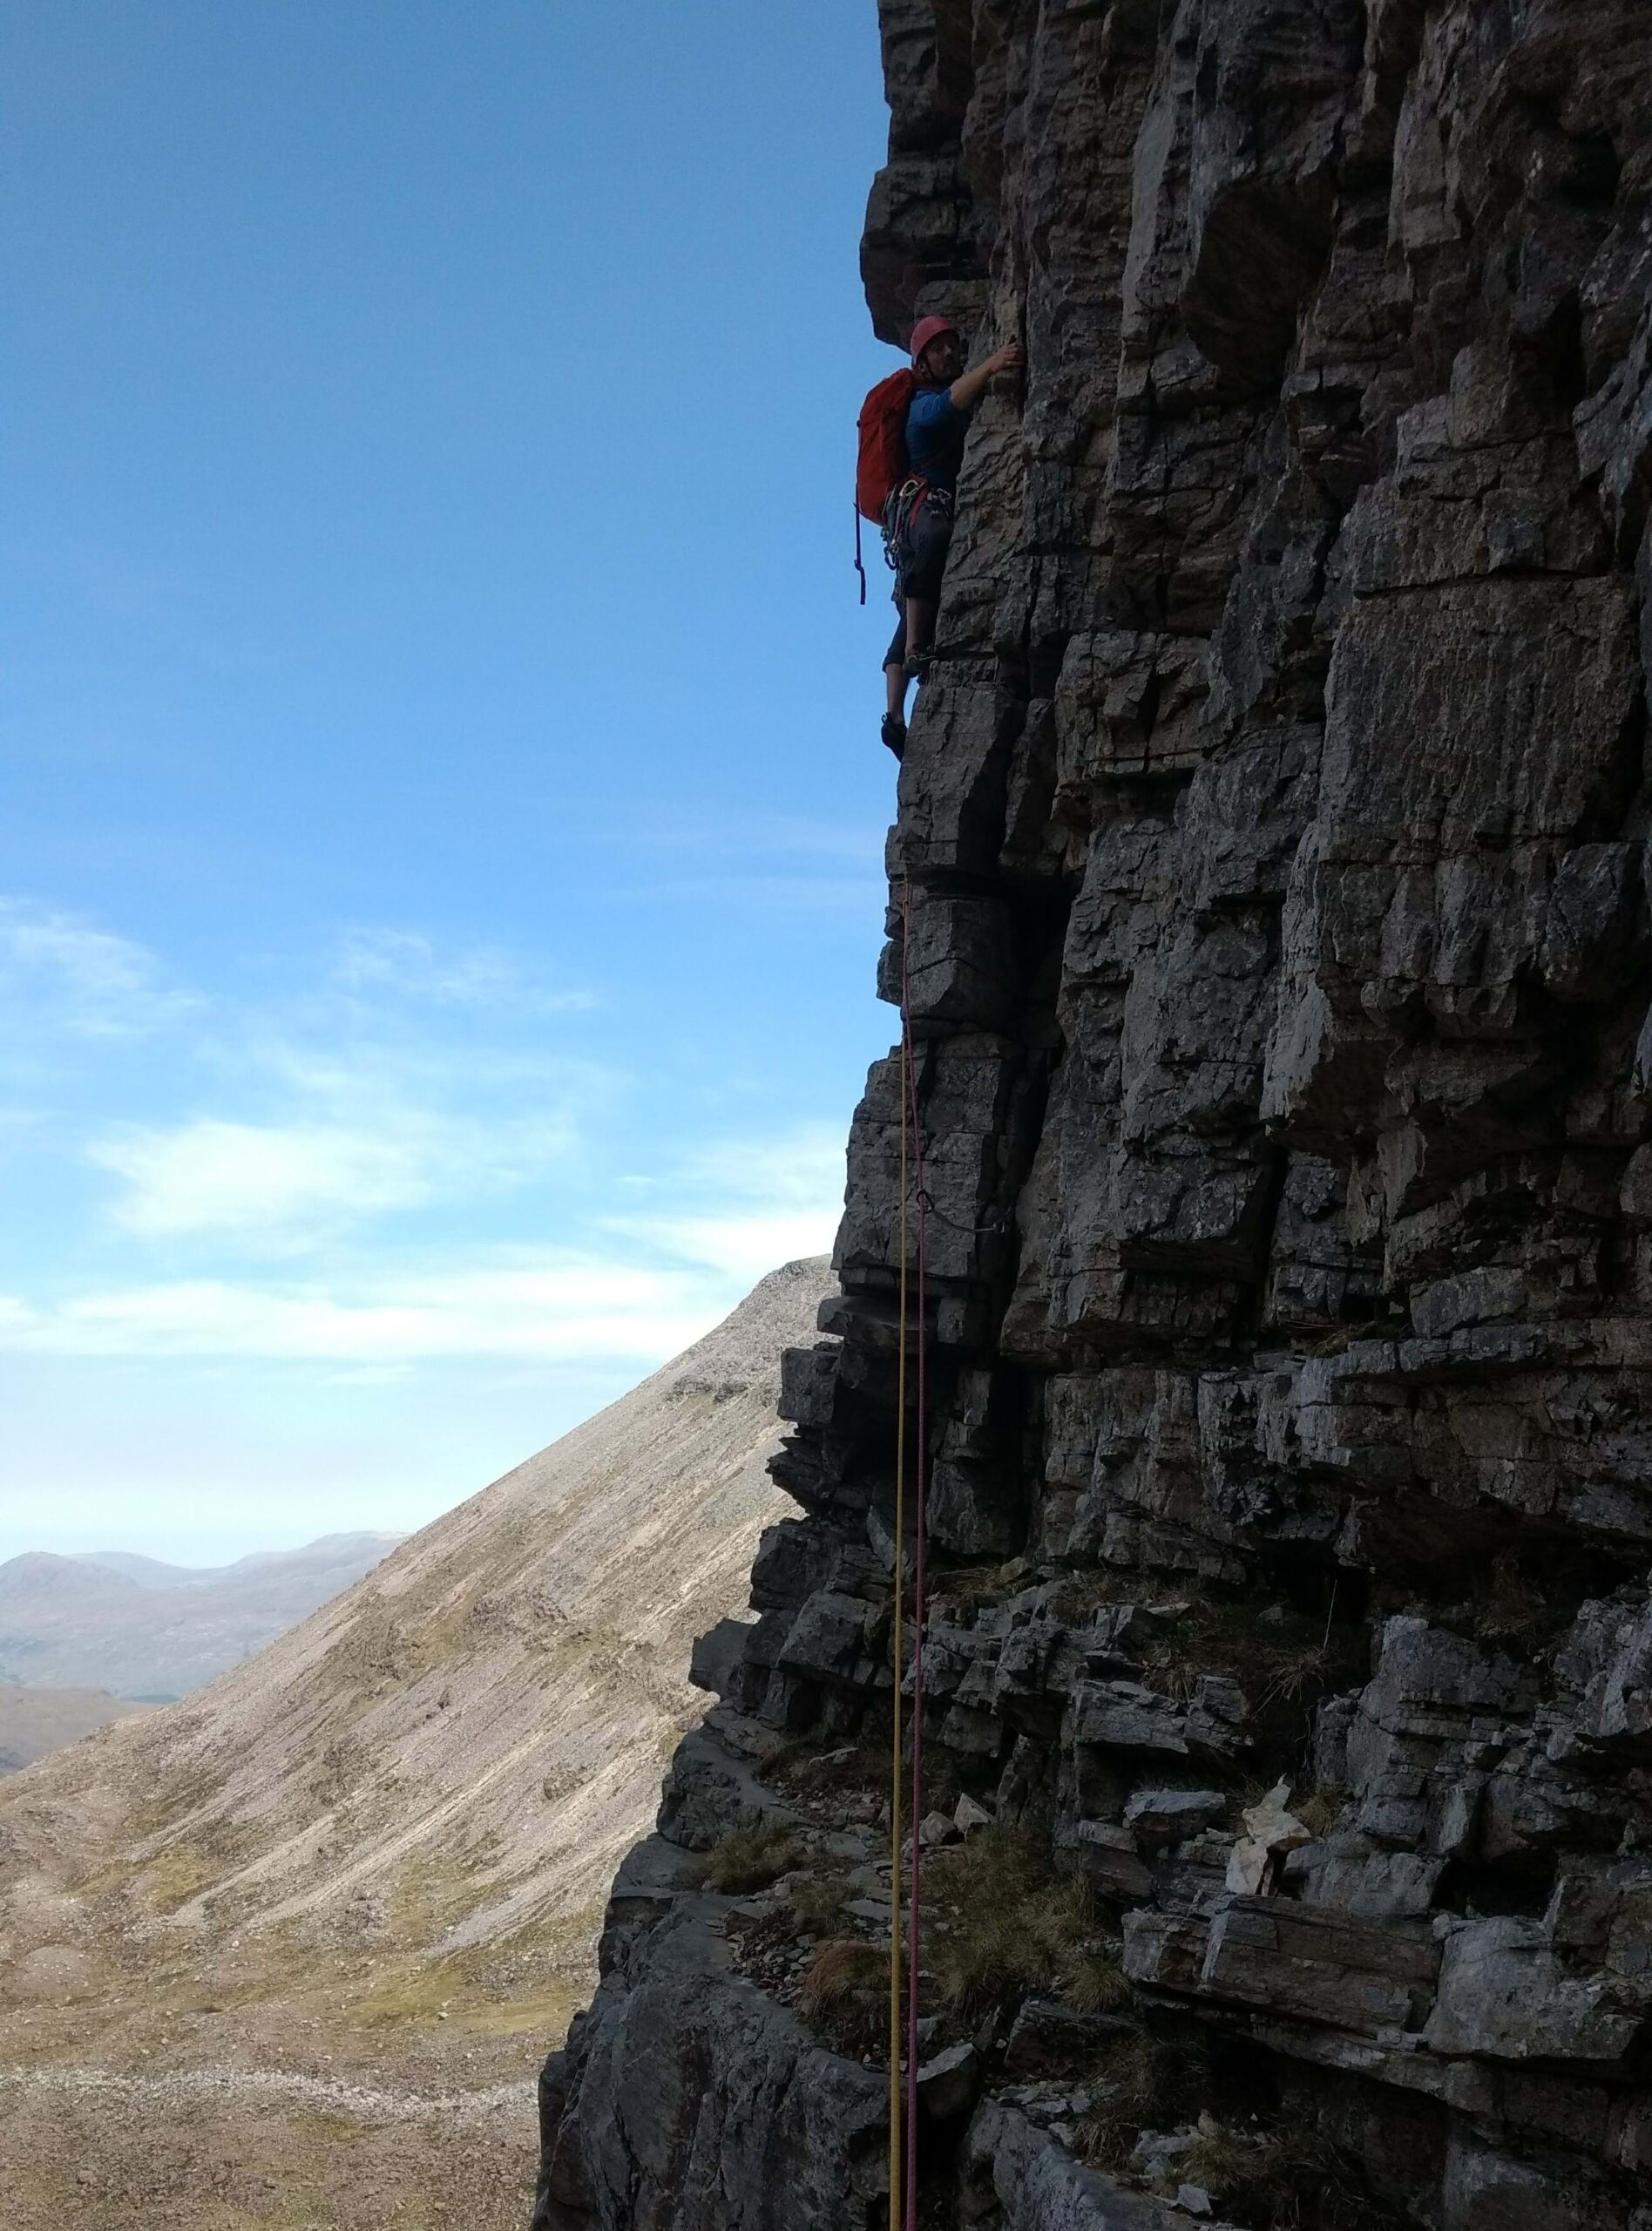
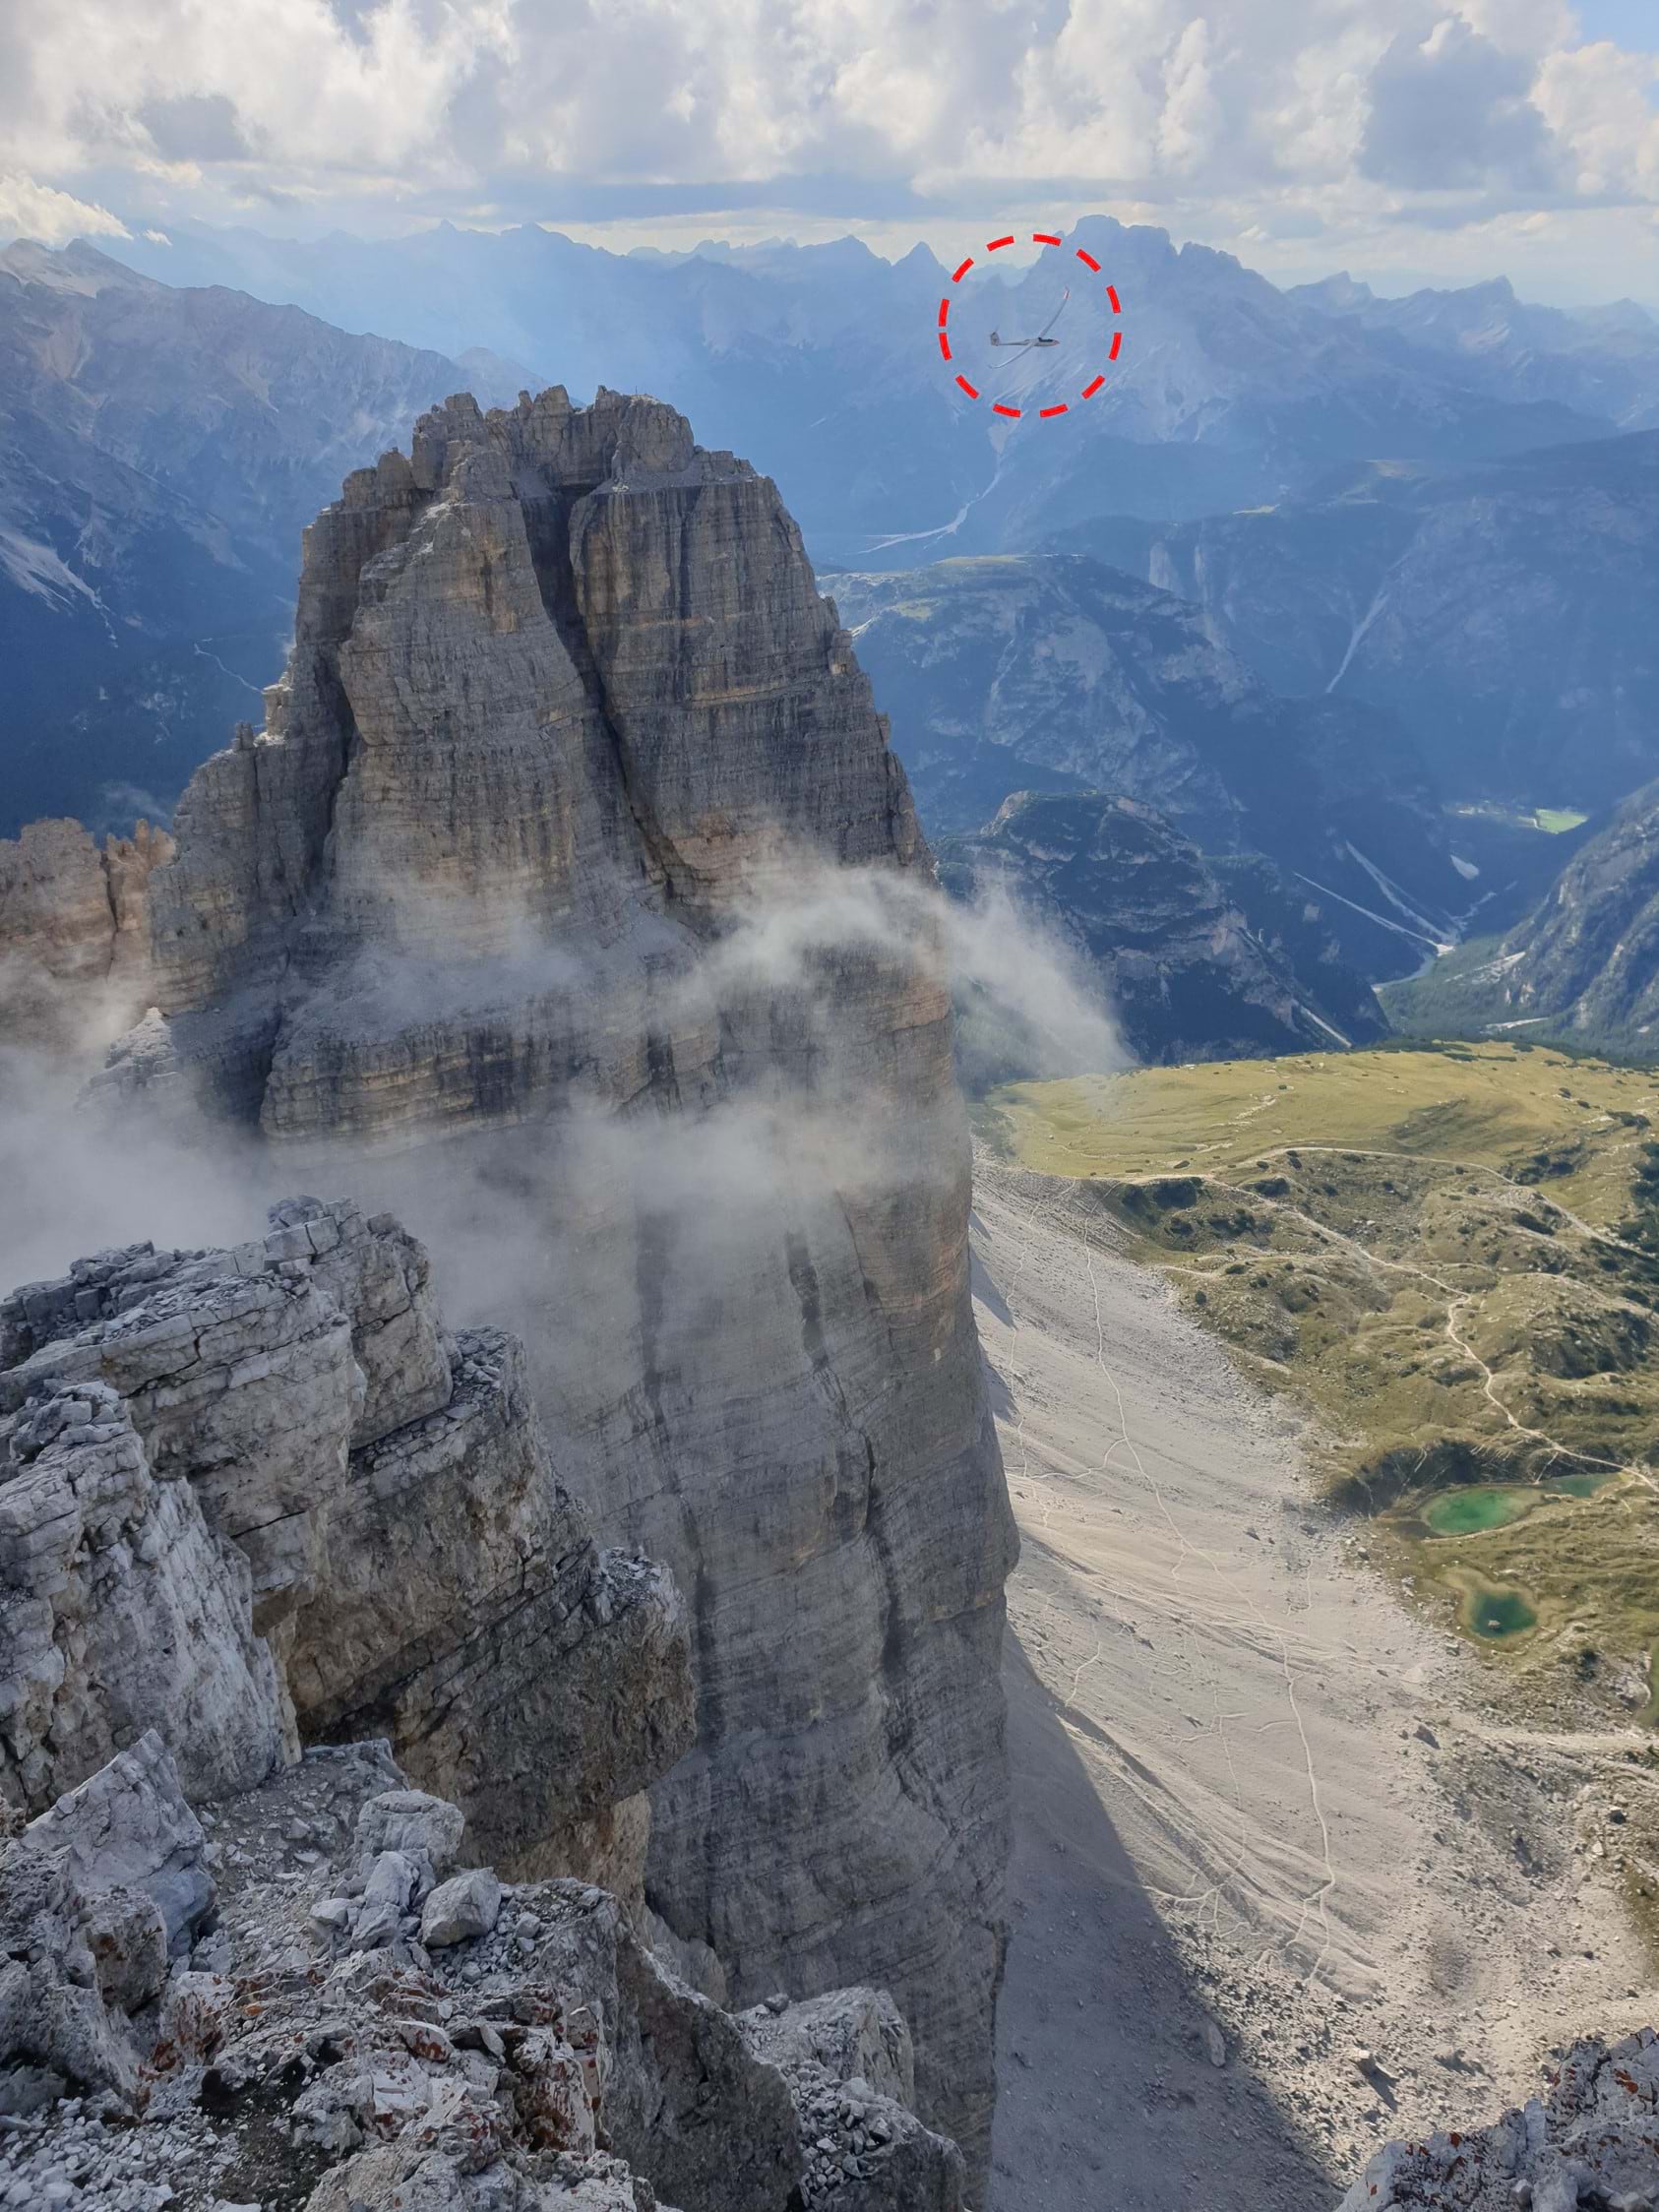
One of the greatest challenges to having a successful day climbing in the mountains (Figure 1) is assessing the weather, which varies over short distances and time frames, especially in Scotland where I live. To find the mountain with the best weather, and therefore the best chance of a successful day’s climbing, I spend hours reviewing the forecast from multiple sources. This is inefficient and error-prone.
To make this process more efficient and reliable, I’ve created an Android application using the ArcGIS Maps SDK for Native Apps, which requests weather forecast data from a RESTful API and stores this in a custom data structure. The ArcGIS Maps SDK for Qt allowed me to create both desktop and mobile applications, which meant I could use the application on my laptop at home and on my phone while on climbing trips. I also used the Qt SDK as it’s the development framework I’m most familiar with. However, the same workflow and principles apply for the other Native Maps SDKs (Java, .NET, Swift and Kotlin). The application makes accessing forecast data quick and automates some of the review process.
In this blog I’ll:
- Introduce the challenge of assessing mountain weather.
- Provide a summary of my current weather review process.
- Provide a high-level overview of the Conditions Navigator application.
- Describe how the application helped on a recent two-week long mountaineering trip.
The source code for the application which I’ll discuss is available on AndrewBladon’s QtWeatherApp GitHub repository.
The Challenge
Most people fit climbing around jobs and other commitments. Often, this means climbing within a given time frame, such as the weekend. When restricted to a given day or days, the challenge becomes finding the mountain and climb where the weather conditions are suitable. However, the relationship between the weather and the condition of climbing routes is complex. Here’s a couple of the relationships that are considered:
- Different rock types dry at different rates, making it important to monitor rainfall on a given mountain.
- Identifying the direction of the wind relative to the orientation of the cliff helps assess how windy it will be on a climb.
To assess these relationships requires an understanding of the spatial and temporal variations of several parameters (e.g. rainfall, wind speed, wind direction, and visibility) across a region as well as knowledge of the climbs (e.g. rock type, cliff orientation, and length of climb). Modern forecast sources (e.g. Met Office, Mountain Weather Information Service) present forecast data in multiple useful formats (e.g. tables and time-series maps). However, it’s challenging to gain the required understanding of multiple parameters across a region. This challenge is especially prevalent in Scotland, where I live, because the mountains are low (<1345m) and exposed to Atlantic weather systems. This results in unstable weather that varies rapidly over short distances.
Current Weather Review Process
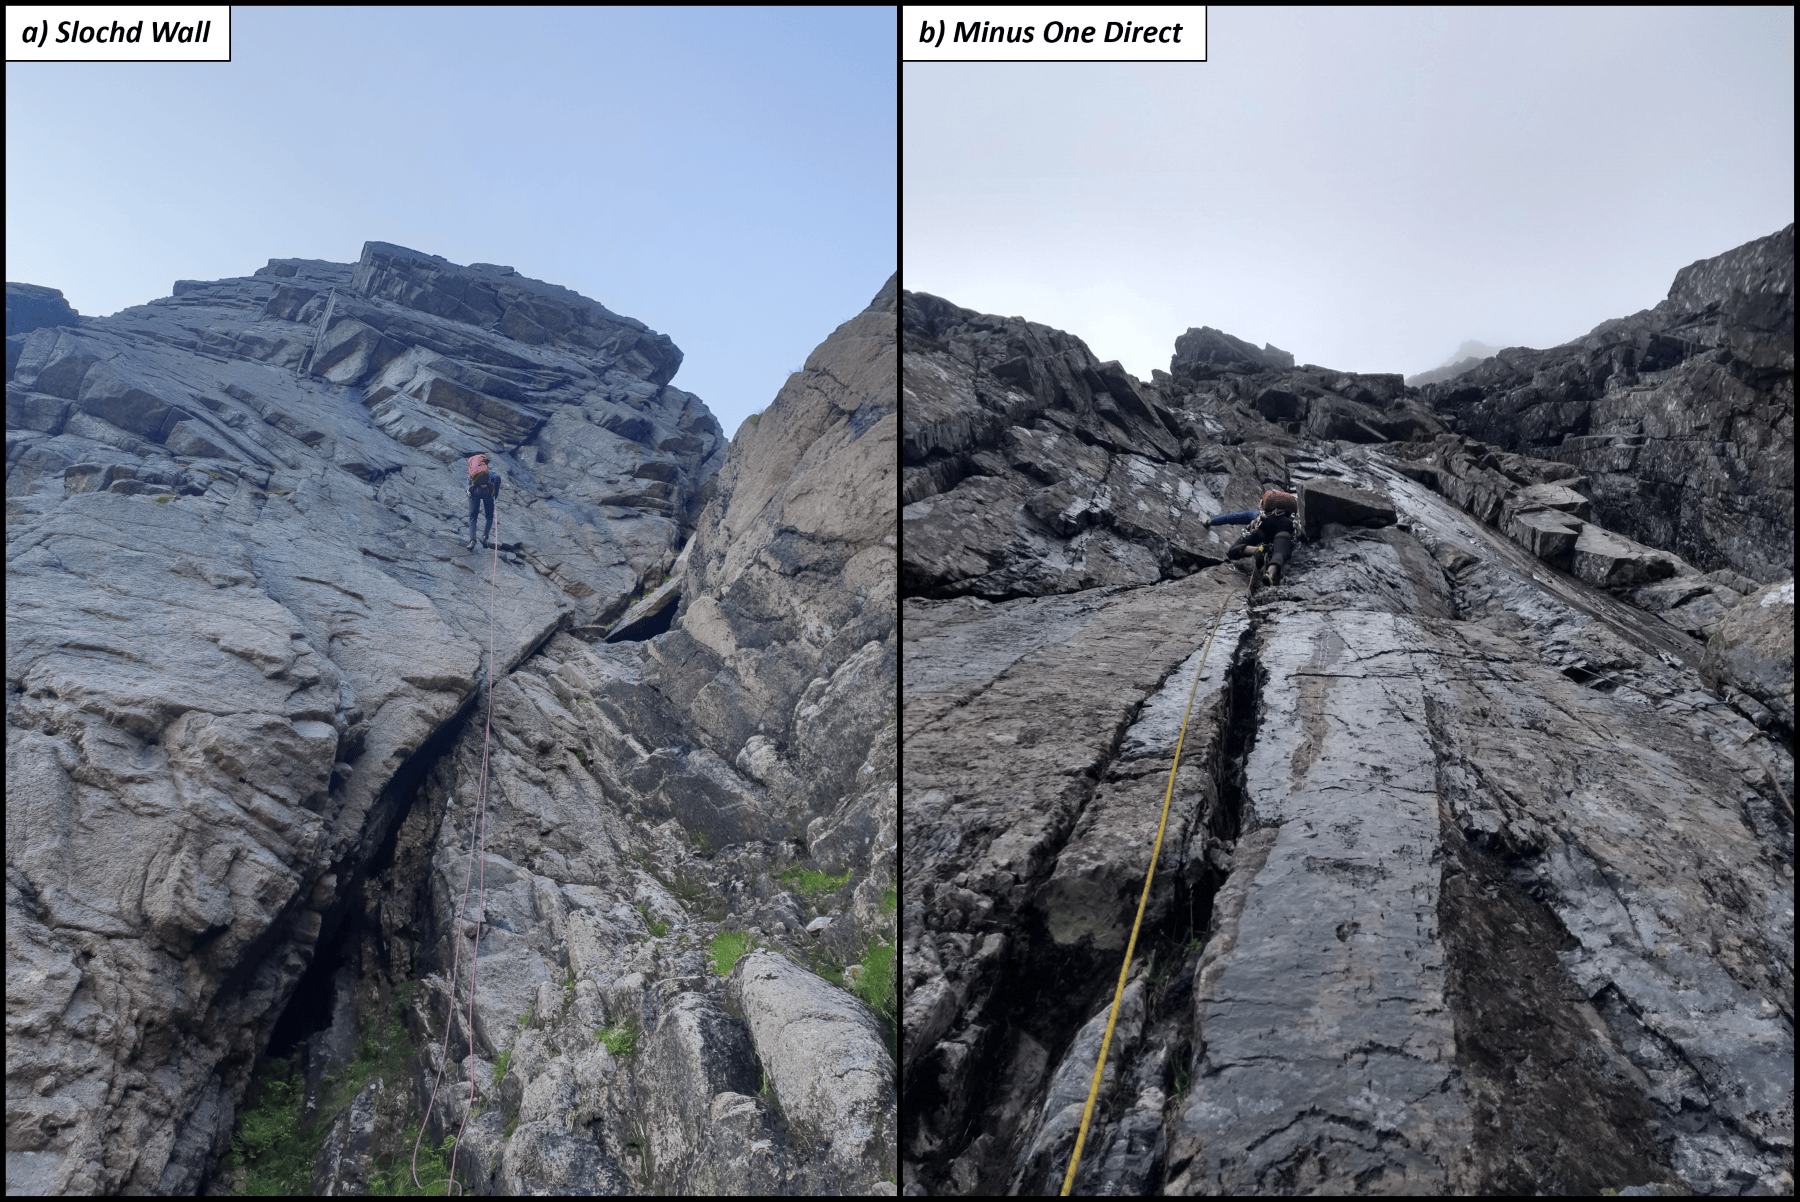
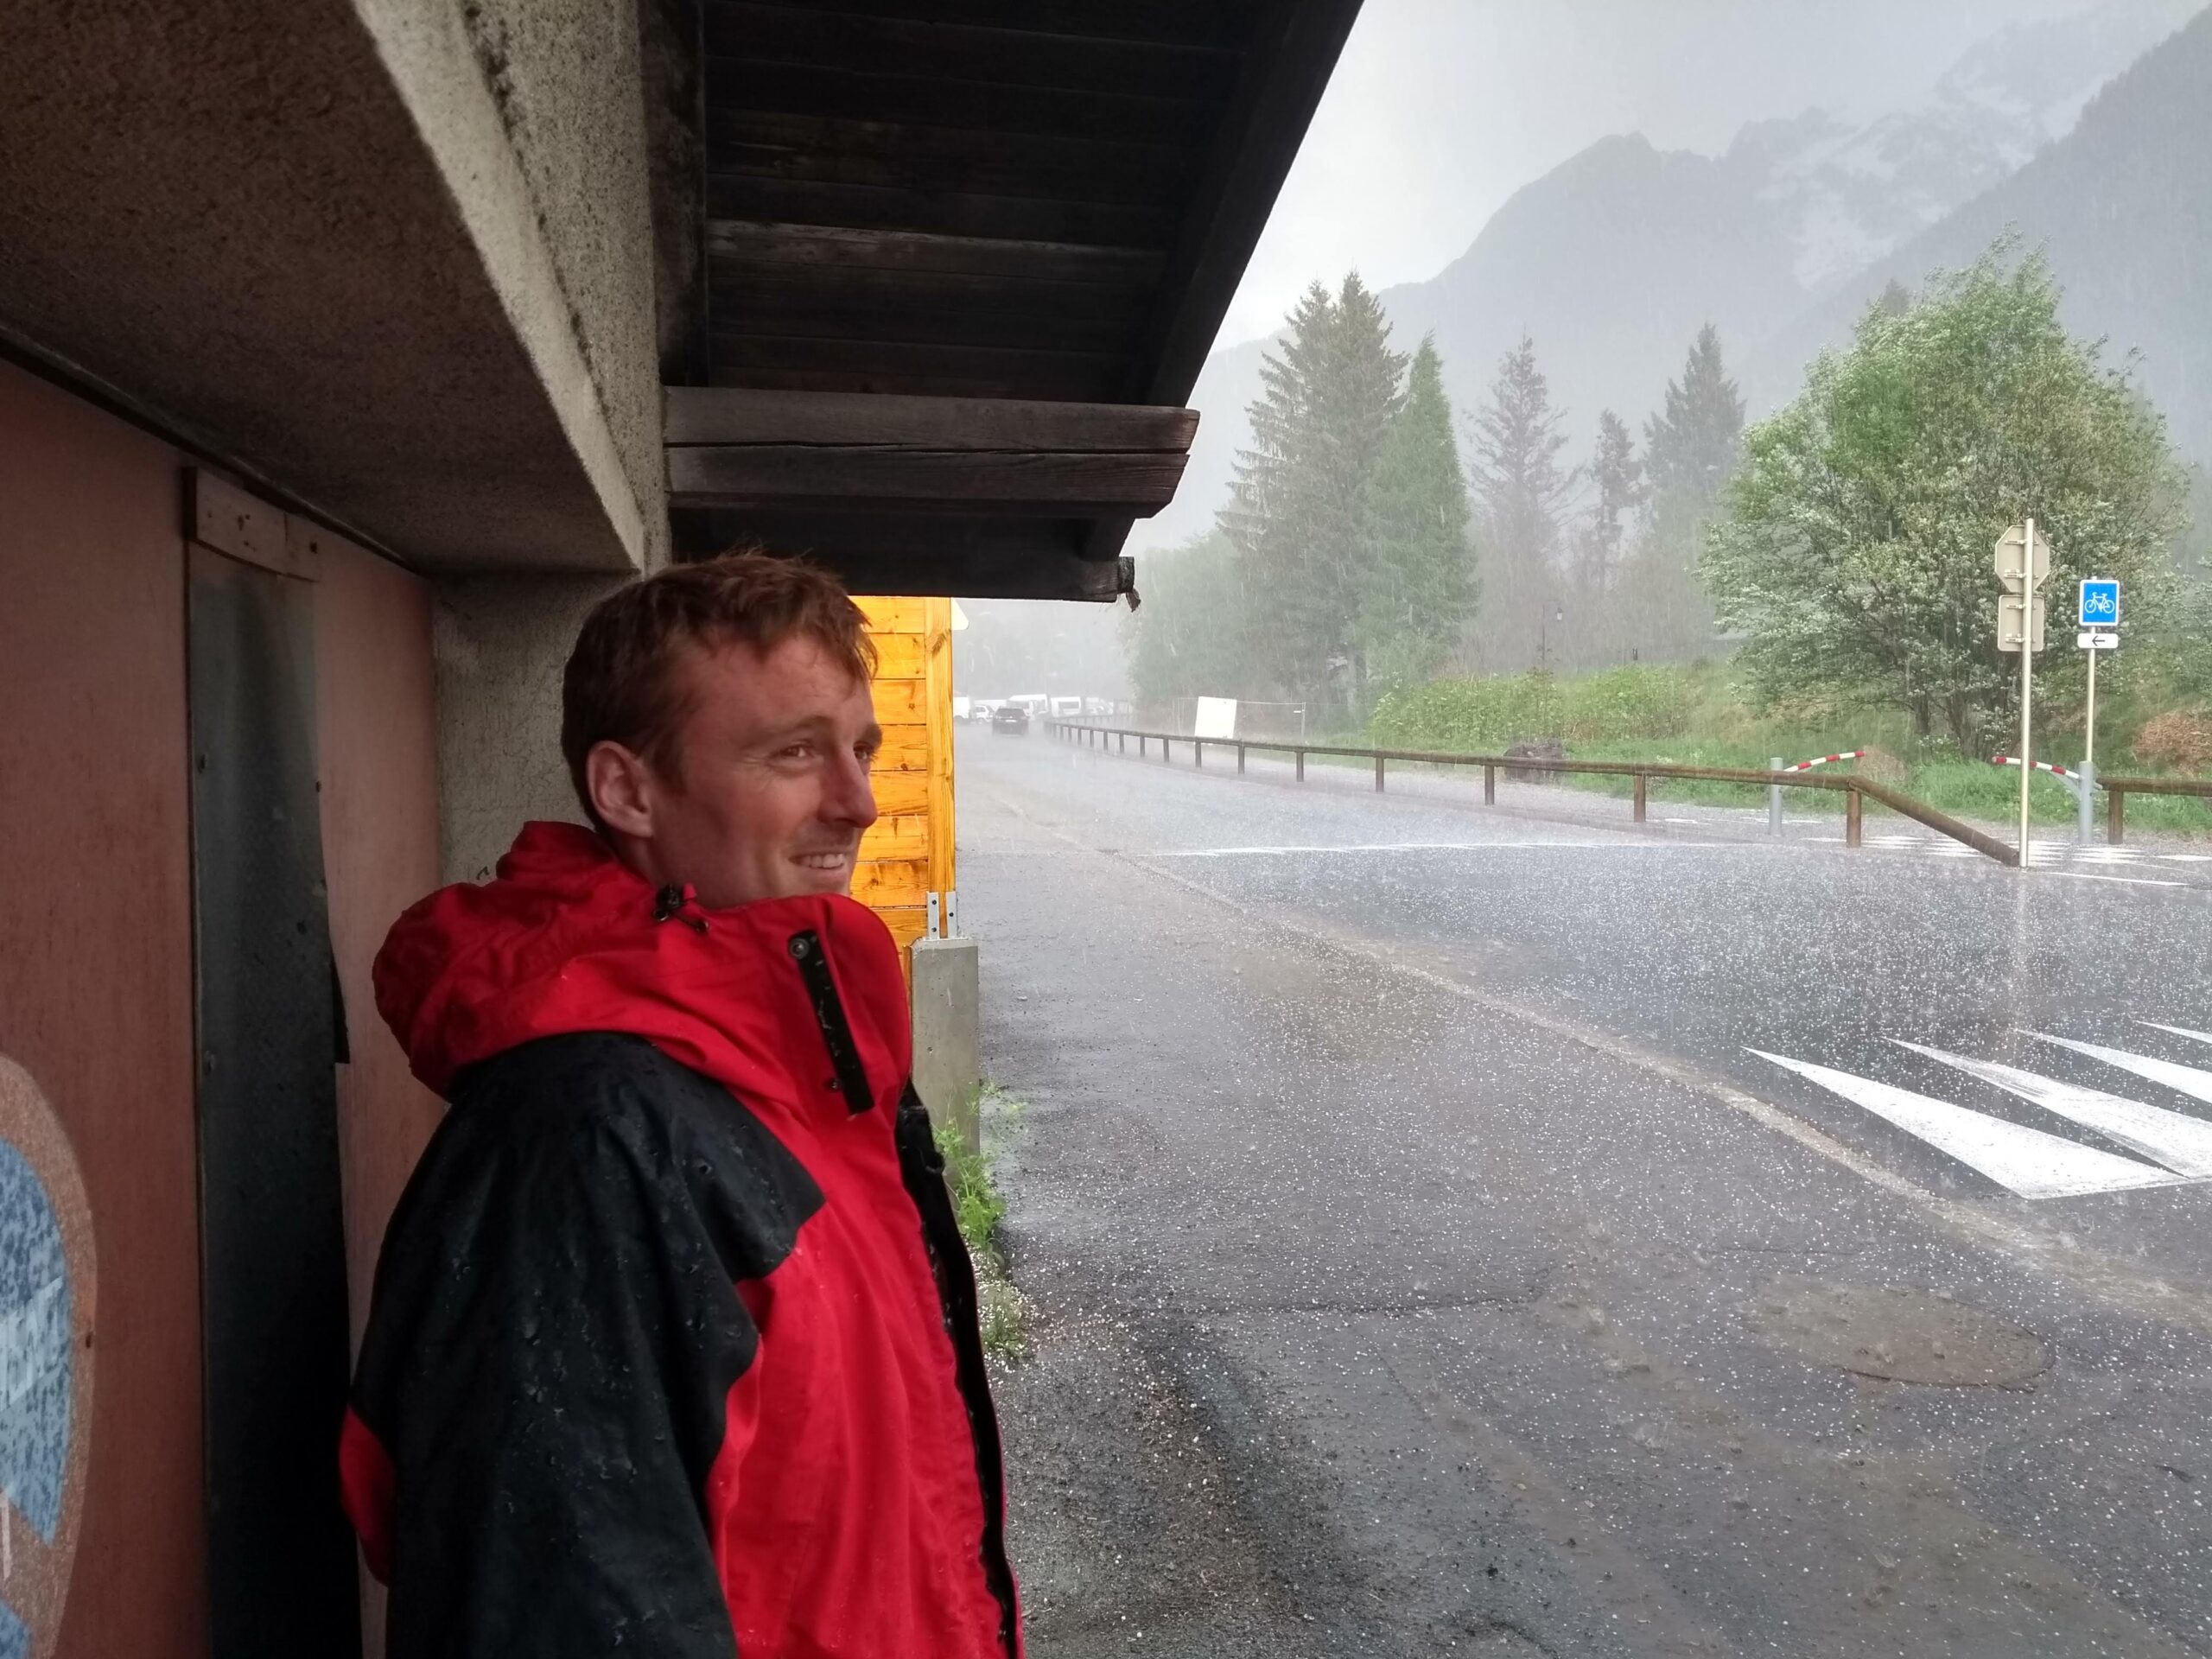
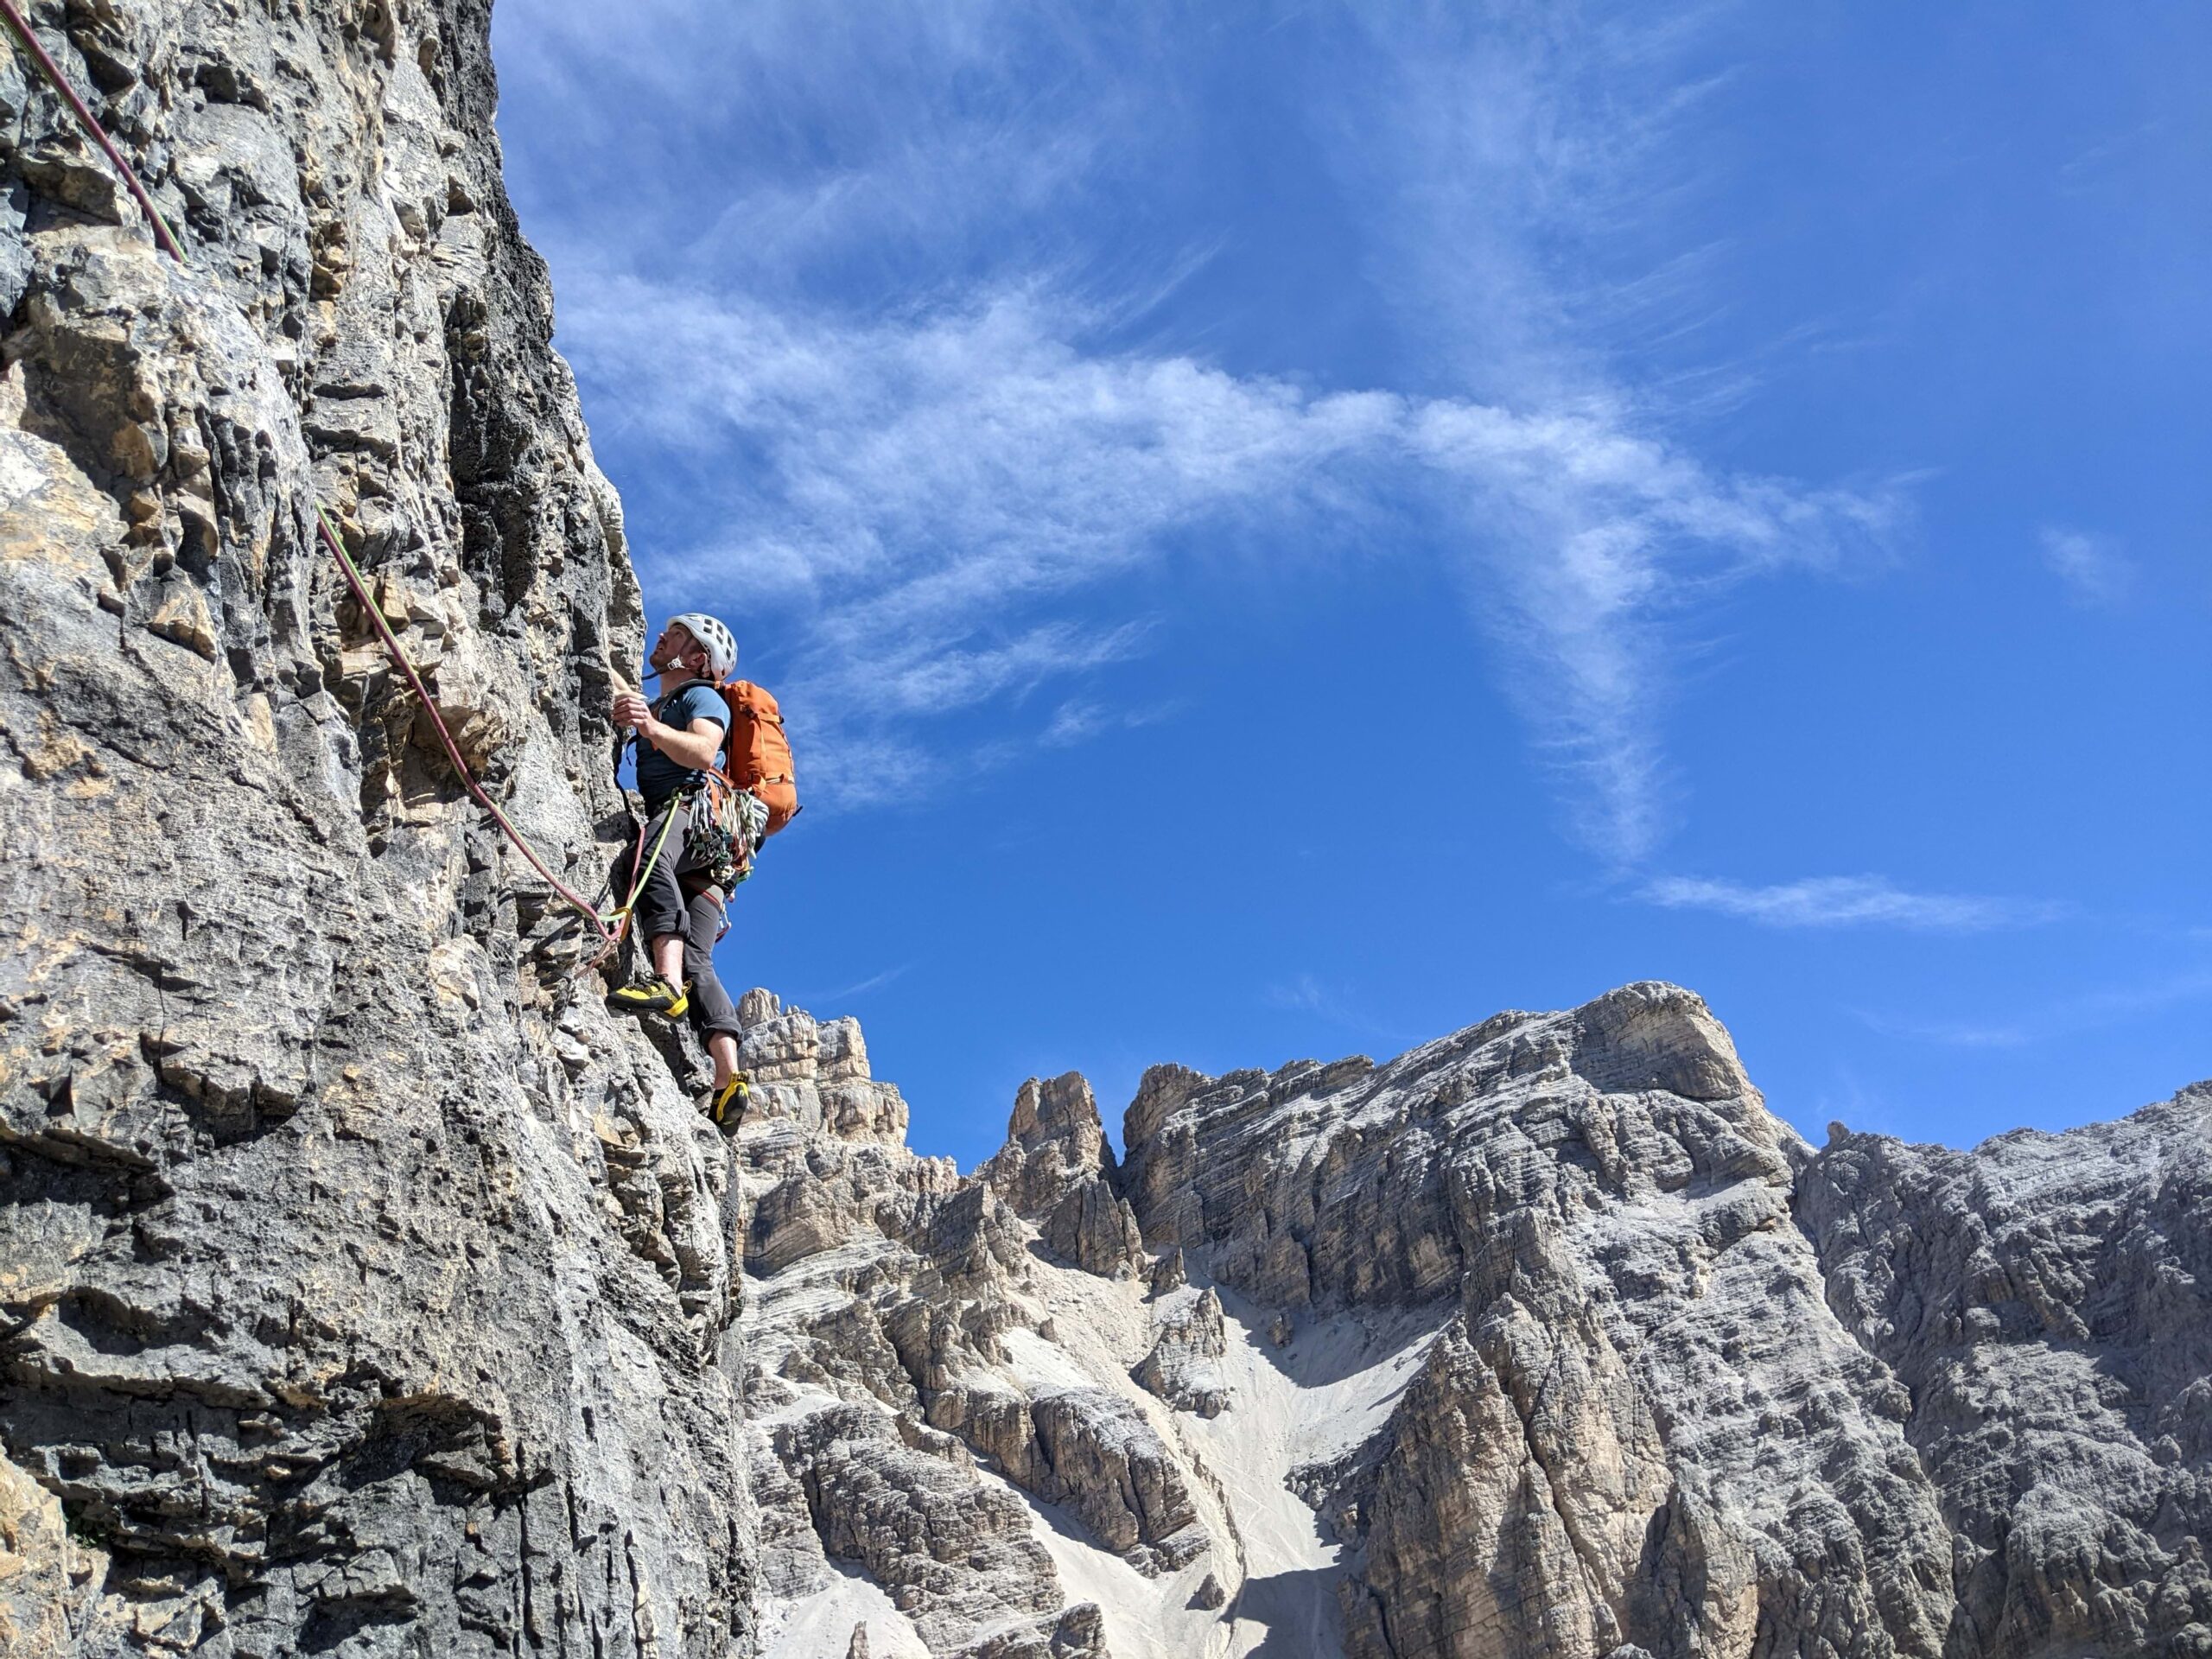
Until now, I’ve been collating and reviewing the forecast data manually. This involves looking at the forecast for multiple locations and iteratively building a mental model of the weather conditions for the given timeframe. As mentioned previously, this is time-consuming and error-prone. Despite doing this for many years, the challenge of characterizing the relationship between multiple dependent variables often results in mis-judgements (Figure 2). Mis-calculations, are especially frustrating when on long (≥1 week) trips to the bigger mountain ranges (e.g. European Alps), as such trips require significant time and effort to organise and are costly. In these scenarios it’s especially important to be able to make decisions quickly and efficiently. Following a challenging trip to the Western Alps in 2022 (Figure 3) and motivated by a planned two-week trip to the Dolomites in Northern Italy in September 2023, I decided it was time to reduce the chances of weather-related issues and created a tool that made this process more efficient and reliable.
The Conditions Navigator Application
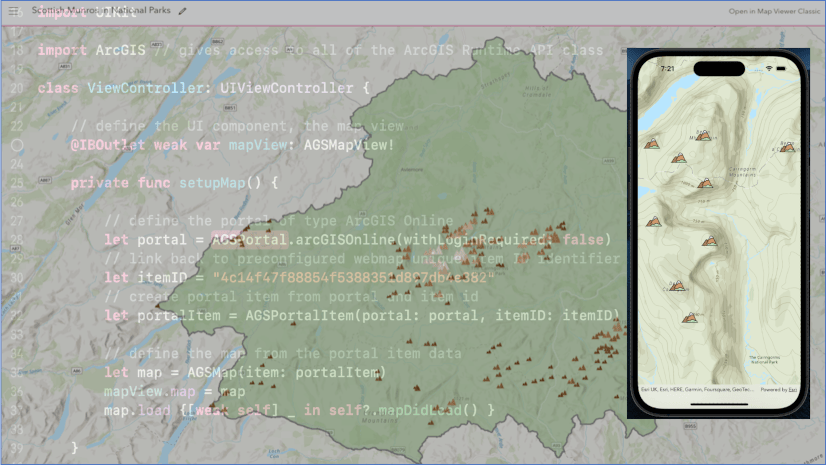
My aim was to create an application that worked on my Android phone which automatically retrieved forecast data from a weather API and guided us towards mountains where the weather was suitable for climbing. To achieve this, I created an application called the Conditions Navigator using the ArcGIS Maps SDK for Qt, which was deployed to my Android phone (Figure 4). The Qt Maps SDK is a great tool for efficiently creating cross-platform applications, so I could use the application on both my laptop and phone.
The fundamental building block of the application is a map with a topographic basemap, which provides an application user with information about the terrain adjacent to the summit of each mountain. The map acts as a canvas onto which I built all other functionality.
The second most important component is a representation of each mountain where there is climbing. Each mountain is symbolised on the map using a dull-red coloured pin symbol and represents a custom data structure that stores and curates the weather data for that mountain. To achieve this, I defined a template for my custom data structure (i.e. a custom class) which I called Mountain. The data structure includes:
- Latitude, longitude, and elevation for the summit of the mountain.
- Dates of the seven days following the day the application was initialised.
- Weather data for the next seven days, including hourly and daily data, which was retrieved from the open-meteo.com REST API.
- A calculation for analysing the forecast data and providing information to other parts of the application, such as UI elements (e.g. identification of max hourly rainfall on all mountains).
When the application is initialised, a static free function is called that returns a list of Mountain objects. This list of Mountain objects is hard-coded into the application, including information about each mountain such as the location (latitude and longitude) and elevation. This means Mountain objects are created each time the application is started – the application is not reliant on a map published online (i.e. web map).
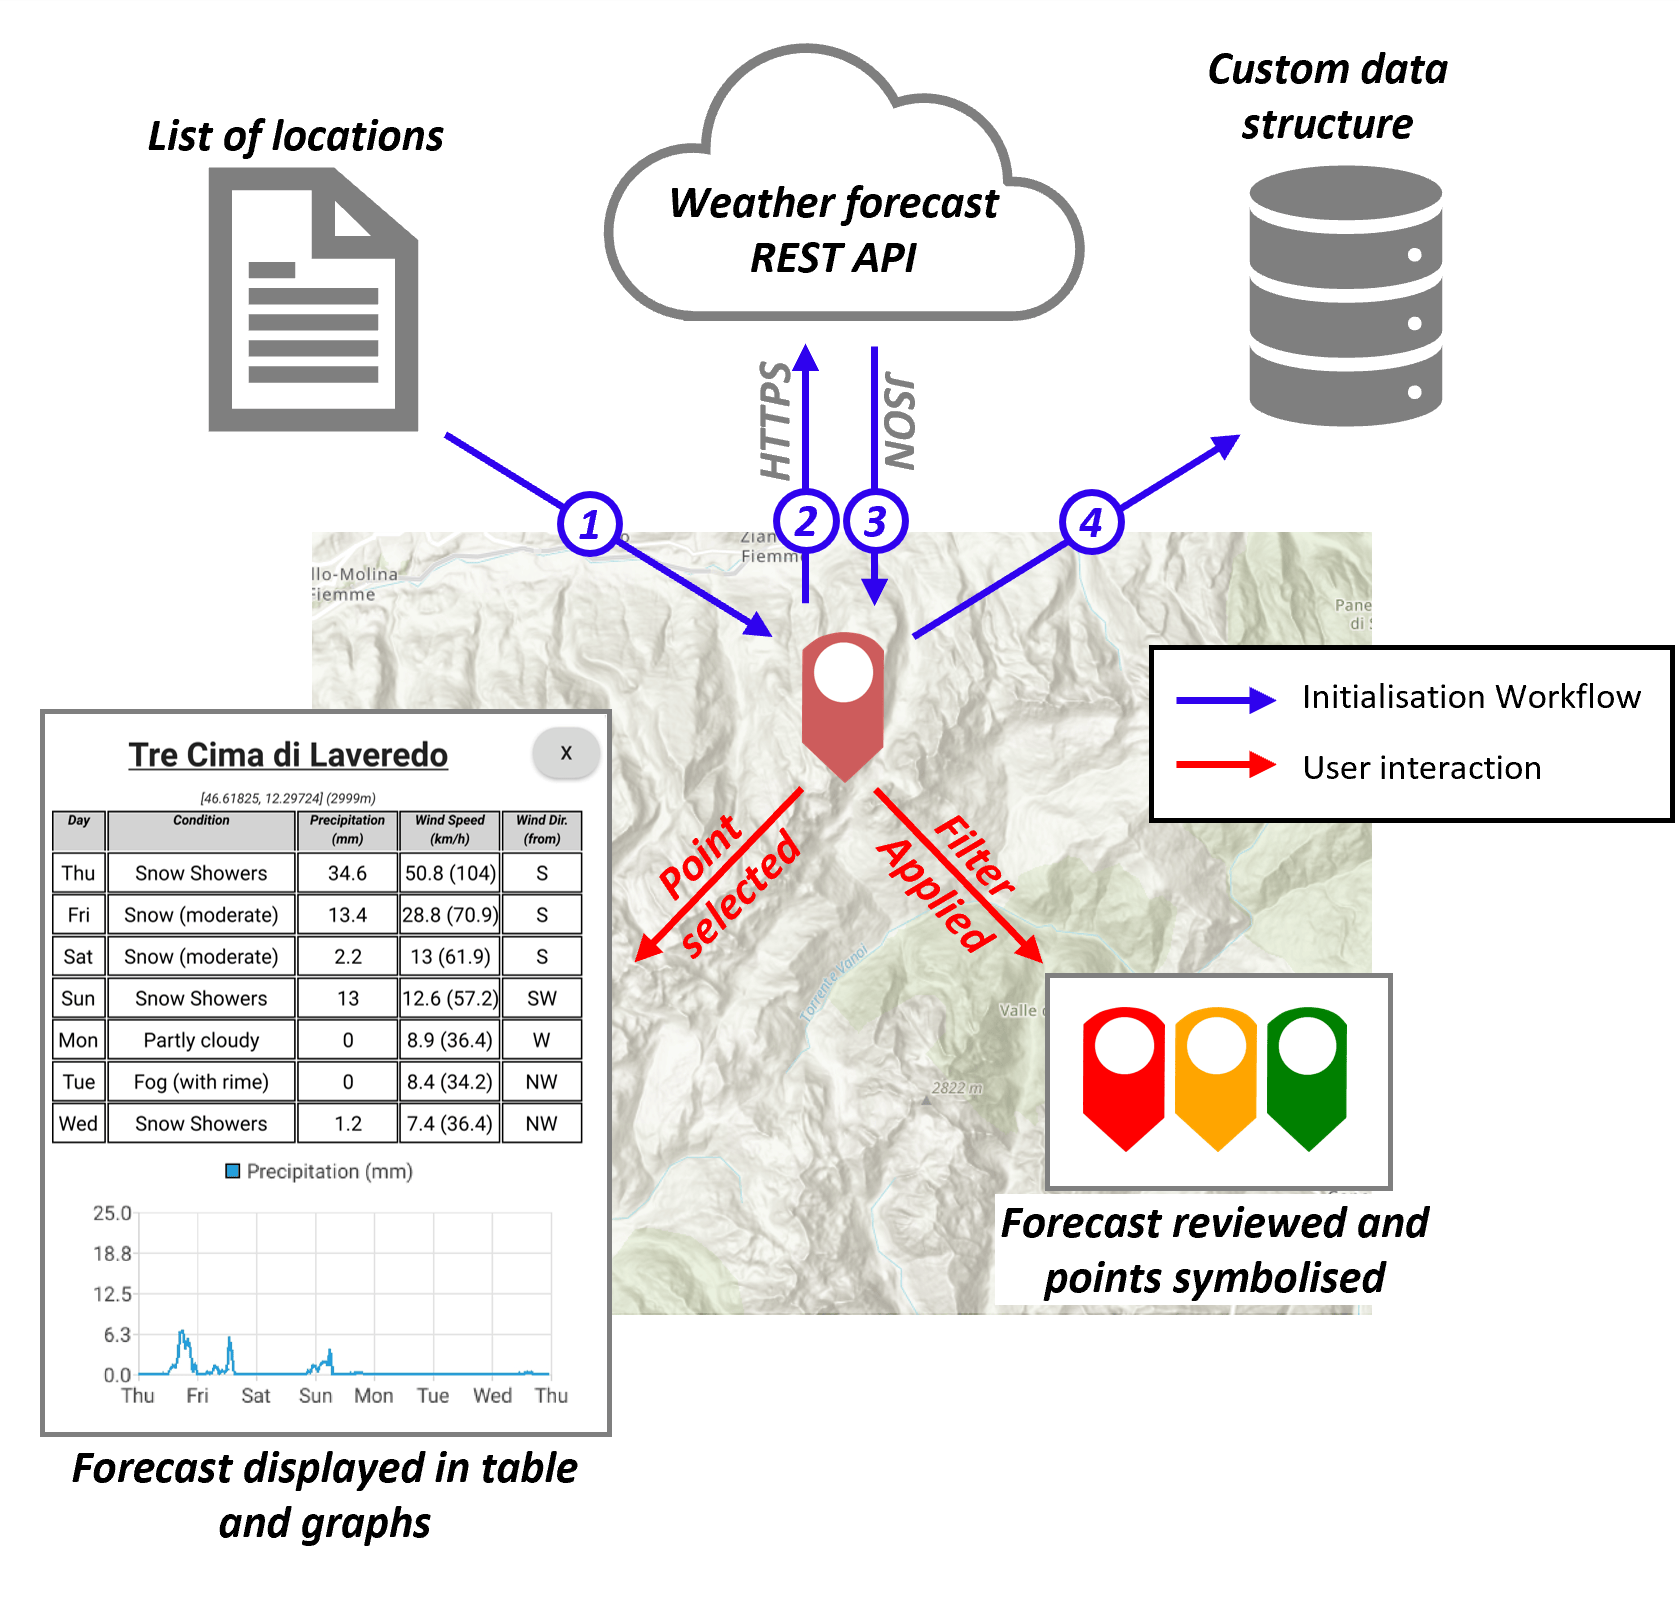
Once the list of mountains is created, the application performs the following initialisation workflow for each mountain (Figure 5):
- Create a symbol and add it to the map. This was done by creating a Graphic from a MultiLayerPointSymbol, and adding this to the map’s GraphicsOverlay.
- Retrieve forecast data by sending a HTTPS request to the RESTful open-meteo.com weather forecast API (an overview of how to do this is given in a recent blog).
- Wait for JSON response from forecast service.
- Process response and organise forecast data into desired structure.
A label is also added to display the name of the mountain using the LabelDefinition class and a listener is set up using the mouseClicked and touched events on the map view to identify when a user taps the map (implementation details can be reviewed on AndrewBladon’s QtWeatherApp repository).
Once the initialisation workflow has been completed, forecast data is available for each mountain and the application is ready for user-interactions.
The application has two main functions:
- Display the forecast for a mountain for the next seven days using Qt’s Chart and TableView user interaction elements.
- User-interaction: When a user taps on the symbol for a mountain, forecast data are displayed in a panel.
- Purpose: Quick review of forecast data for a mountain, enabling the forecast in different locations to be assessed efficiently.
- Categorise weather conditions at each mountain as good, marginal, or bad (indicated using green, orange, and red pins respectively), for a given day or days based on a set of hard-coded criteria:
- User-interaction: When the user presses the filter button and selects the desired day(s), the symbols are coloured according to the criteria.
- Purpose: Automate a component of the process of assessing the climbing conditions at various locations based on the relationship between multiple weather parameters (e.g. wind speed and precipitation).
| Parameter | Good condition | Marginal condition | Bad condition |
|---|---|---|---|
| Daily Rainfall [mm] | < 1 | 1 – 5 | ≥ 5 |
| Windspeed [km/h] | < 20 | 20 – 40 | ≥ 40 |
| Description of most severe weather [World Meteorological Organnisation code] | “Clear”, “Mainly Clear”, “Partly cloudy”, “Overcast”, or “Unknown” | “Fog”, “Drizzle, “Rain”, “Snow”, “Rain Showers”, or “Snow Showers” | “Thunderstorms” |
For more information about how the application was implemented, you can review the code as part of AndrewBladon’s QtWeatherApp GitHub repository. The mountains in this version of the application are the Munro’s – the 282 highest mountains in Scotland with an elevation greater than 914.4m (3000ft). The source code can be used to deploy your own version of the application or as a starting point for developing your own application.
How the Conditions Navigator helped make my holiday a success
As mentioned previously, the Conditions Navigator application was initially developed for a climbing holiday to the Dolomites, Northern Italy, in early September 2023. Even before we left Edinburgh, the application started adding value. Because we had easy access to forecast data for the entire mountain range, we could quickly and easily monitor the weather conditions during the week prior to our departure and assess the weather for the first week of our trip. We could balance this easily with our other commitments (e.g. work and family). With easy access to the weather forecast and an understanding of the recent weather history, which we gained by monitoring the forecast for the week prior to our departure, we could start to identify some initial climbing objectives before leaving home.
While in Italy, the application continued to help. Very little of our time was spent reviewing forecasts. We were able to identify areas in the mountain range where the weather was good and make informed decisions quickly. This meant we had plenty of time to enjoy the local beer and pizza! Because we had decided to camp in order to be flexible, we could move to areas where the weather was favourable and there were climbs we wanted to do. This meant we were able to climb on 10 out of the 11 days we had available and in three different regions: Cortina d’Ampezzo, Canazei, and Arco. Overall, a very successful trip!
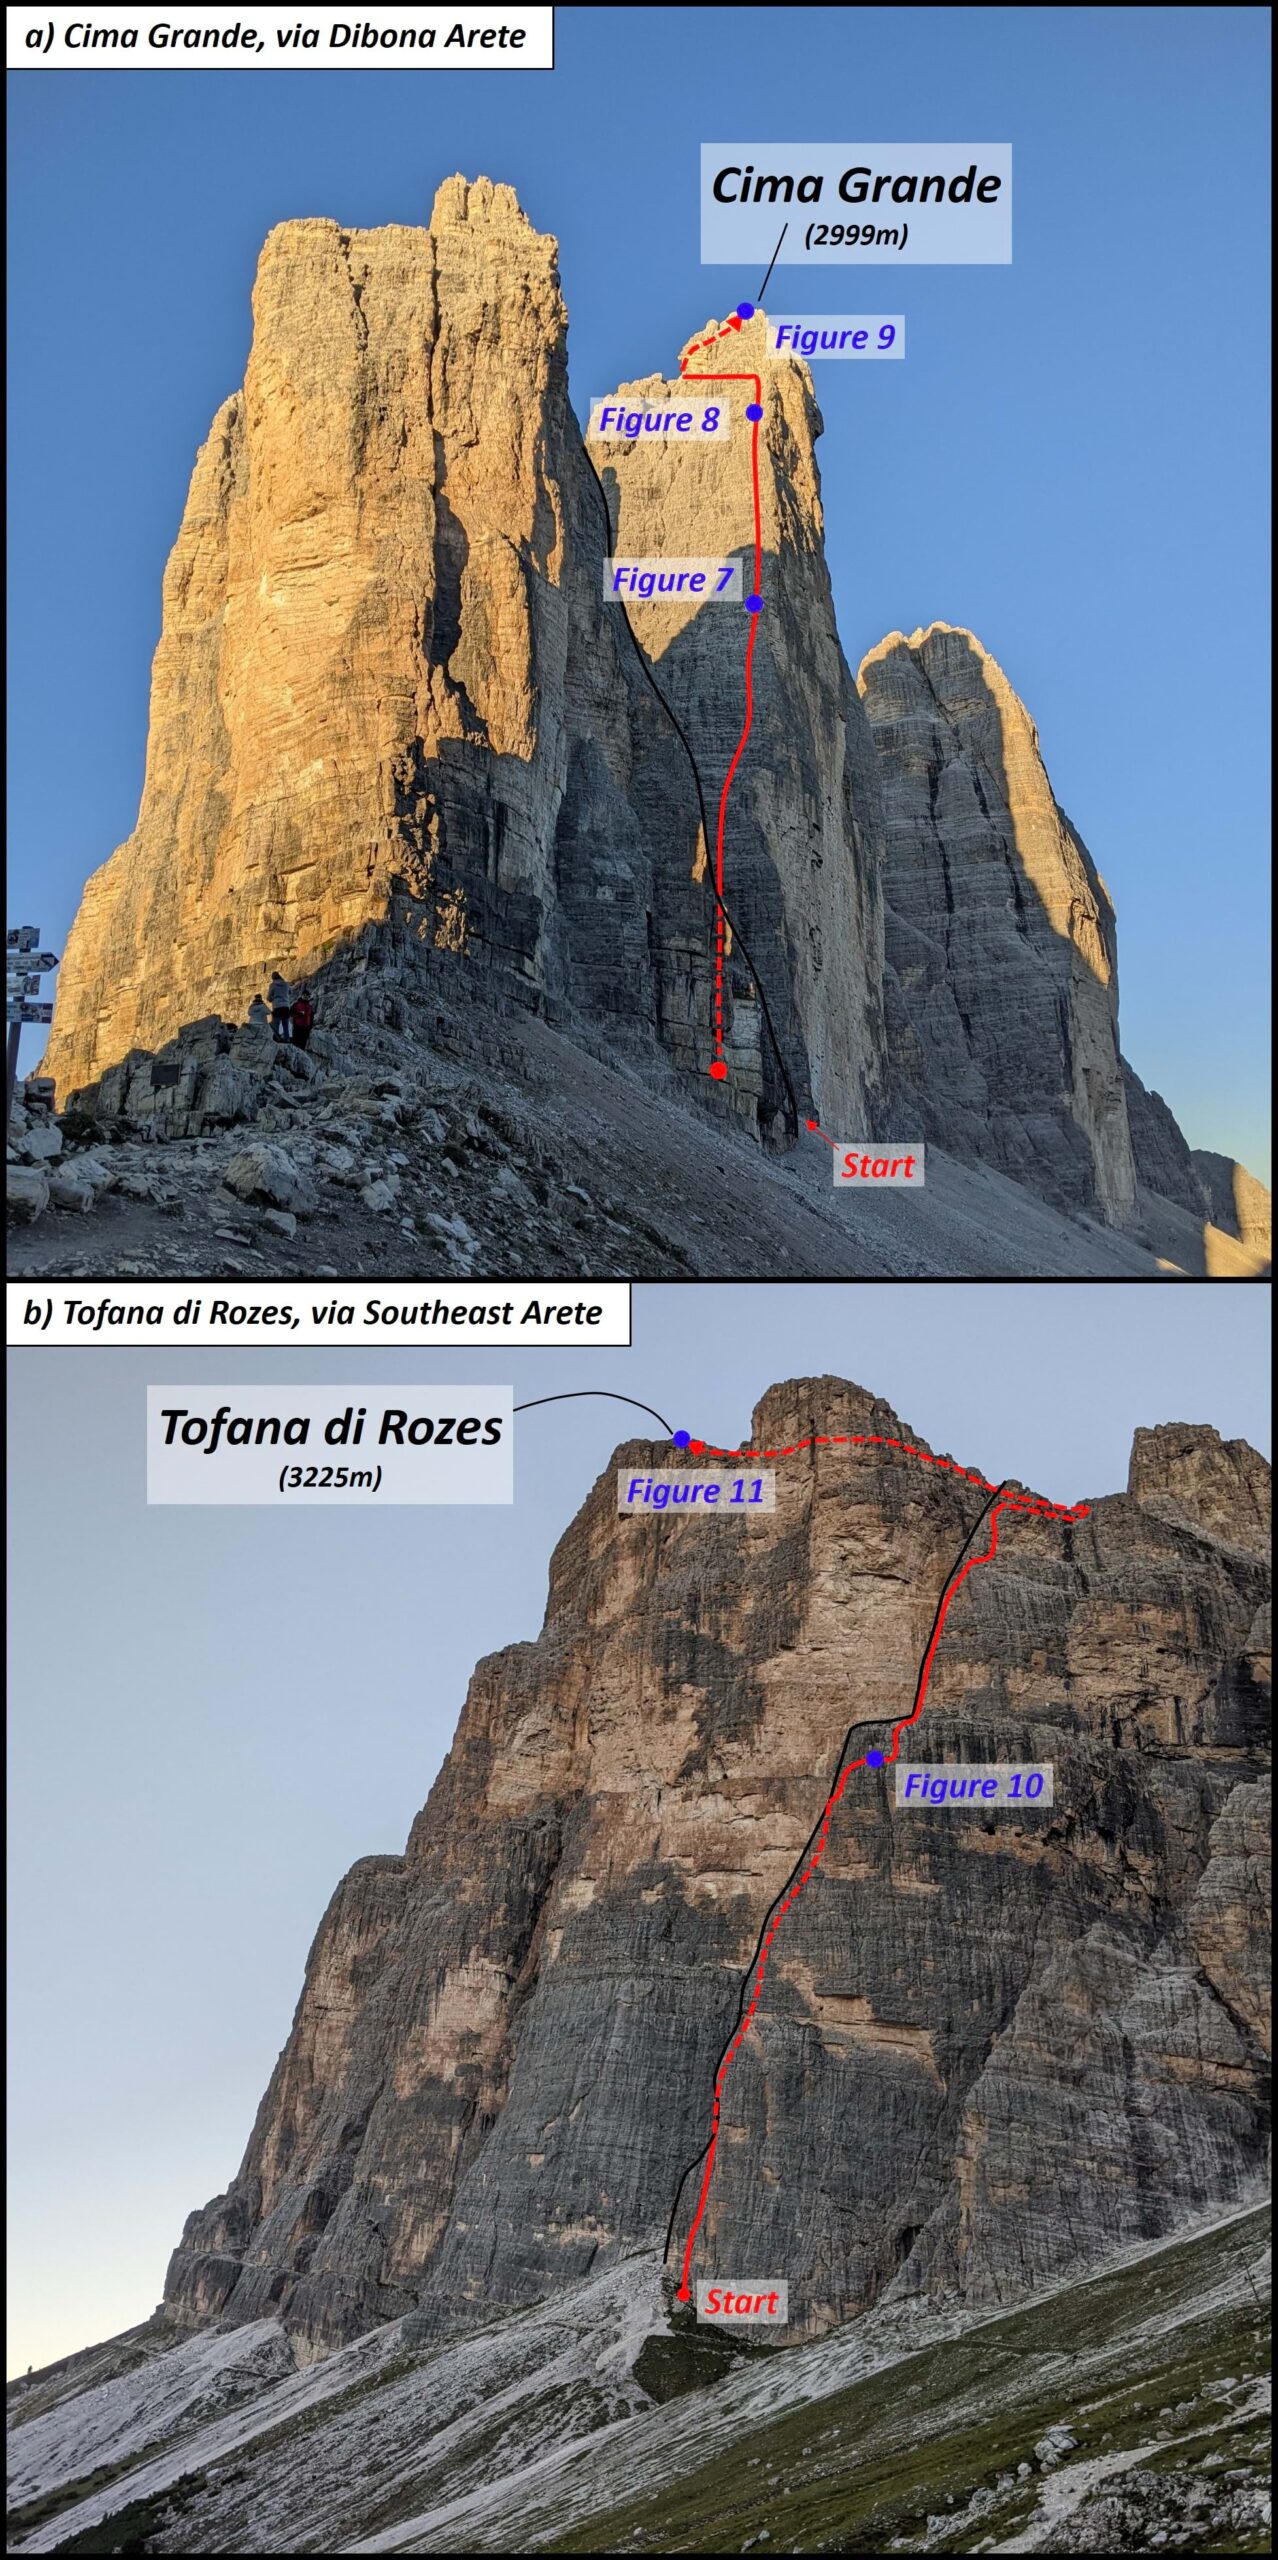
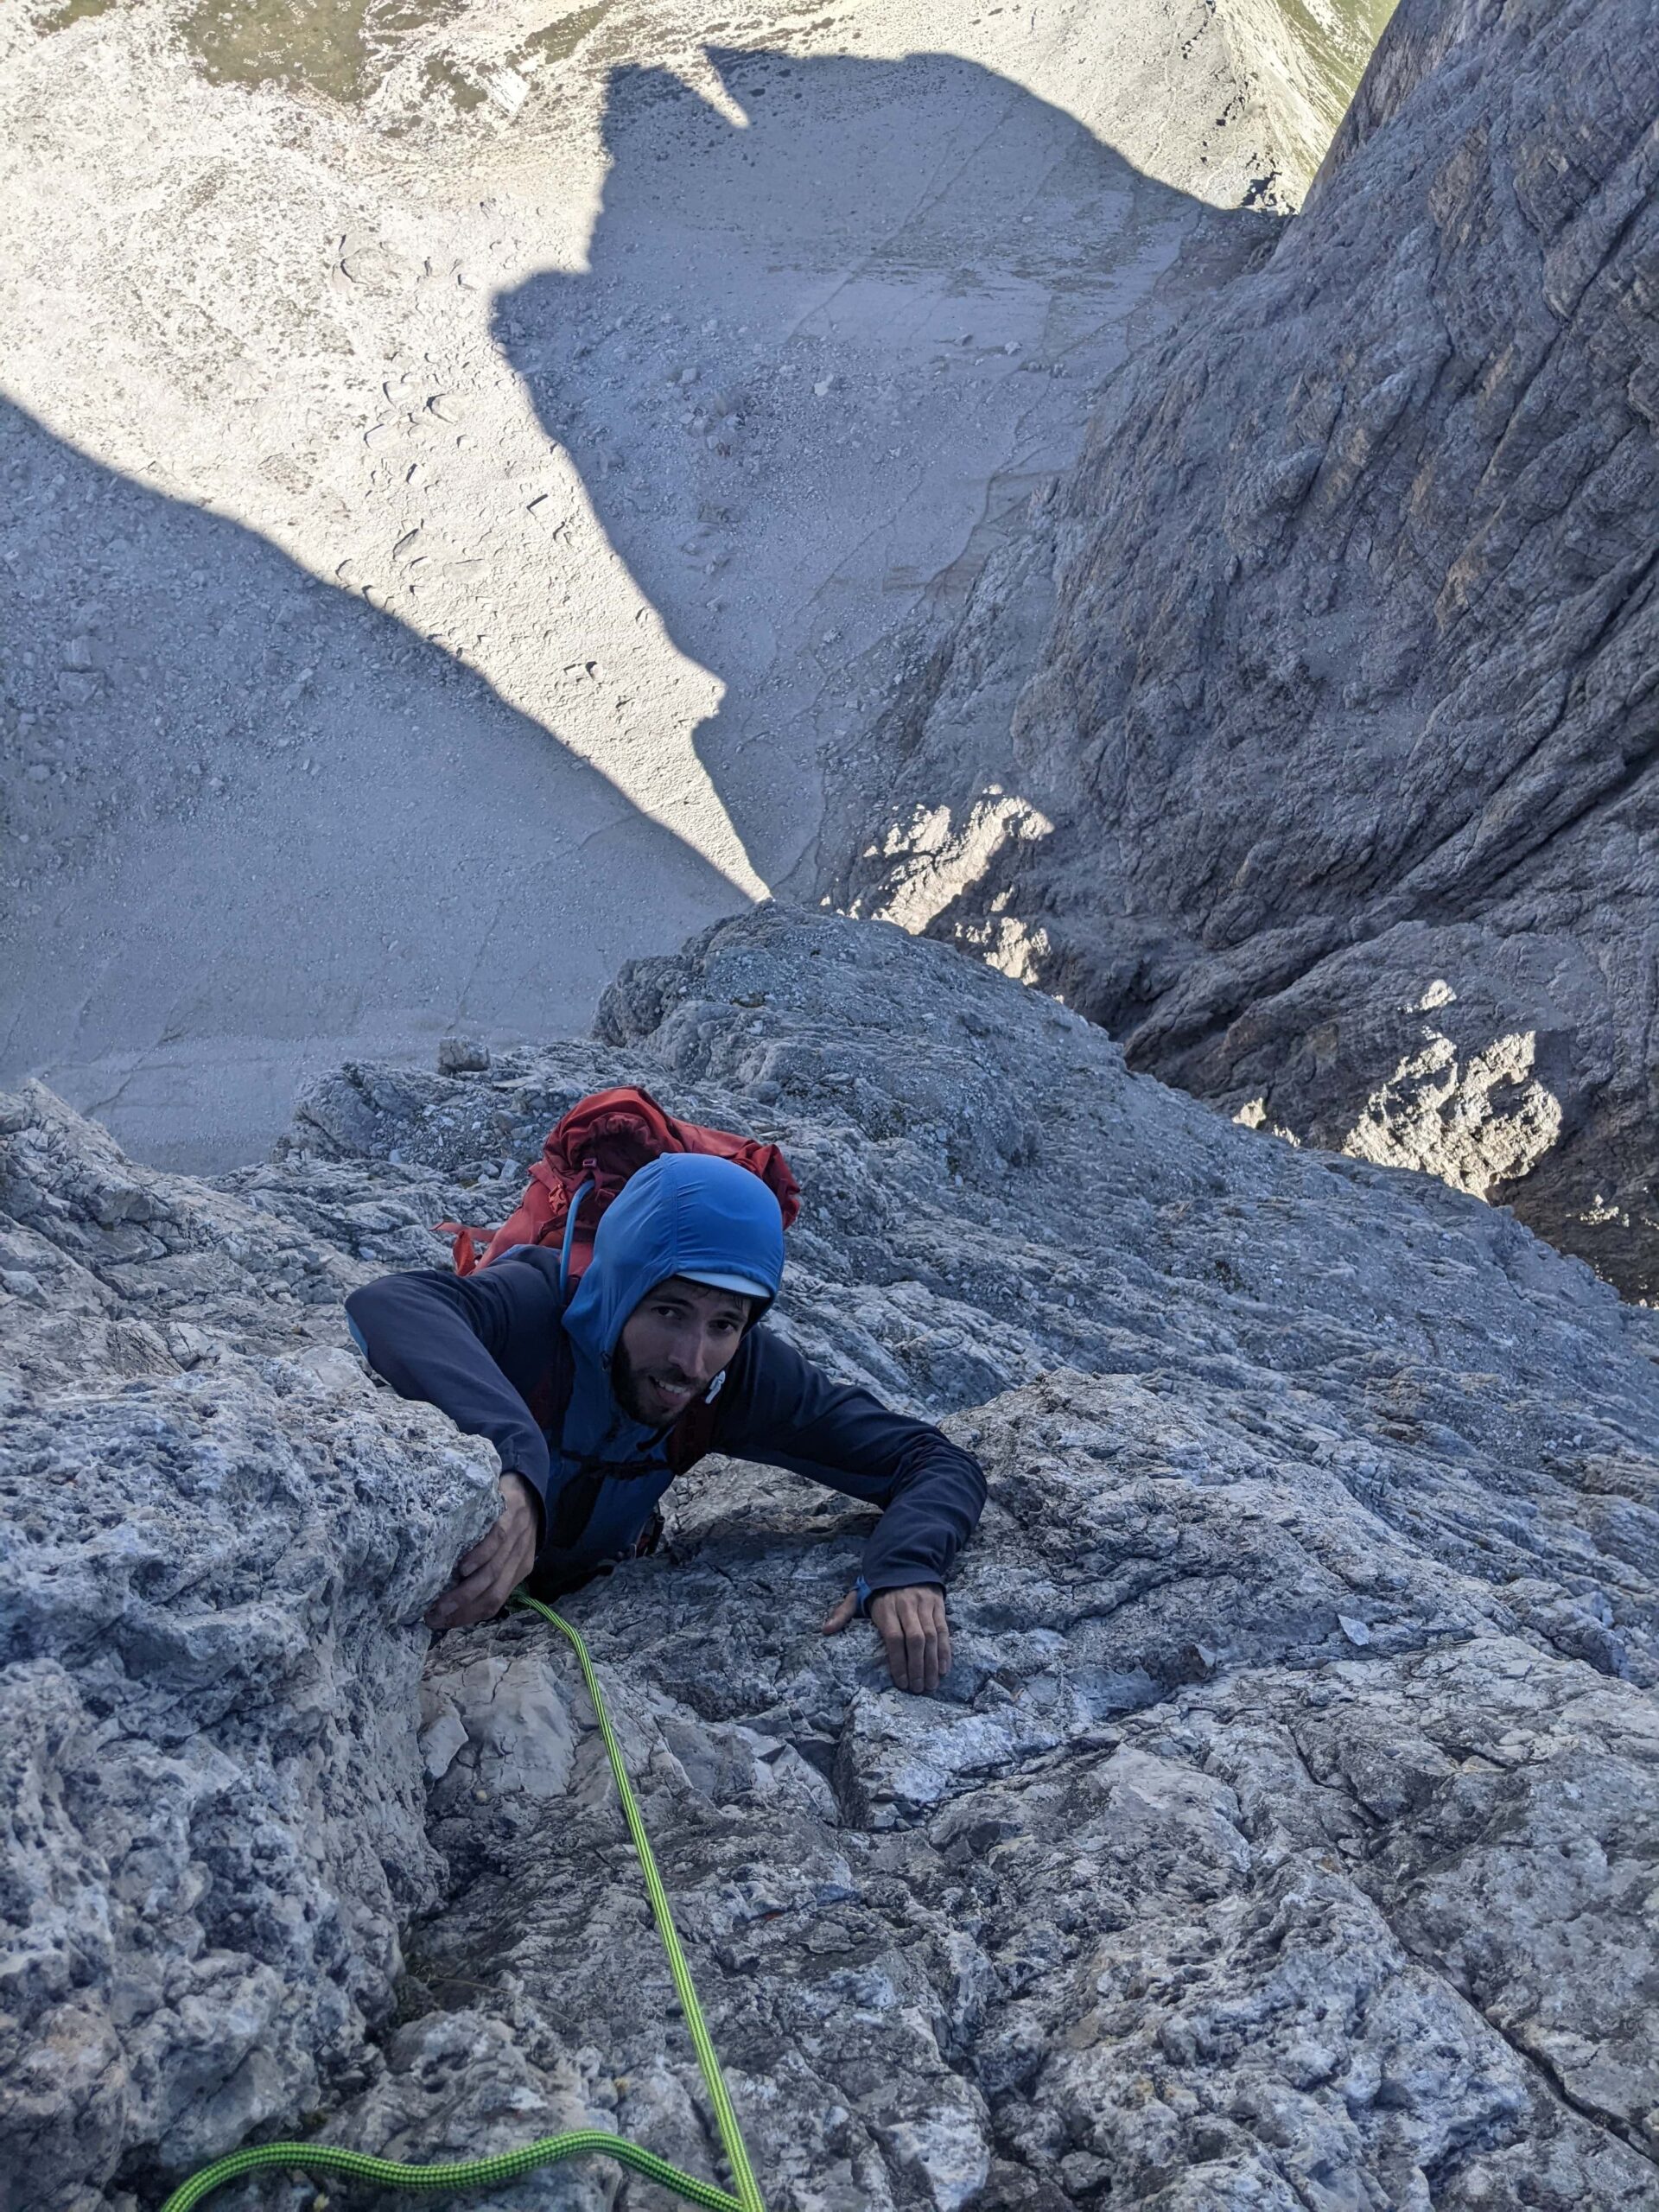
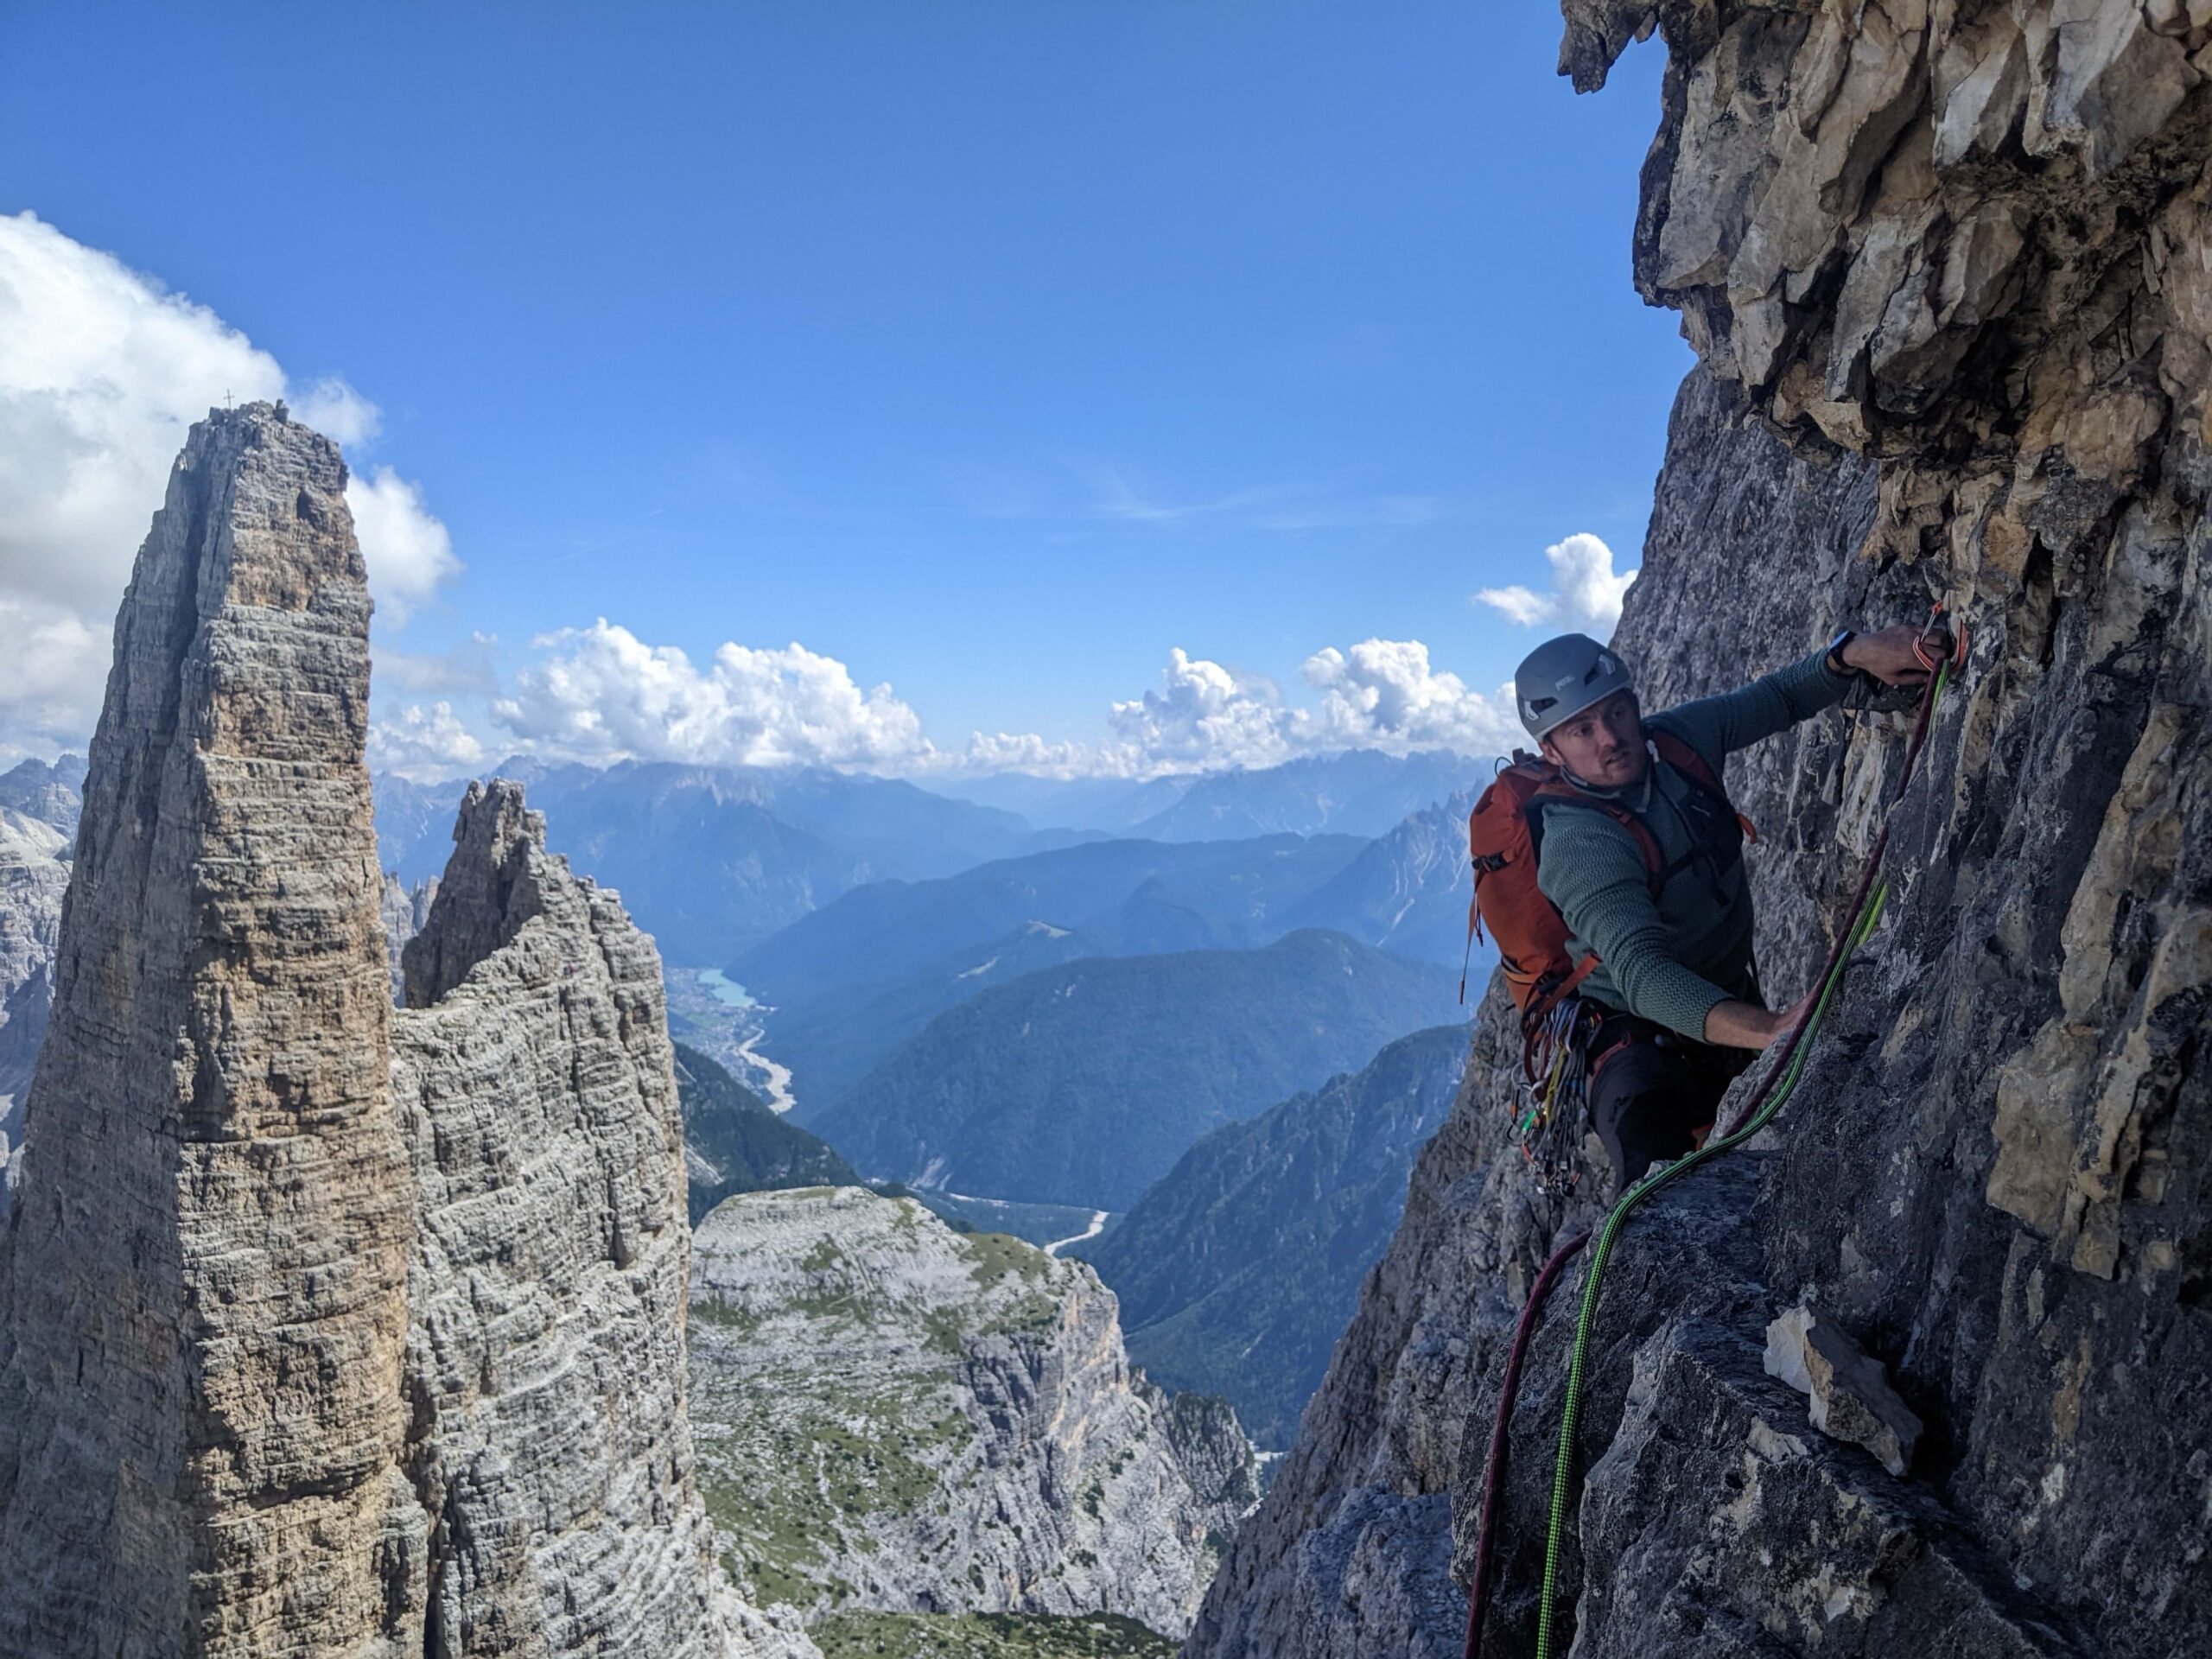
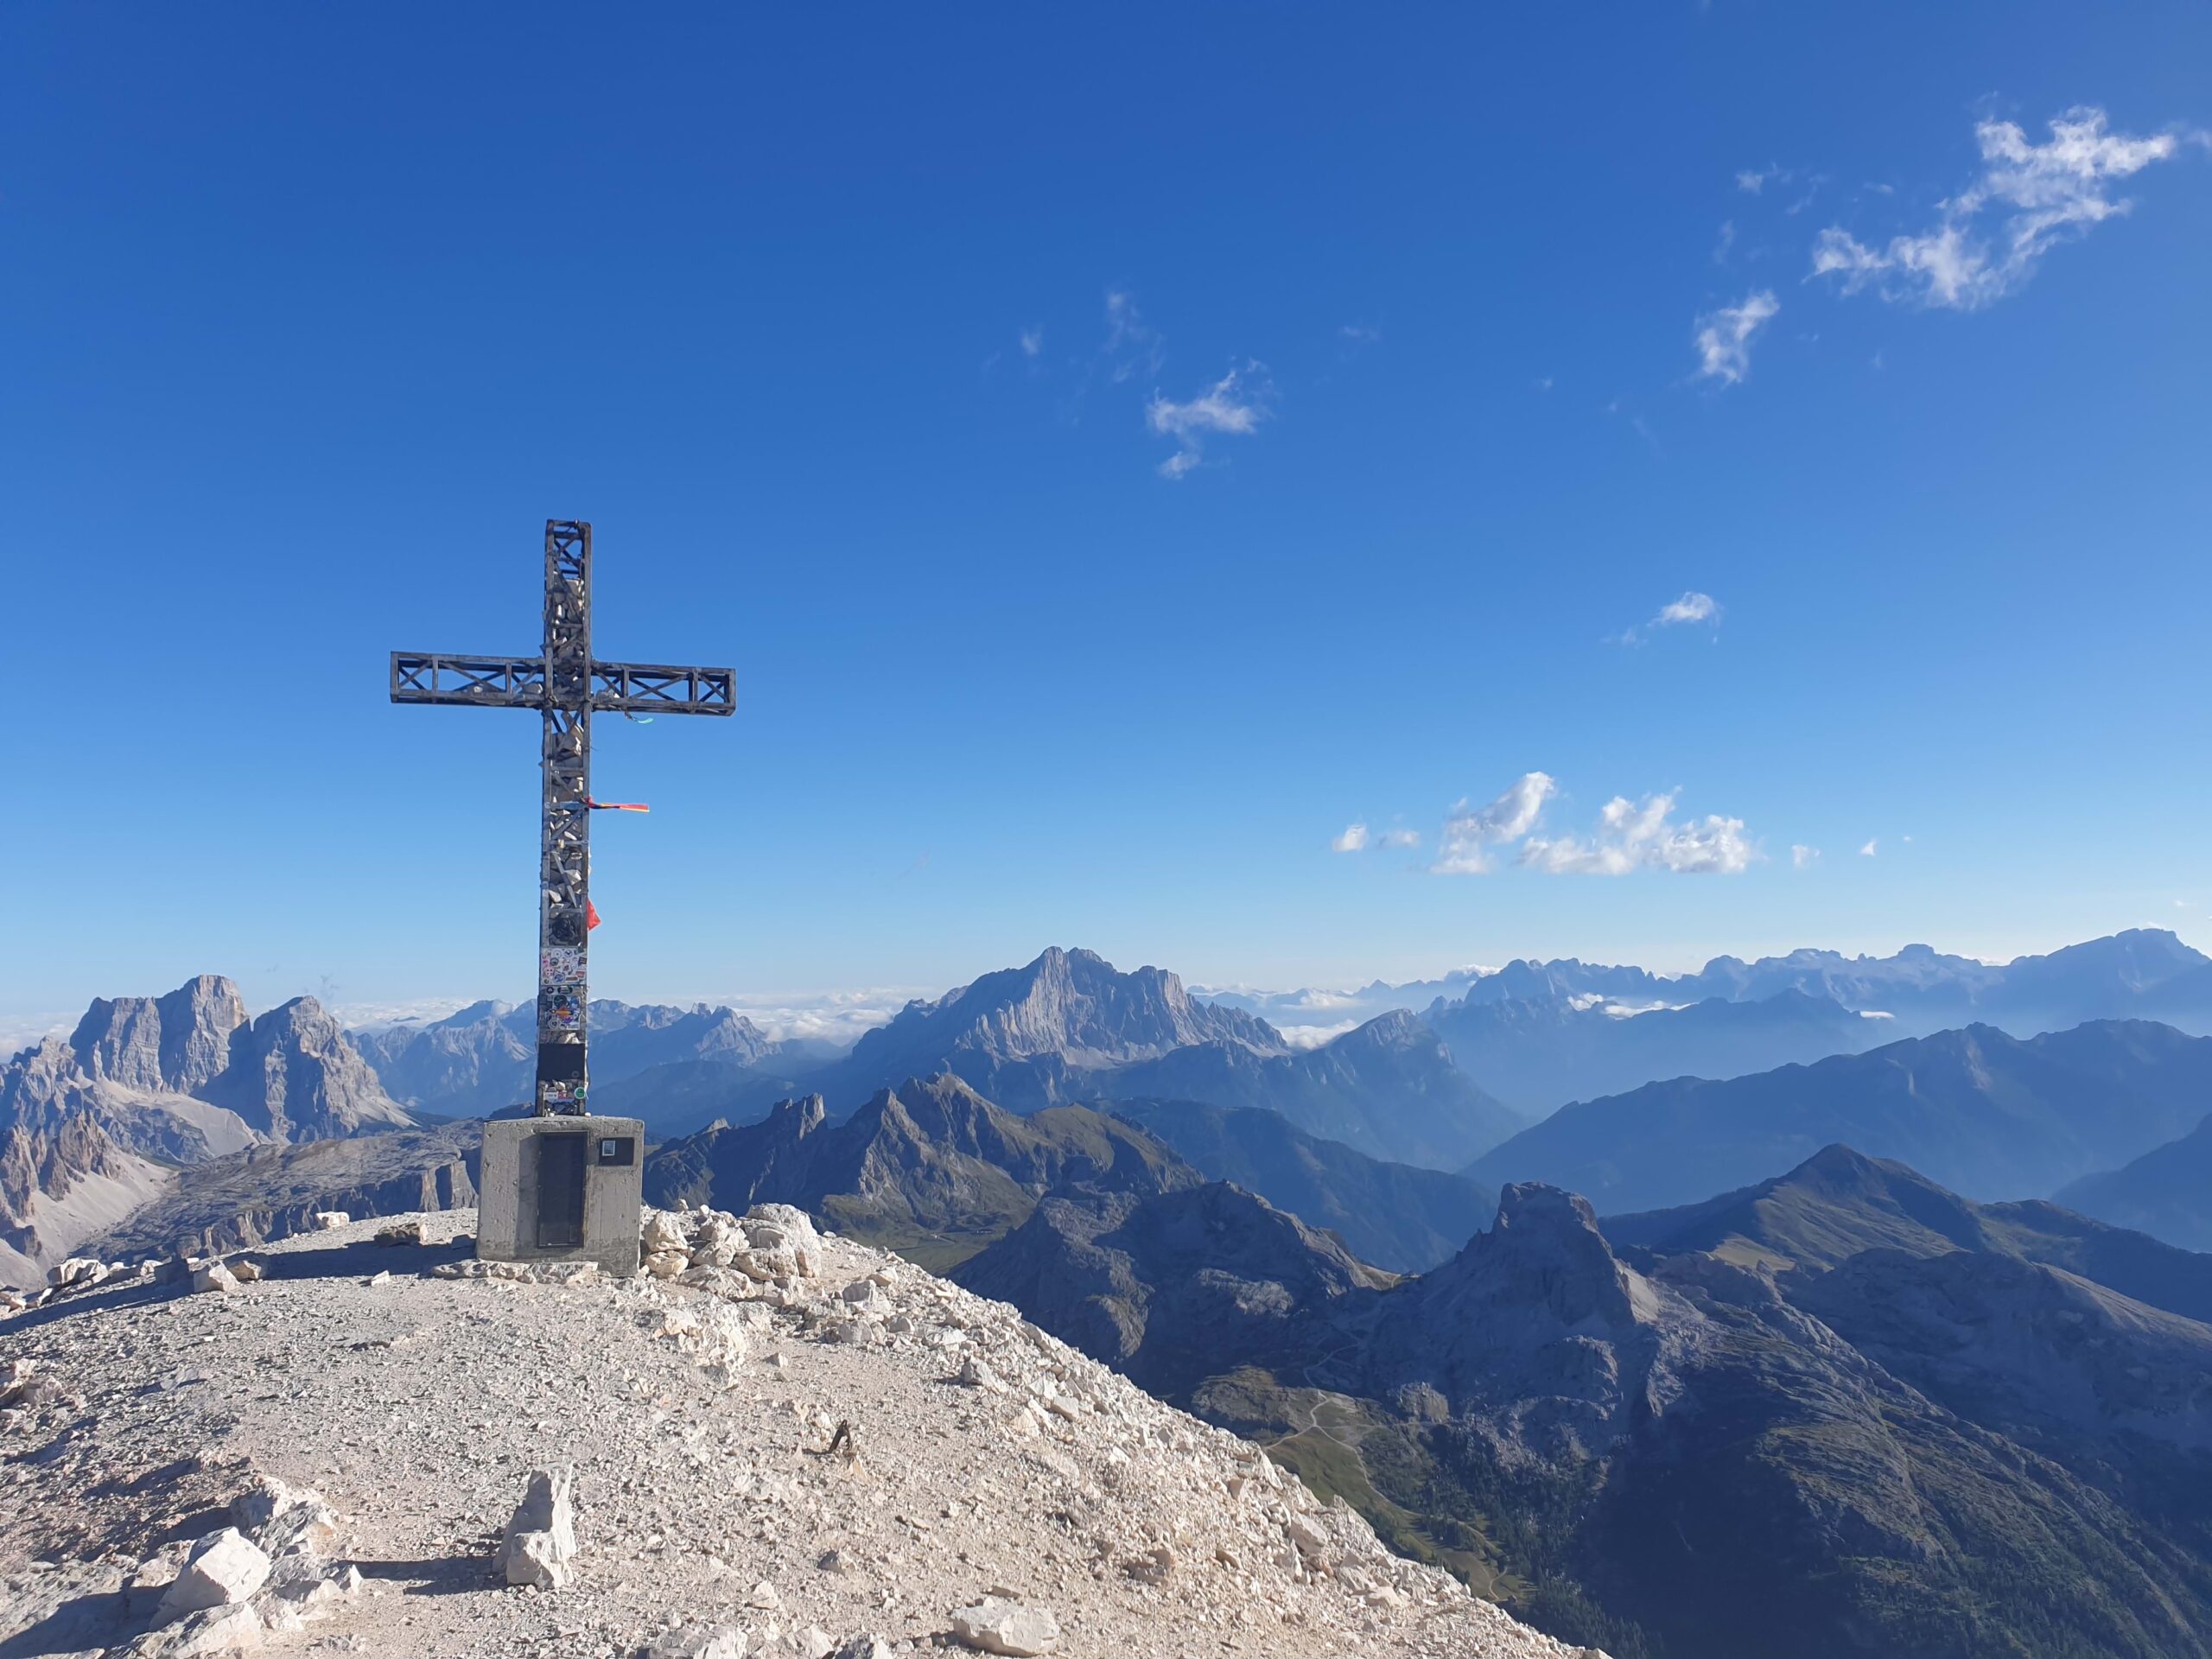
Photos from two of the more significant climbs we did on Cima Grande (2999m) and Tofana di Rozes (3225m) are shown in Figure 6 to Figure 11. To see more photos from the trip, visit my Climbing in the Dolomites StoryMap.
Summary
I’ve introduced one of the challenges faced by people planning to rock climb in the mountains, which is assessing the mountain weather conditions. I also gave an overview of the process I currently follow to overcome this challenge. I’ve shown that there are a number of variables to consider and tried to highlight how mistakes and mis-judgements are common due to the size and complexity of the task. I then introduced the Conditions Navigator, which is an application created using the ArcGIS Maps SDK for Qt. The application aims to make the process of reviewing the mountain weather conditions more efficient and reliable. Finally, I described how the application helped make a recent climbing trip to the Dolomites in Northern Italy a success.
To find out more about developing geospatial applications using Esri’s developer technologies, including the various developer API’s available as well as samples and tutorials, visit Esri’s ArcGIS Developers page. To learn more about the application discussed in this blog, visit AndrewBladon’s QtWeatherApp GitHub repository.


Article Discussion: