ArcGIS Image Analyst, the ArcGIS Pro extension that provides tools for advanced image visualization, exploitation, and geospatial analysis, now features expanded deep learning capabilities, image classification capabilities, enhanced support for multidimensional data, improved motion imagery capabilities, and much more.
Below, take a tour of the new features we added to help streamline your workflows.
Deep Learning
Deep learning is transforming the speed at which you gain intelligence from imagery.
One of the most notable enhancements to deep learning is the introduction of the new deep learning installer, which significantly simplifies the process of installing deep learning frameworks.
In addition to the models previously supported in ArcGIS Pro 2.5, you can now perform inferencing using 3 new models – YOLOv3, FasterRCNN and DeepLab.
For more on deep learning models in ArcGIS, check out this blog.
Additionally, we’ve made it possible to retrain your entire model architecture, so your models can adapt to your training samples. This works through the new Freeze Model parameter added to the Train Deep Learning Model tool. Freeze Model allows you to unfreeze the backbone layers in the pretrained model so the weights and biases can be altered.
There are also new Backbone Model options, including ResNet, DenseNet, and VGG network. These are well known model architectures providing you with more options to train or refine your deep learning models.
Feature attachments and images in a folder are now supported as an input to the export training and the inferencing geoprocessing tools.
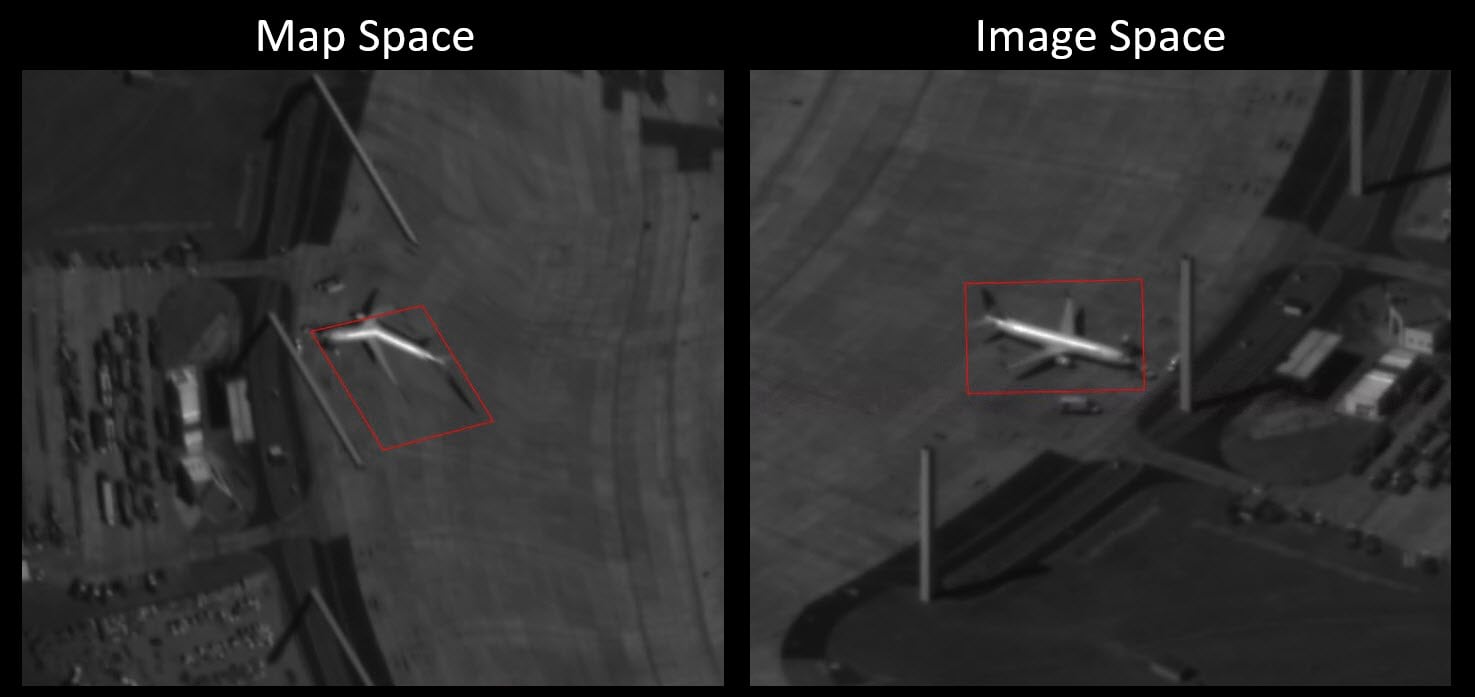
Lastly, to enable better support for working with imagery in image space, the Export Training Data For Deep Learning and inferencing geoprocessing tools allow you work in pixel space (in addition to map space). This helps remove distortion caused by orthorectification or terrain corrections.
Segmentation and Classification
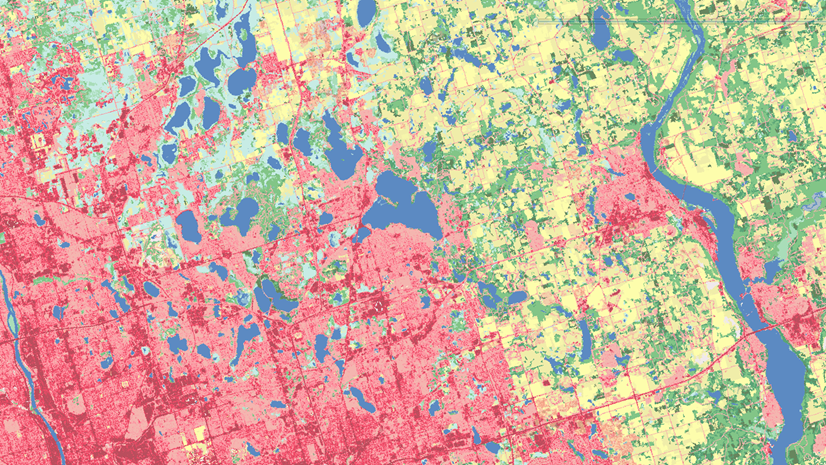
Segmentation is a key component of the object-based classification workflow. The process groups neighboring pixels together that are similar in color and have certain shape characteristics. In this release, supervised classification training tools now support multidimensional rasters. The 3 classifiers (maximum likelihood, random trees, and support vector machine) can be used in conjunction with the updated Training Samples Manager to train a classification model using a multidimensional raster or mosaic dataset with time series data. Additionally, the Segment Mean Shift tool has a new parameter for limiting the maximum allowed segment size. This is especially useful when working with large areas like open fields or water bodies.
Multidimensional Management, Processing and Analysis
New tools and capabilities for multidimensional analysis allow you to manage subsets of a multidimensional raster, perform time series change detection, and calculate trends in your data. Enhancements were also made to improve the accuracy of certain multidimensional analyses.
New geoprocessing tools for change detection workflows
To support continuous change detection over time, the Multidimensional Analysis toolset has expanded in capabilities.
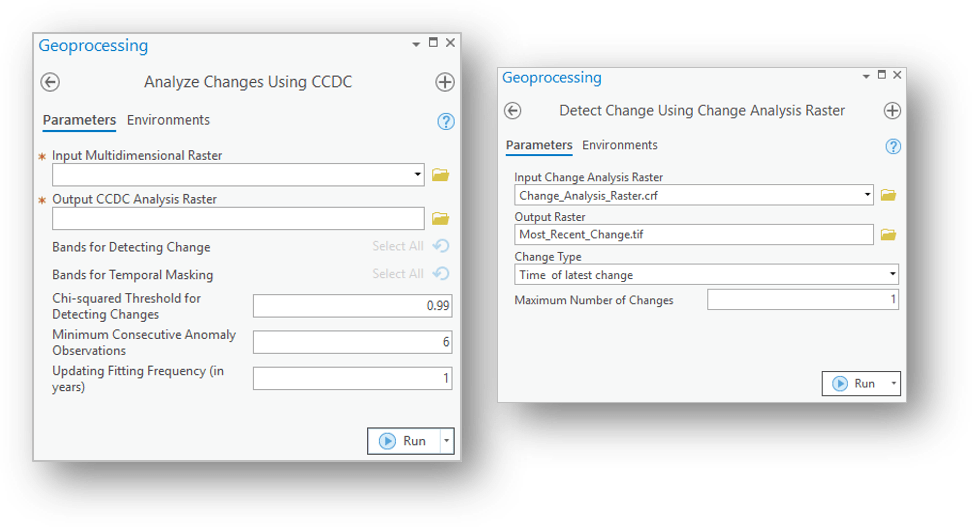
The Analyze Changes Using CCDC tool uses the Continuous Change Detection and Classification method to evaluate pixel changes over time and generate model results. The CCDC algorithm works best with analysis ready Landsat data. This particular tool is an input into the next tool.
The Detect Change Using Change Analysis Raster tool detects change for a time series of images. This uses the CCDC algorithm to identify abrupt change while accounting for gradual and seasonal change. The tools quantify change and identify properties about the time at which the change occurred. The tool is also used to classify time series data effectively or to detect and identify the most recent change, the earliest change, the largest change or, the number of change slices.
These tools can be instrumental in detecting long term change such as urbanization, identifying when an illegal deforestation event began, and understanding mine reclamation patterns.
Both tools are available as raster functions as well.
Enhancements to existing geoprocessing tools for multidimensional analysis
The Generate Multidimensional Anomaly tool, released with ArcGIS Pro 2.5 has been enhanced to allow you to calculate anomalies by comparing pixel values to those provided in an external raster dataset. This could be an external dataset calculated or modeled using a variety of accurate and representative samples from authoritative sources.
New parameters in the Generate Trend Raster tool provide model goodness-of-fit statistics. This lets you evaluate the statistical significance of your the trend model, and judge if it can be used as a trend dataset.
New geoprocessing tools for management
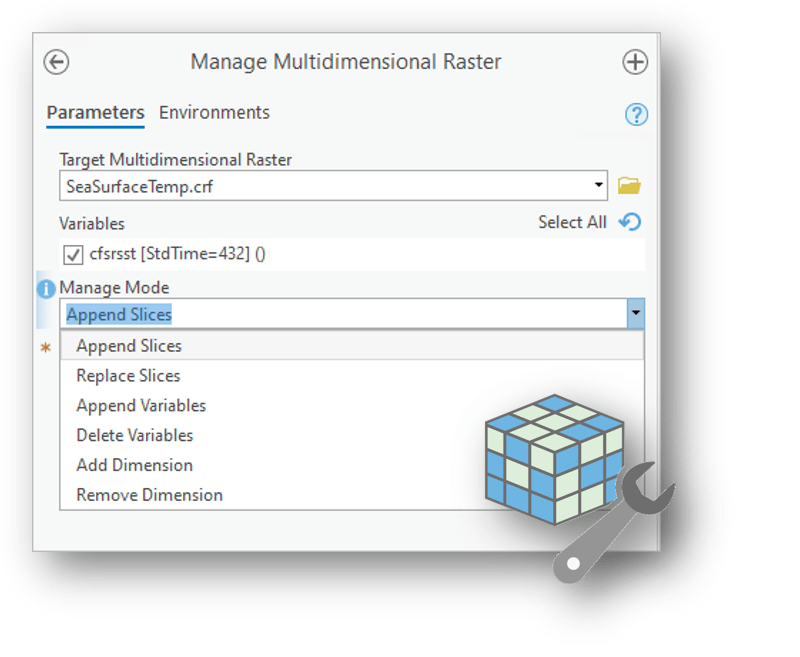
The Manage Multidimensional Raster tool enables you to ‘edit’ a multidimensional CRF (Cloud Raster Format), without having to create a new dataset. You can add or remove dimensions and variables. The ability to append slices or replace slices makes the tool very powerful and convenient when working with multidimensional data that must be updated at regular intervals. Example – multidimensional climate data that is updated every 3 hours.
Here’s a blog with more information on the multidimensional tools in this release.
Additionally, Multidimensional dataset properties such as variable names, descriptions, units and the presence of a color map can be updated through the dataset properties in the catalog pane.
Raster functions
Raster functions are operations that apply processing directly to the pixels of imagery and raster datasets, as opposed to geoprocessing tools, which write out a new raster to disk. With this release, we’ve added new raster functions that support change detection workflows. In addition to the two raster functions supporting CCDC, the Compute Change function has been added. This function takes two rasters, and computes the absolute difference, percent difference or categorical change between the two. It’s used when you know there’s change in a location – and you want to quantify the change.
For categorical changes, it generates a layer depicting all areas that changed from one class to another.

Motion Imagery
This release includes enhancements to our motion imagery support, so you can better manage and interactively use video with embedded geospatial metadata. Now, as an analyst you can work with geospatially aware video coming from a livestream. You can quickly capture video clips into memory for rapid review using the Record Segments tool, or you can save the video files to disk with the Record Video tool.
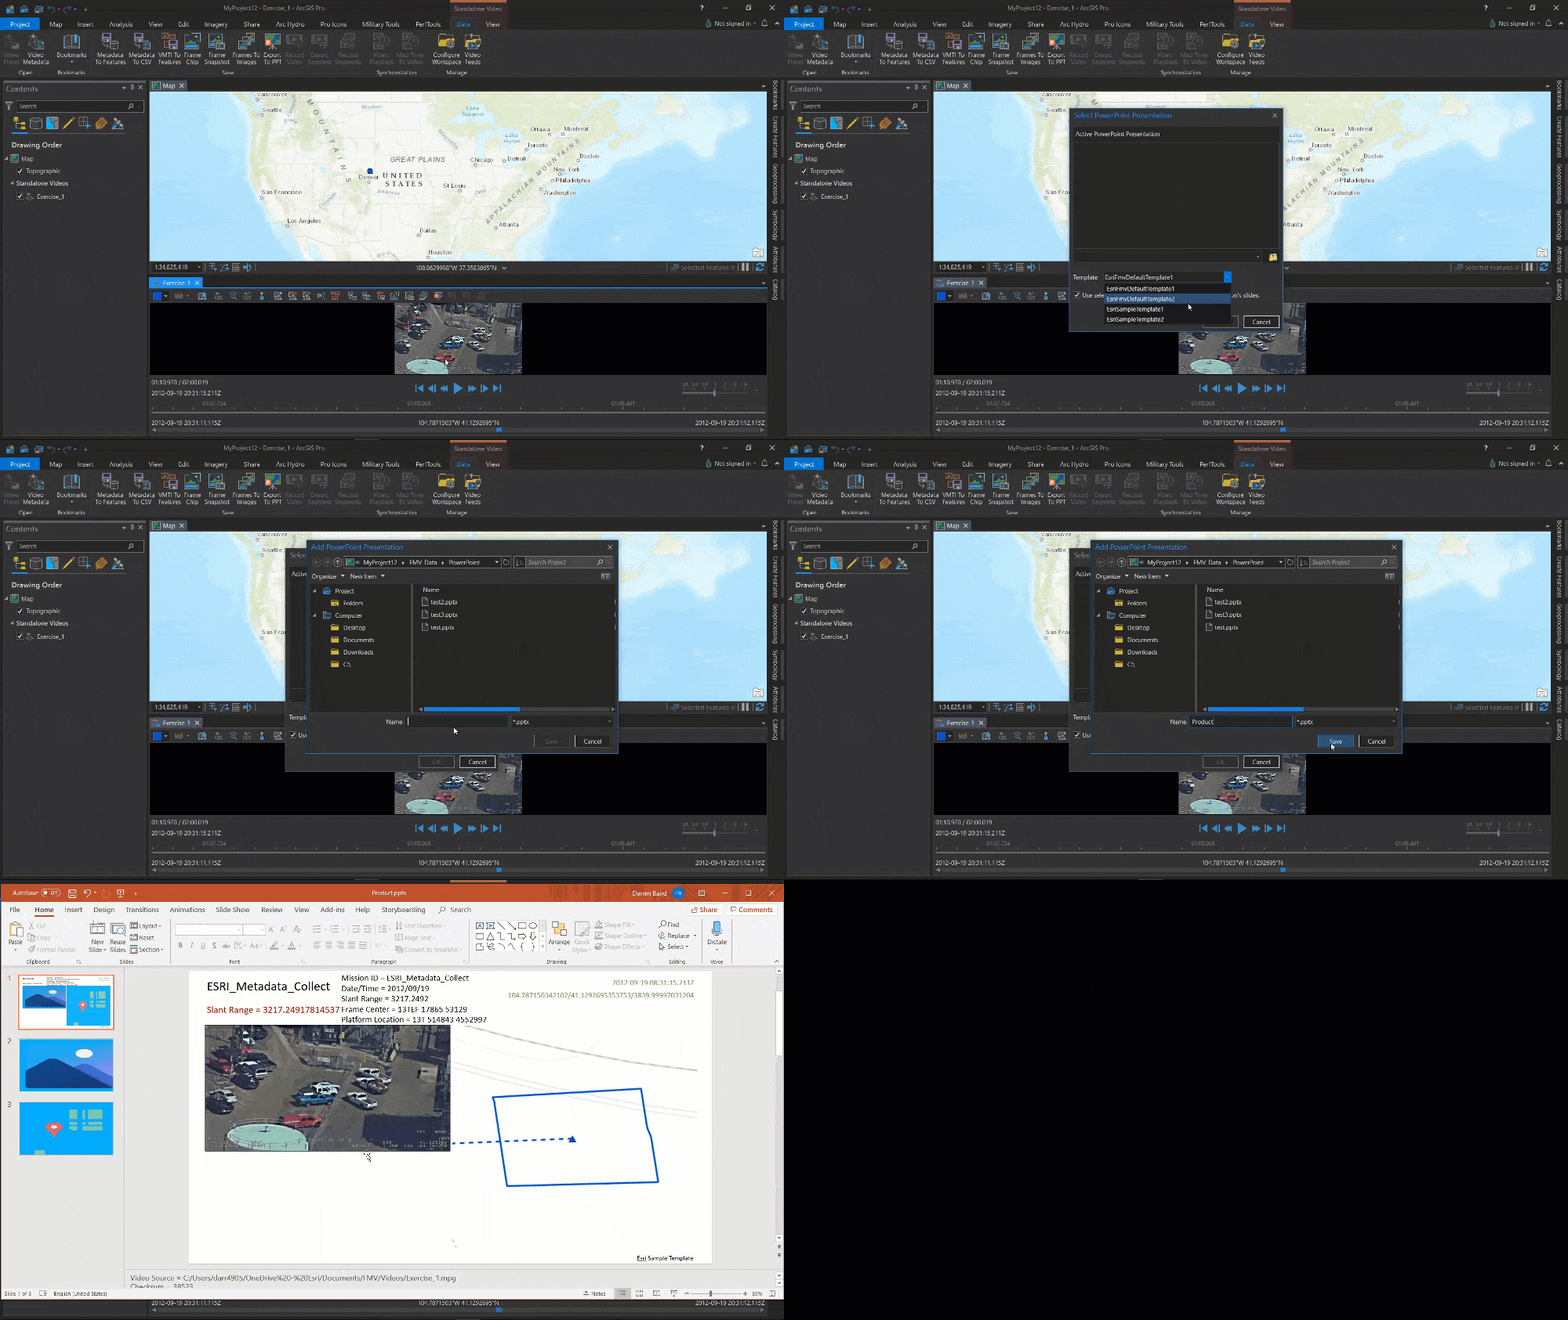
Improved bookmarking capabilities with the Metadata Timestamp tool and keyboard shortcuts make it faster than ever to review and exploit video in ArcGIS Pro, this includes following videos on the map, extracting image frames, creating Microsoft PowerPoint briefing slides, and more.
Other honorable mentions
Here are a few more enhancements which contributed towards improved usability, discoverability and/or functionality of existing tools.
- You can now change the size and color of the stereo cursor in the stereo map view. You can also control the Z sensitivity of the cursor.
- New parameters added to the Generate Trend function. The tool previously worked for data spanning over yearly intervals. New parameters enable you to work with data that are under or beyond the one-year cycle. Additional parameters are included for accuracy assessment.
- The new Trend to RGB function converts a trend raster from the Generate Trend function or the CCDC Analysis function into an RGB raster layer. This was done to improve visualization of the resultant trend raster.
- The Linear Spectral Unmixing function now supports multidimensional raster layers.
- The Zonal Statistics as Table and Zonal Statistics tool support multidimensional datasets now and are available in the Statistical toolset of the Image Analyst toolbox.
- The Sample tool is now available in the Extraction toolset of the Image Analyst toolbox. In addition, the Sample tool includes a new parameter for producing an output feature class. It allows you to visualize the result as features on a map.
Ready to give these new capabilities a try?
Check out these resources to get you started:
- Learn more about the ArcGIS Image Analyst extension for ArcGIS Pro and how to get it
- See what’s new in ArcGIS Pro 2.6
- Learn how to use ArcGIS Image Analyst, including hands-on tutorials
- Check out help documentation for ArcGIS Image Analyst





Article Discussion: