By Patrick Bergeron, postdoctoral fellow, INSPQ and Univerisité de Sherbrooke, Canada.
Temporal floodplain delineation is an important aspect of many urban and environmental management plans. Water height data, measured under bridges or at gauge stations, are common and usually free. However, the extent of flooding associated with these variations in water height are much more difficult to obtain.
Using GIS to model temporal variations in flood plain delineation seems rather obvious, but actually doing it often requires the use of other software in order to produce the primary data that can be processed by ArcGIS. Fortunately, there are models available in the Arc Hydro toolbox that now allow you to perform the modelling entirely in ArcGIS.
Modelling floodplain delineation requires a Digital Elevation Model (DEM) of the area on which we add or create a vector of the river and a point location where water height has been measured (see map below: gray = DEM, blue = river, orange = gauge station).
Although the Arc Hydro models can accommodate complex drainage basins and multiple gauge stations, I will focus here on a simple 1-river/1-gauge station system.
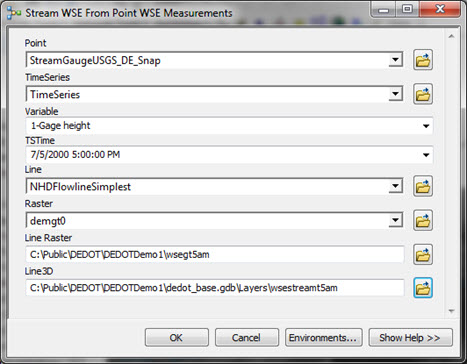
 The overall data processing consists of 18 steps, all available in the Arc Hydro toolbox. The input data and specifically stage data that are used by the models have to be stored in standard Arc Hydro time series data structure. The 18 steps are regrouped into two models. The first model is ‘Stream WSE from point WSE Measurements.’ This model consists of several input files: the point location of the gauge, a table containing water height, a vector of the stream and a DEM raster of the area. It is important that the DEM is adjusted so that it doesn’t contain negative values. The gauge point has to be snapped on the river vector and also has to be assigned a HydroID (in Arc Hydro tools → Attribute tools → ID Management) that matched the ID in the water height table. There should also be a simple ‘VariableDefinition’ table. This model will create two temporary output files: a line raster file included in the folder containing the geodatabase and a Line3D file within the geodatabase.

The second model ‘Flood from stream WSE,’ produces a raster and a polygon of the flooded area. The target raster location workplace is the folder containing the geodatabase while the target vector location workspace is within the geodatabase. Leave the default ‘Layers’ for the target feature dataset, the other inputs are rather straightforward to fill.
This second model will produce a very precise map of the flooded area both as a raster of water depth in the floodplain and as a polygon feature of the flooded area.
Now, it is only a matter of running these two models for different water heights in order to get a comprehensive understanding of where and for how long areas have been or could be affected by floods. In my case, I am relating the exposure to flood to public health issues. I overlaid the flood depth raster file generated by the models (below on the left) to a city map (below, on the right: orange = river bed).
The actual flood in our area lasted five weeks but aerial photographs documented the flood extent only sporadically, yet a gauge station was monitoring water height every hour. By modelling the flood with the readings at the gauge station and Arc Hydro models, we were able to reconstruct flood extent on a daily basis. Most importantly, the Arc Hydro model matched very accurately actual aerial photographs of the floodplain.
For more information about the time series table structure read this blog on GeoNet


Article Discussion: