We’re excited to share details about the November release update for ArcGIS for Microsoft 365. This release includes new features, enhancements, user interface updates, and bug fixes, all designed to make your work easier and more enjoyable. Whether you’re new to ArcGIS for Microsoft 365 or an experienced user, you’ll find something helpful in this release.
Note: While the release is rolling out globally, some updates may not be immediately available in all regions.
Quick links
- ArcGIS for Excel
- ArcGIS for SharePoint
- ArcGIS for Power BI
- ArcGIS for Teams
- ArcGIS Connectors for Power Automate
- Additional resources

ArcGIS for Excel
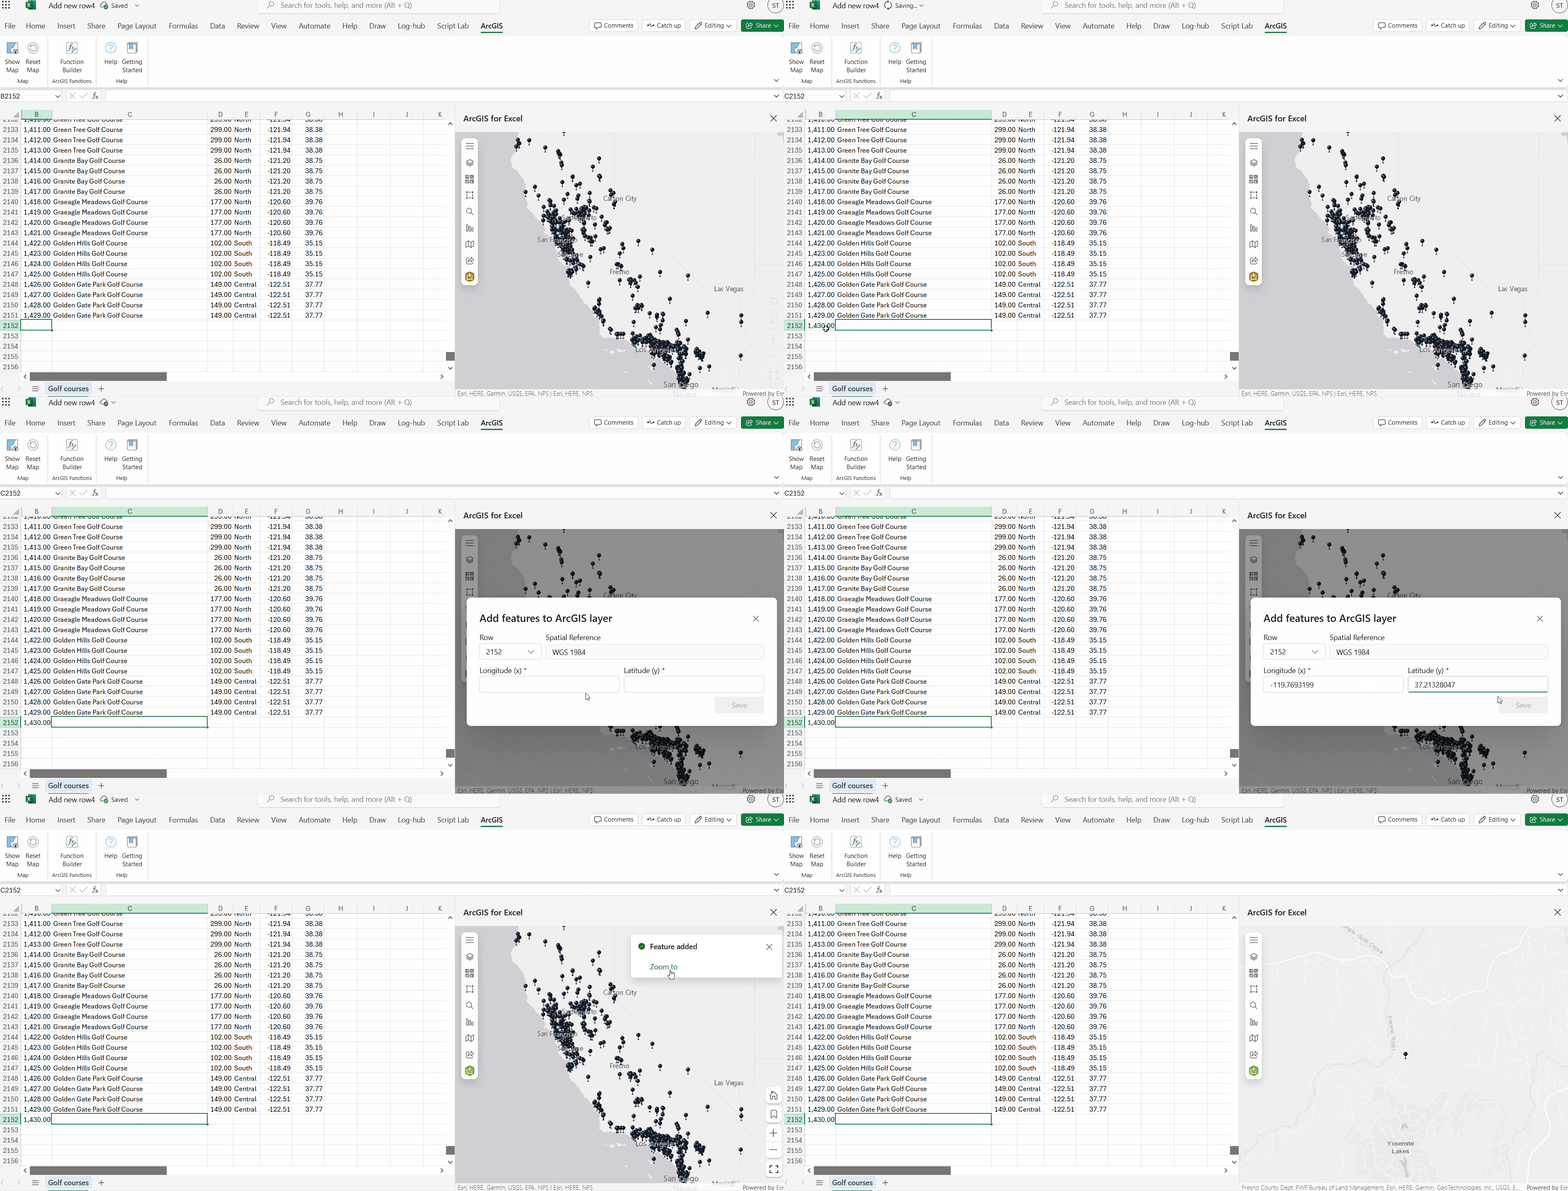
With the November release, you can now add new rows for point data locations right within Excel. No more switching back and forth—just straightforward data entry where you need it, allowing dynamic editing and visualization of spatial data in Excel. As you add new rows, you’ll see point features appear on the ArcGIS for Excel map in real-time and these updates will also be immediately refreshed in ArcGIS.
We also enhance your map visualizations with custom images and custom vector symbols. Now you can change the symbol, color, and other style settings for your map layers, allowing you to create personalized maps that are not only informative but also engaging and appealing.

With the recently improved user interface, you can easily find and use Sync with ArcGIS and Sync with PivotTable buttons on the Map Data tab. This intuitive layout makes it easy to refresh data from ArcGIS feature layers and pivot tables—ensuring that Excel continually displays the most up-to-date information.


ArcGIS for SharePoint
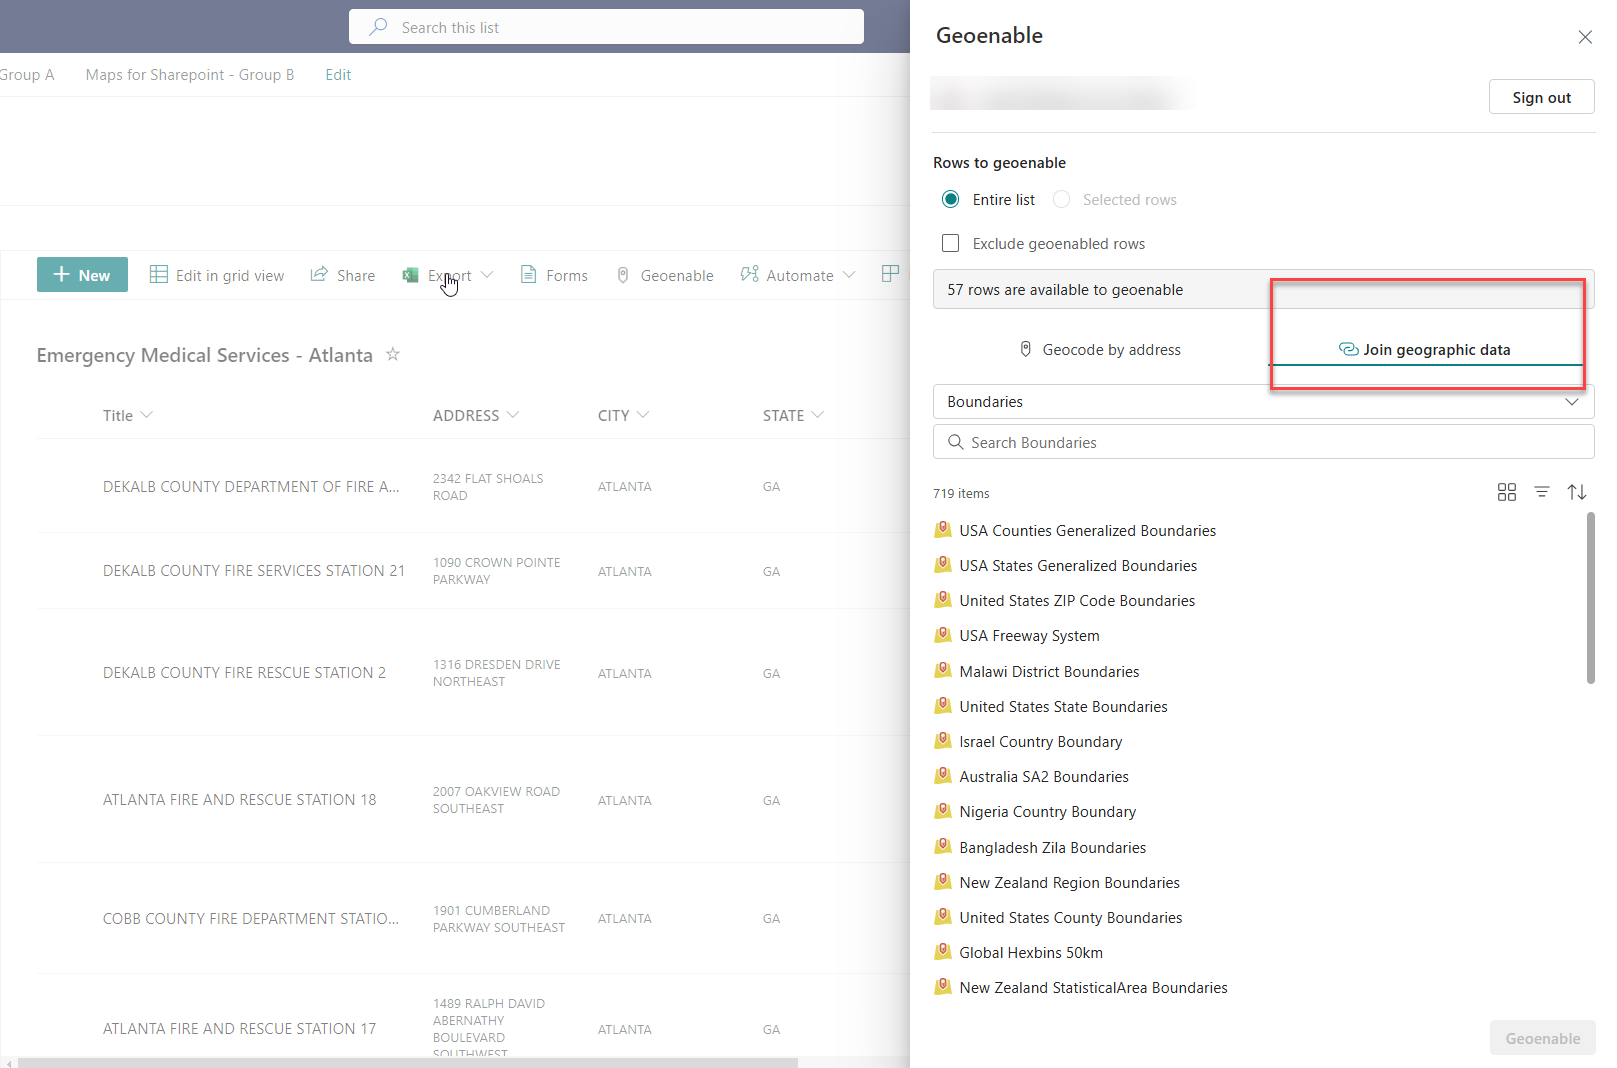
You can now use your organization’s feature layers to geoenable SharePoint data by joining layers— this is similar to functionality in Excel and Power BI. This new capability provides an additional way to visualize geospatial data in SharePoint and enhance data integration between SharePoint and ArcGIS. By joining SharePoint list data with geographic layer data, you can unify disparate datasets, creating a more comprehensive and holistic view of your data.
ArcGIS for SharePoint now provides user notifications about the latest available version of the component. This ensures that you stay up to date with the newest features, enhancements, and bug fixes—helping you make the most of the tool and improving your overall experience.

ArcGIS for Power BI
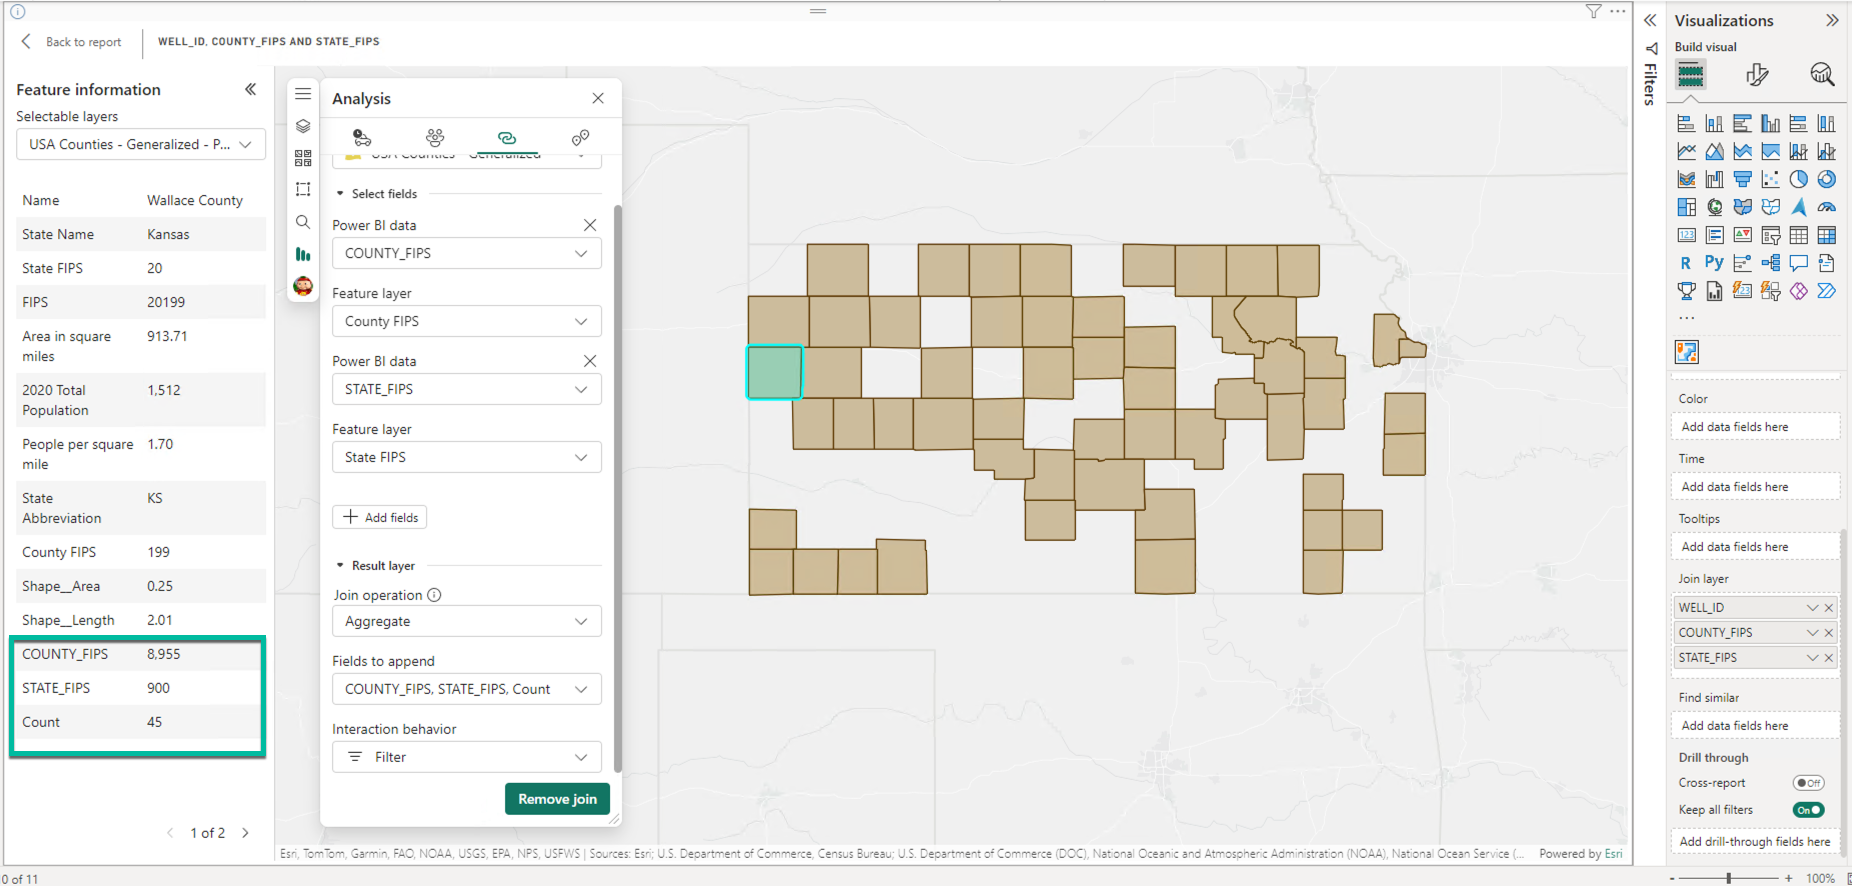
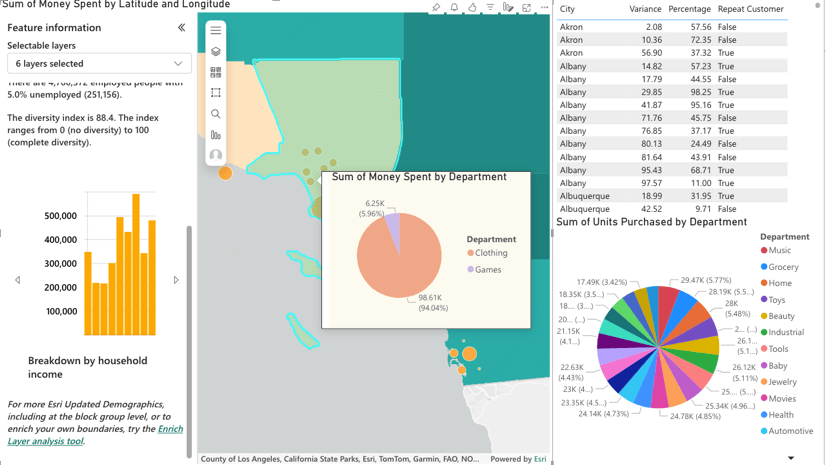
The November release of ArcGIS for Power BI introduces an enhanced Join layer functionality, making it easier for users to connect authoritative ArcGIS layers and business data. This update creates a powerful link between your Power BI data sets, semantic models, and ArcGIS layers, even when your Power BI data lacks a spatial component such as addresses or coordinates. By joining these disparate data sources, you can enrich your visualizations with geographic context, allowing more insightful analysis. The joined layers can be seamlessly connected to other Power BI visualizations, allowing your maps to interact dynamically with other report elements, uncovering previously unseen insights.
Additionally, we’ve added a number of frequently requested capabilities to layer management, such as the ability to add rotation and transparency to features, set a layer’s visible range, and perform other layer style refinements to improve your map layout. ArcGIS for Power BI also includes added ArcGIS layer styling and new layer properties. This allows for map customization, ensuring your maps are both accurate and visually compelling.
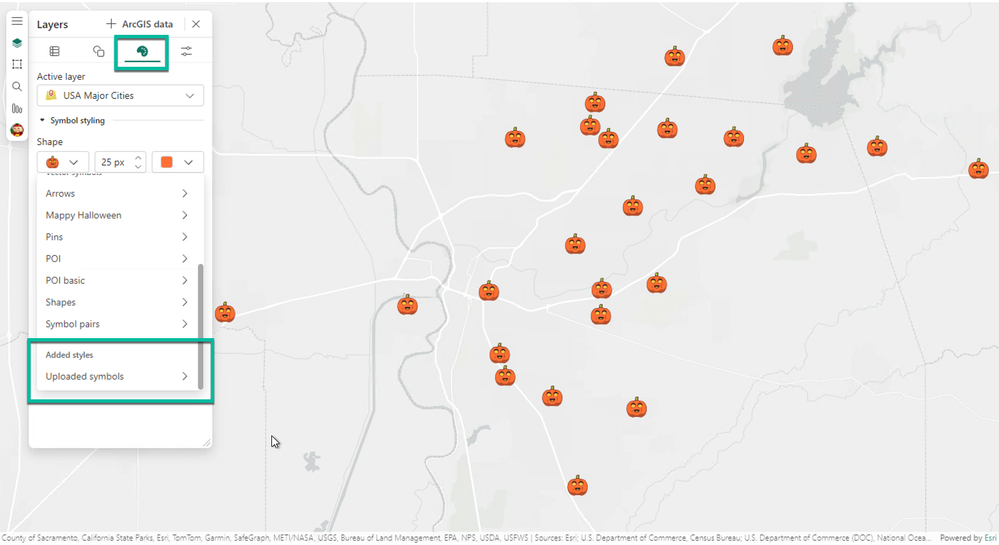
We have exciting update to share regarding map visualizations in Power BI. We’ve added the ability to create your own symbology for features on the map. This improvement allows you to personalize your map visualizations by incorporating symbols that are specific to your brand or project. Whether you need to use company logos, custom icons, or any other unique symbols, you can now seamlessly integrate them into your maps within Power BI reports.

ArcGIS for Teams
With this release, we’ve introduced single sign-on (SSO) that allows you to authenticate and connect your Microsoft identity to your ArcGIS identity. This streamlines the login process and enhances convenience by eliminating the need for multiple logins. With SSO, you can access the Teams tab app, accept the terms of SSO, and the tab app will then be available on any device through Microsoft Entra.
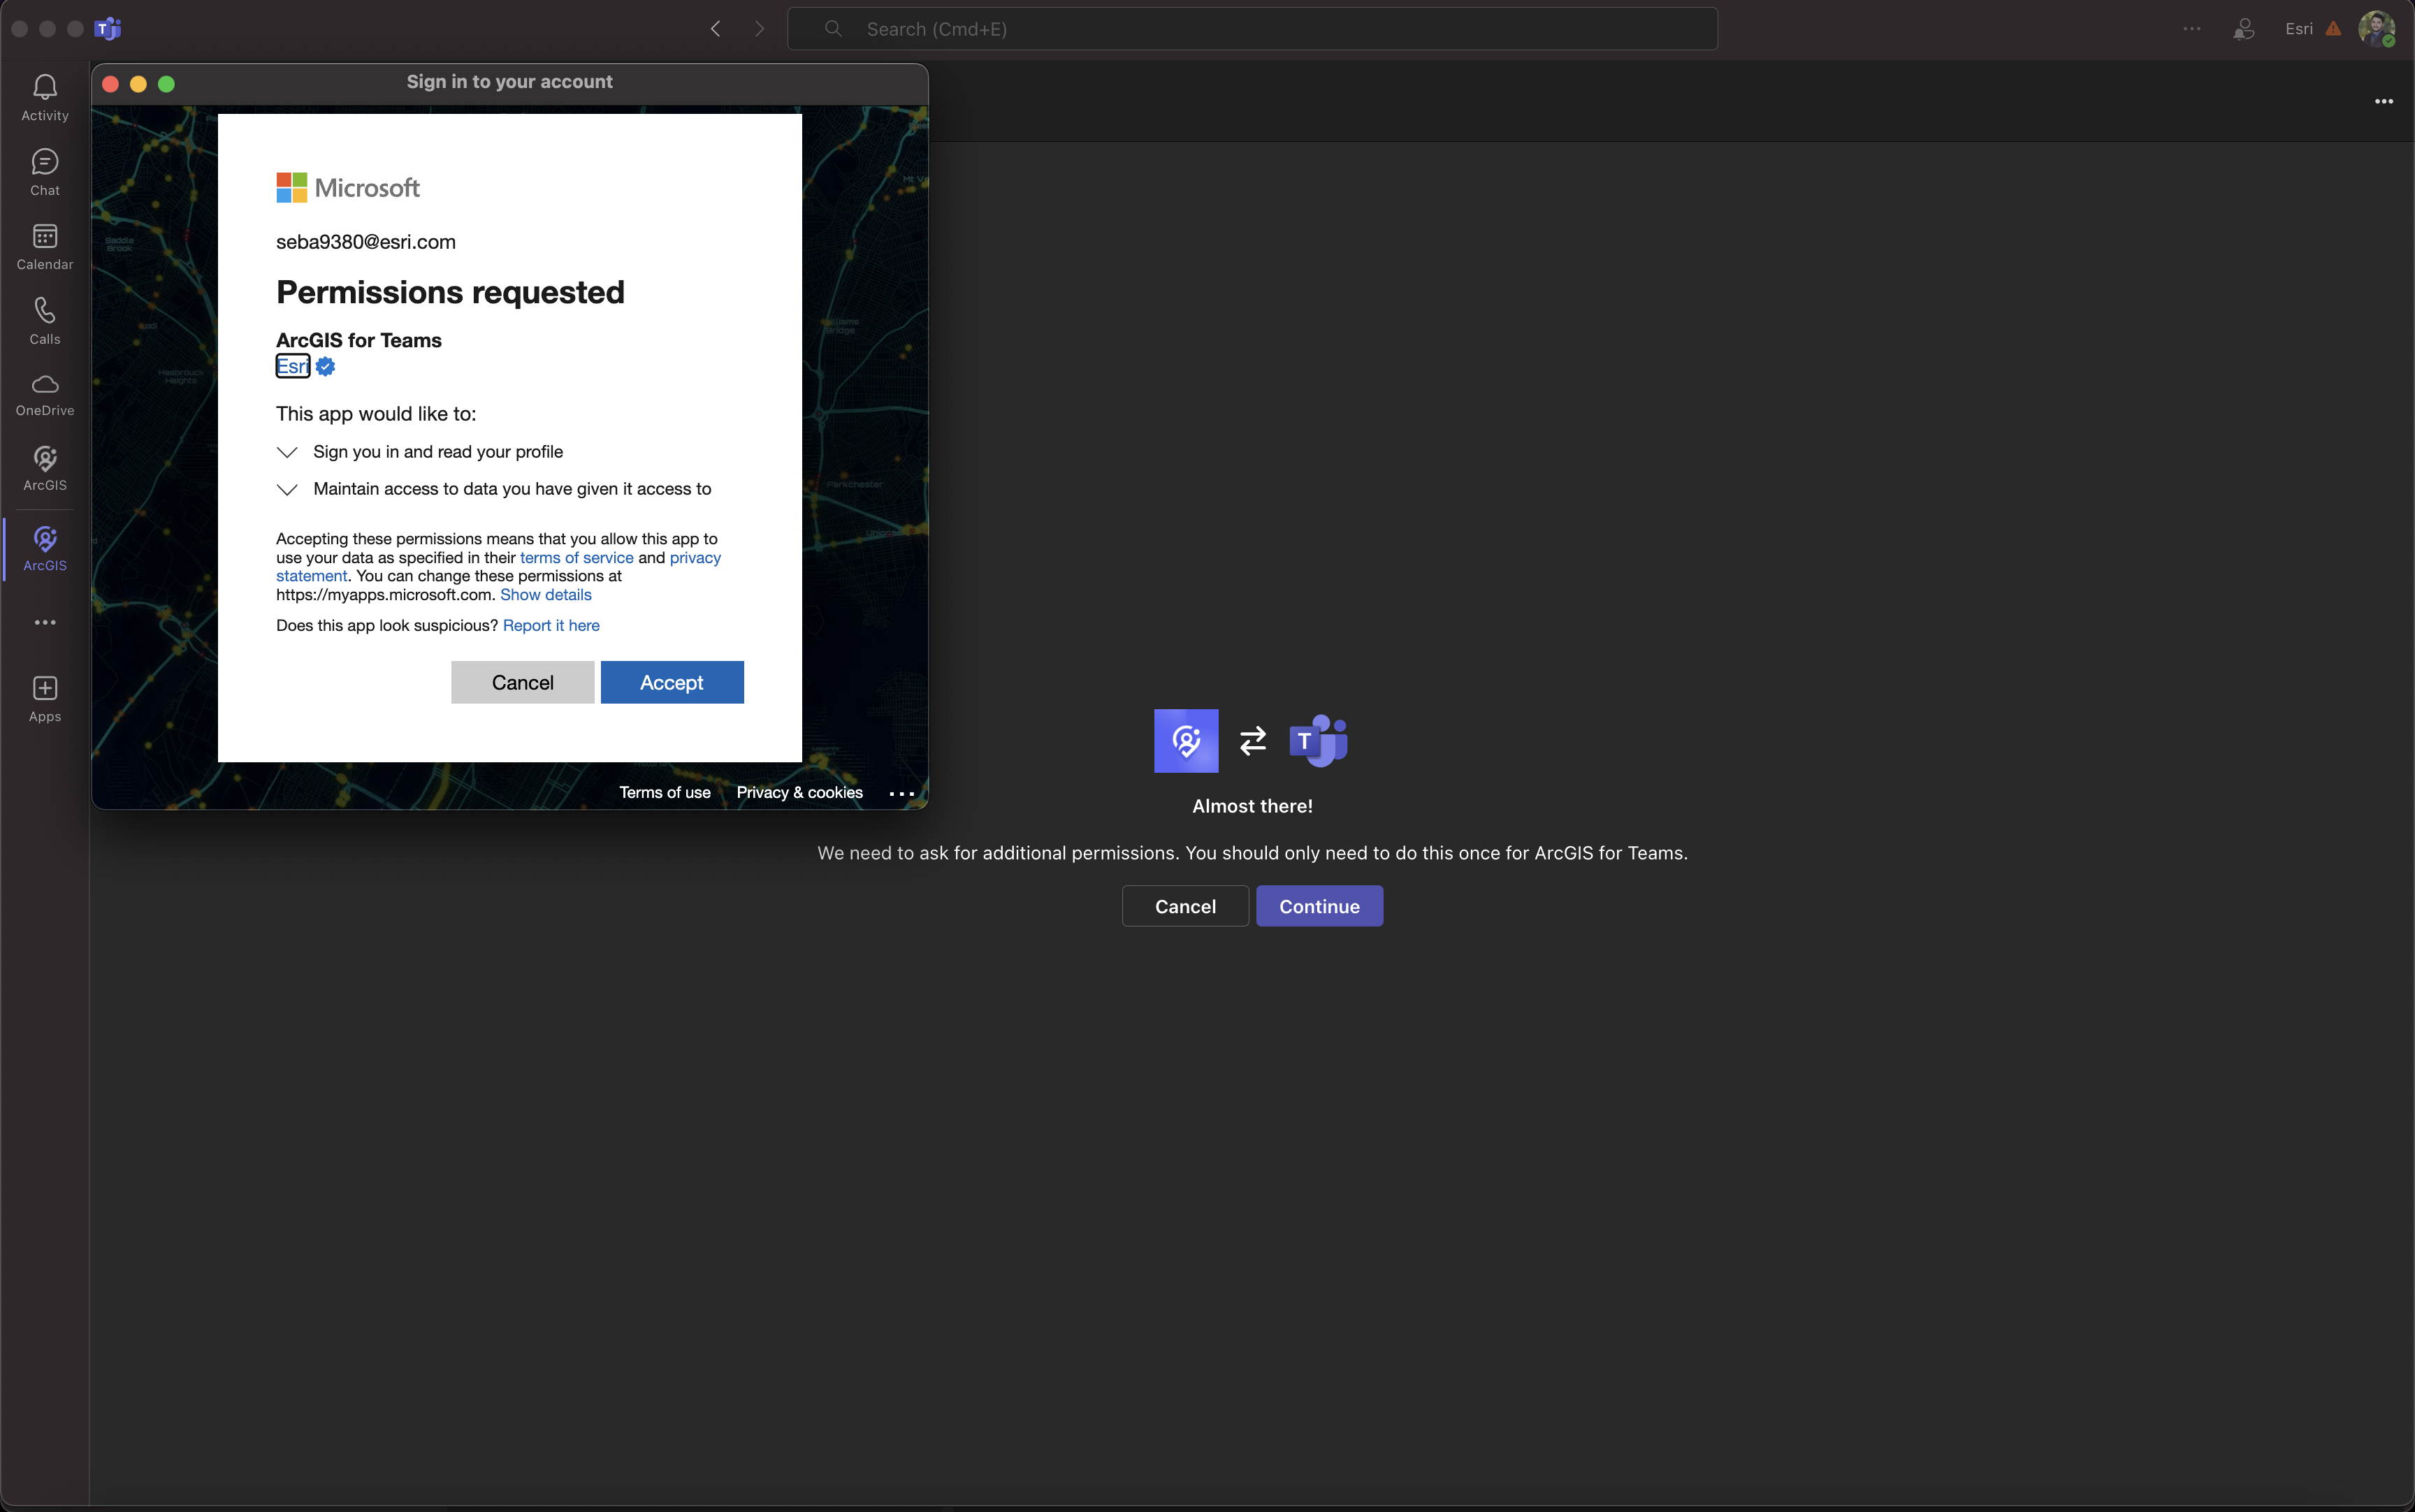
We also have some exciting updates to share about the ArcGIS for Teams Copilot plug-in. We’ve improved semantic descriptions and sample prompts to help you interact more effectively with the ArcGIS for Teams Copilot plug-in. These enhancements include expected values, limits, and ranges, making your ArcGIS for Teams Copilot workflows more intuitive and efficient.
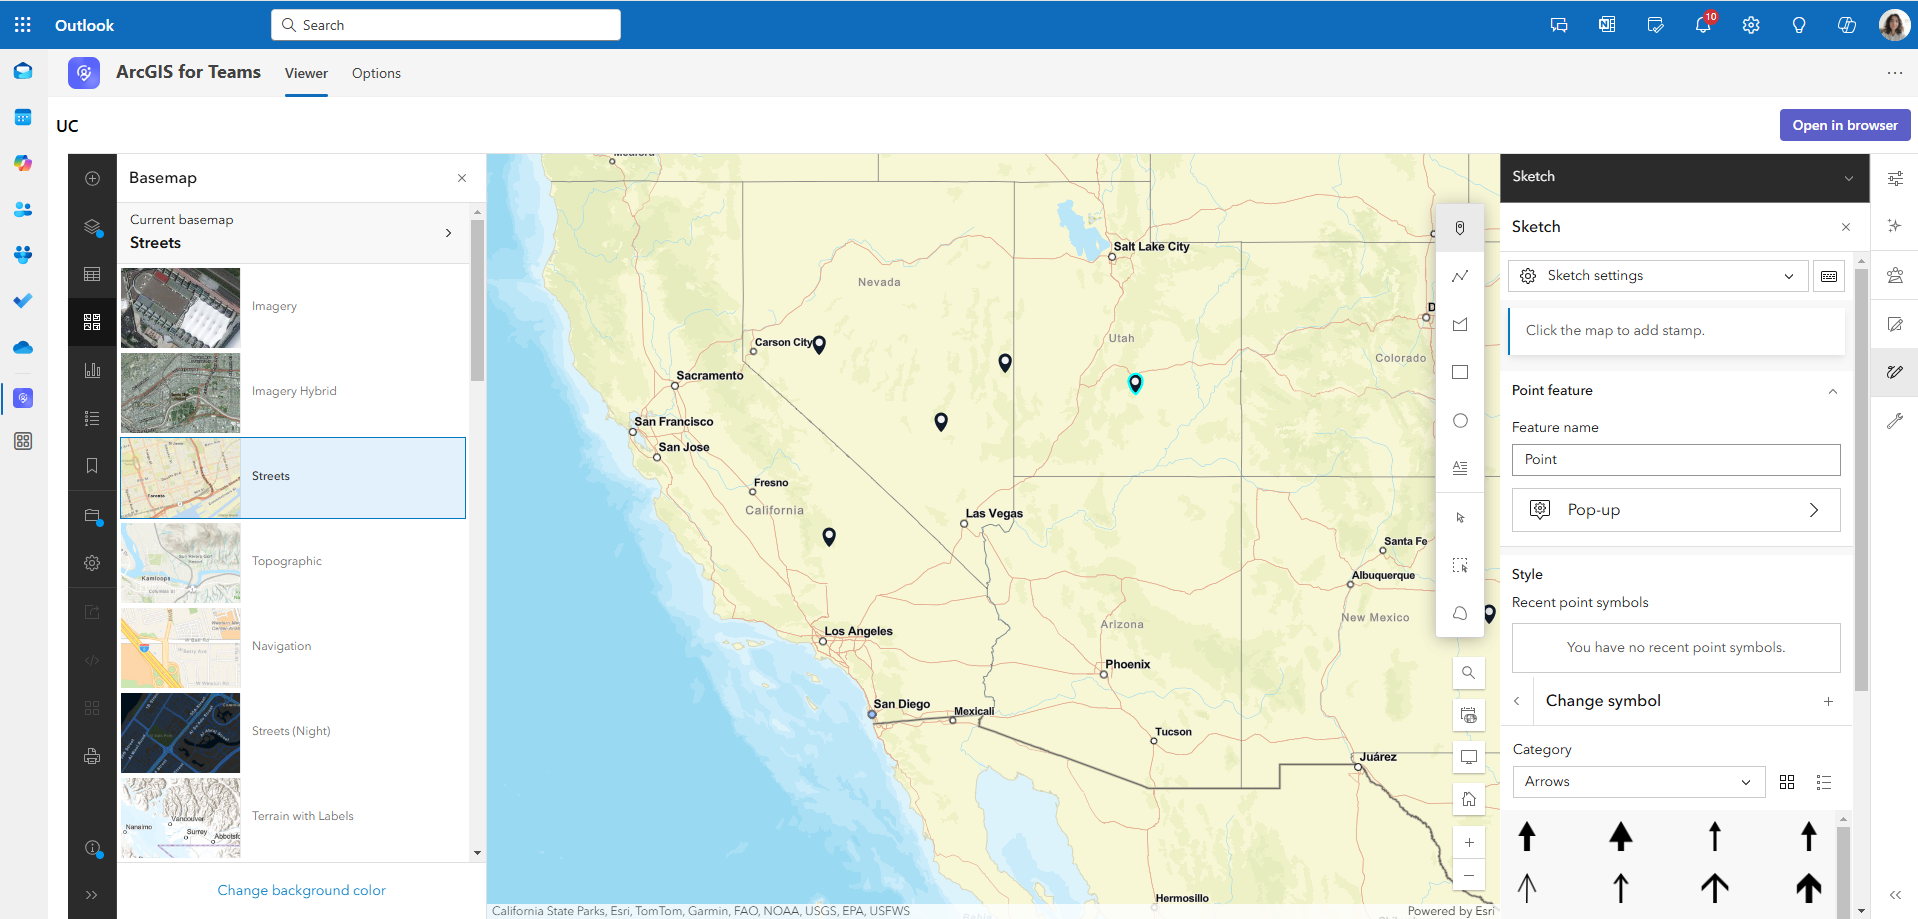
ArcGIS for Teams capabilities are now expanded beyond Teams to other Microsoft 365 application, such as Microsoft Outlook and Microsoft 365 portal pages. This means you can now harness the power of the ArcGIS for Teams search and discovery capabilities directly within these applications. You can search and access spatial content directly within Microsoft 365 apps, eliminating the need to switch to the ArcGIS platform. Within the viewer tab in Outlook and Microsoft 365, you can interact with maps, analyze data, share, and collaborate on spatial data. This not only enhances decision-making but also simplifies collaboration workflows. By using spatial capabilities more broadly, users gain the ability to integrate spatial data seamlessly into their existing workflows, boosting productivity and fostering better collaboration.
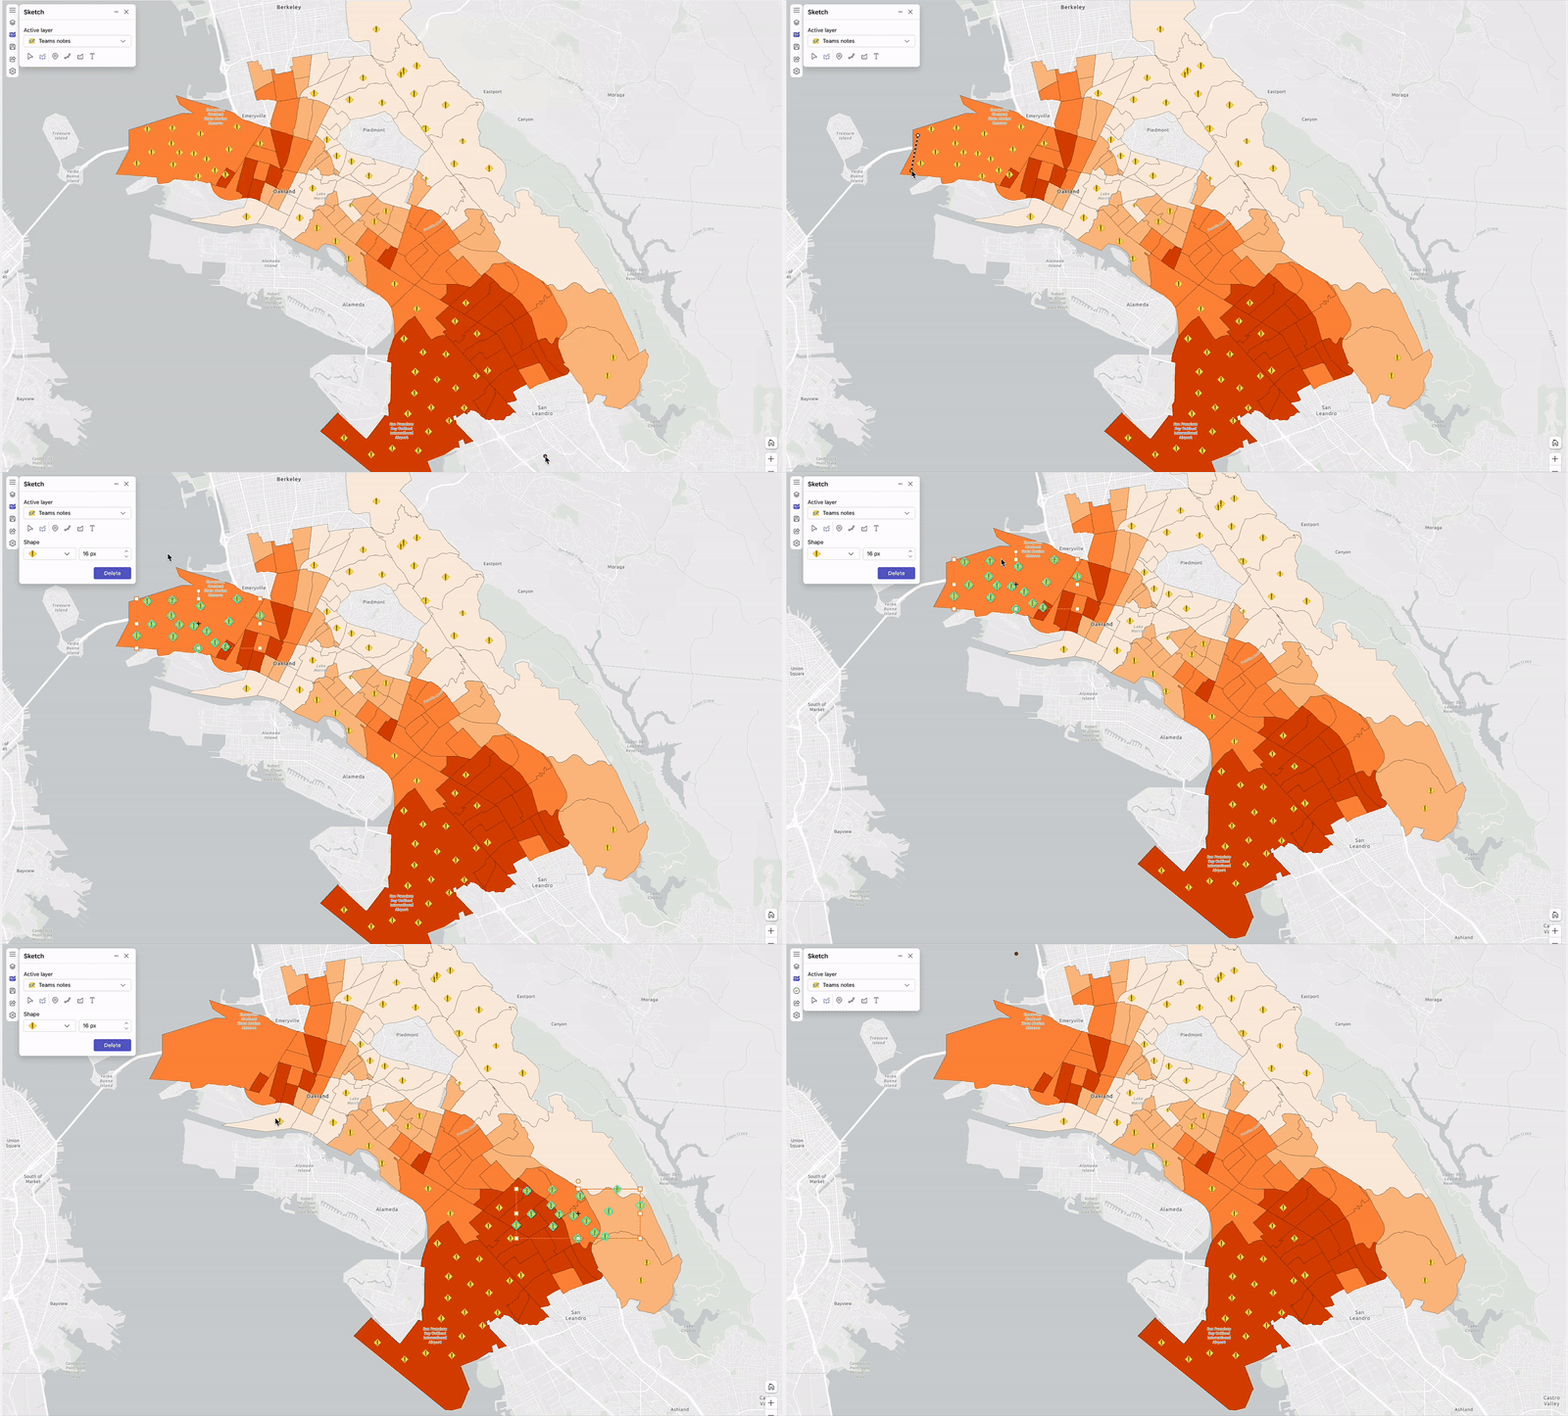
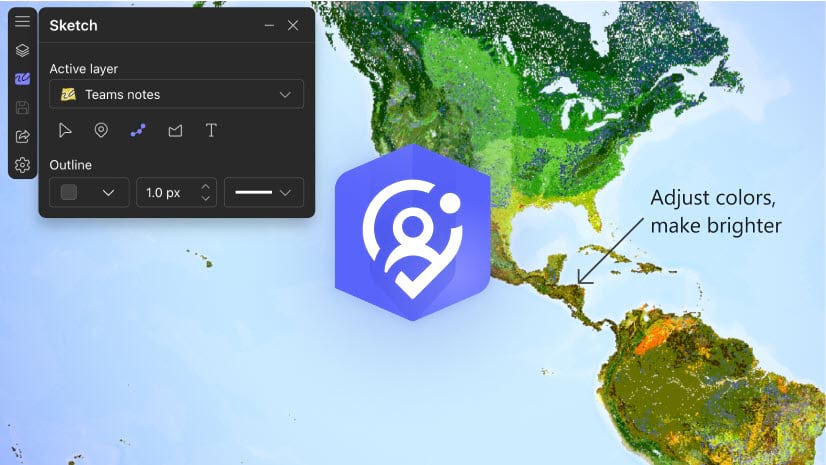
With sketch and annotate, you can now batch delete different sketch types— such as points, lines, polygons, and symbols—during meetings. This allows you to delete all selected items at once, saving you the trouble of deleting them one by one. You can also move items by type, eliminating the need to select them individually. This enhancement gives you greater control over meeting sketches, making your live collaboration sessions more organized and efficient.
Previously, the user ArcGIS item search experience involved typing specific terms and sorting through structured organizational data. With the introduction of generative AI, you can now use more natural language-based prompts to search ArcGIS items. This innovative feature makes the search process more intuitive and user-friendly, helping you to find the information you need more quickly.

ArcGIS Connectors for Power Automate
We’ve introduced a new action that seamlessly integrates with ArcGIS Data Pipelines, enhancing your data management workflows. This feature allows for better automation and management of data tasks, making your data integration more efficient and streamlined.

With our new reverse geocoding action, you can quickly convert x,y coordinates into addresses. This enriches your spatial data with valuable address information, providing deeper insights and enhancing the usability of your datasets. Whether you’re working on location-based analytics or need to communicate spatial data to stakeholders, this feature ensures that your data is both accurate and meaningful.

We’ve added an action that allows you to extract coded value domains from feature layers. This means you can now use human-readable values instead of code in other systems or reports, significantly improving data readability and usability for you and your team. By converting code into understandable terms, you can reduce errors, improve communication, and make your data more accessible to a wider audience.

The latest update supports batch handling for adding or updating records in a feature layer. This feature improves efficiency by reducing the number of connections and minimizing potential throttling issues in Power Automate. You can eliminate the inefficiency of slow, individual record updates and adopt a streamlined, efficient batch processing approach. This not only saves time but also ensures that your data is updated quickly and accurately, keeping your systems running smoothly.


Additional resources
Visit the video site, product page, and online user guide to learn more about ArcGIS for Microsoft 365. Or join our Esri Community to connect with GIS experts, read the latest change logs and blog articles, get peer-to-peer feedback, and find answers to software questions for each component:






Article Discussion: