A series of maps provide unparalleled, simplified access to detailed analyses of the protected areas of the United States. These layers are an important component in any conservation or land-use planning effort.
We all know birds fly south for the winter. But how do we make sure there is food and drink for them on the journey?
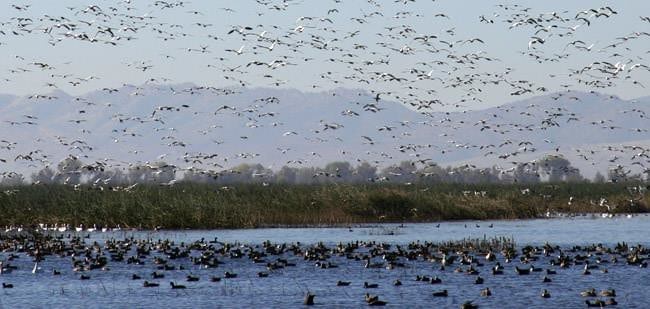
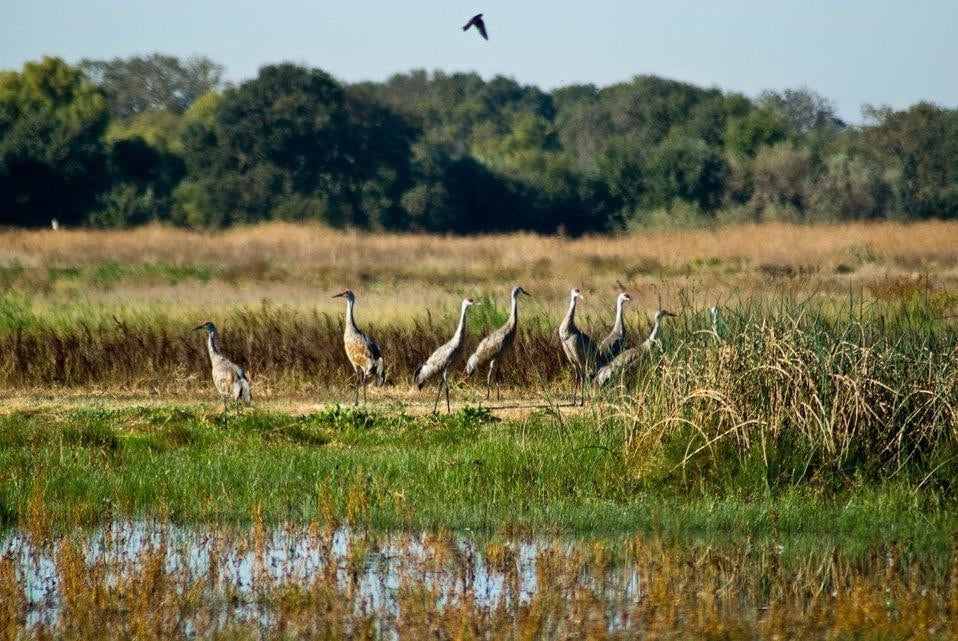
The US Fish and Wildlife Service, among other agencies, non-profit, and non-government organizations, has been securing habitat for migratory fowl to meet US international obligations.
Every year a billion birds migrate north to south and then north again using the Pacific states of the United States, Canada, and Mexico. A billion is a high number, but before the Anthropocene era, the numbers were much higher, numbering many billions.
This decline in both the numbers and habitats for thousands of species across the country is one reason why it is important to accurately map the areas needed for conservation and to incorporate that data into spatial planning. For migratory birds, it could be a series of watering holes along the known migratory paths. To simplify access to this information, the U.S. Geological Survey has provided GIS-ready versions of their newly updated and authoritative Protected Areas Database of the United States (PAD-US) through ArcGIS Living Atlas of the World.
A New Set of Maps and Layers
With over 3.4 billion acres in over 350,000 different areas, PAD-US version 2.0 is a significant improvement in comprehensiveness and data quality. To make displaying and analyzing this data even easier, PADUS 2.0 is available in multiple formats within Living Atlas:
- Vector tiles: for fast rendering in web maps and applications where analysis is not required
- Feature services: provides attributes for the 30 fields associated with each protected area. Using feature layer views and web maps, there are unique, pre-configured displays of these maps from many of the fields.
- Image services: provides single attribute raster versions of the database for running large-scale summary statistics, raster functions, and habitat modeling.
Exploring PAD-US
Take a look at this map to see what lands are protected in southeastern Oregon near the town of Lakeview – a common migratory habitat. Many of these areas are at GAP status level 2 or 3, meaning that the area is managed for biodiversity, but either natural disturbance events are suppressed (GAP 2) or limited resource extraction (GAP 3), such as logging, is permitted.
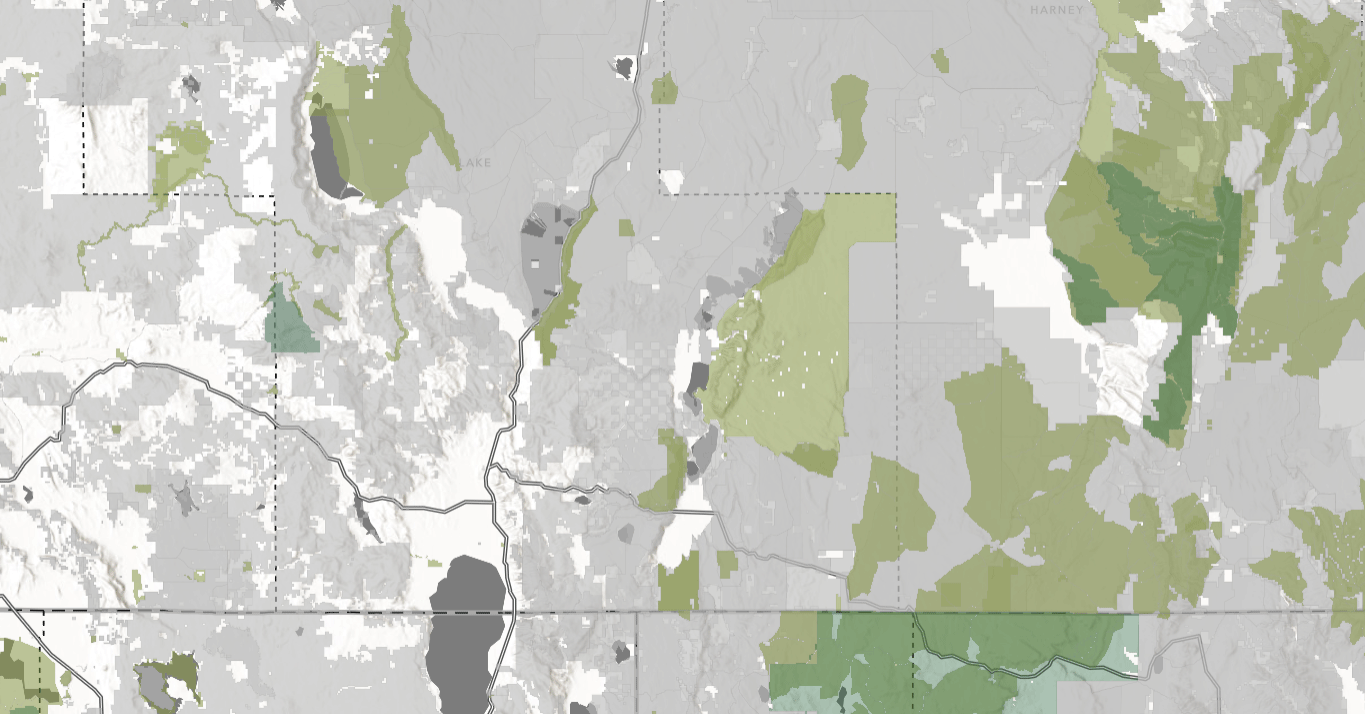
Who is protecting these areas? To see who oversees managing the resources in this area, look at this map which shows they type of manager. Are they state? Federal? Local?
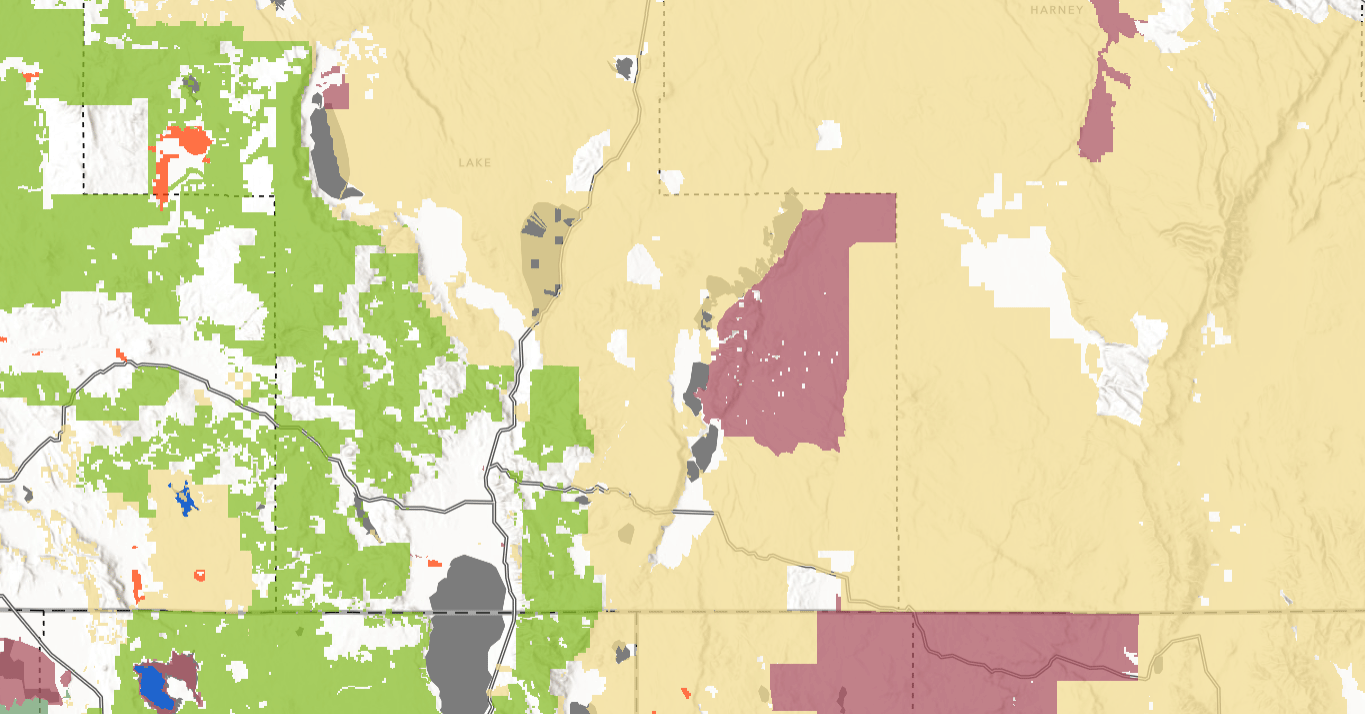
Maybe you need to display or analyze the owners by their unit name rather than agency. These categories are further broken down in another service, by the name of each manager.
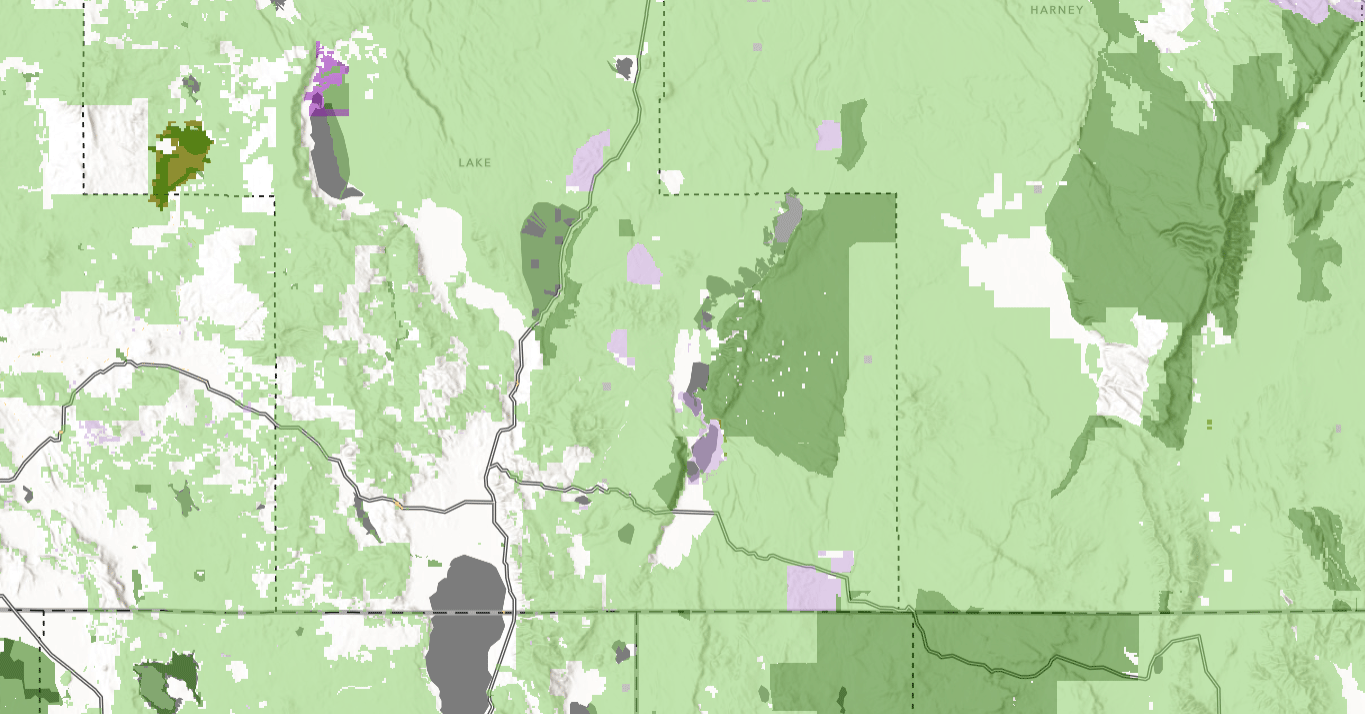
Lands are protected using one of many legal instruments. Probably the best-known way to protect a piece of land is to buy it outright. But sometimes conservation easements are negotiated from an existing landowner, or special management designations are agreed upon by the managing agency. Use this map to identify how each area is being protected.
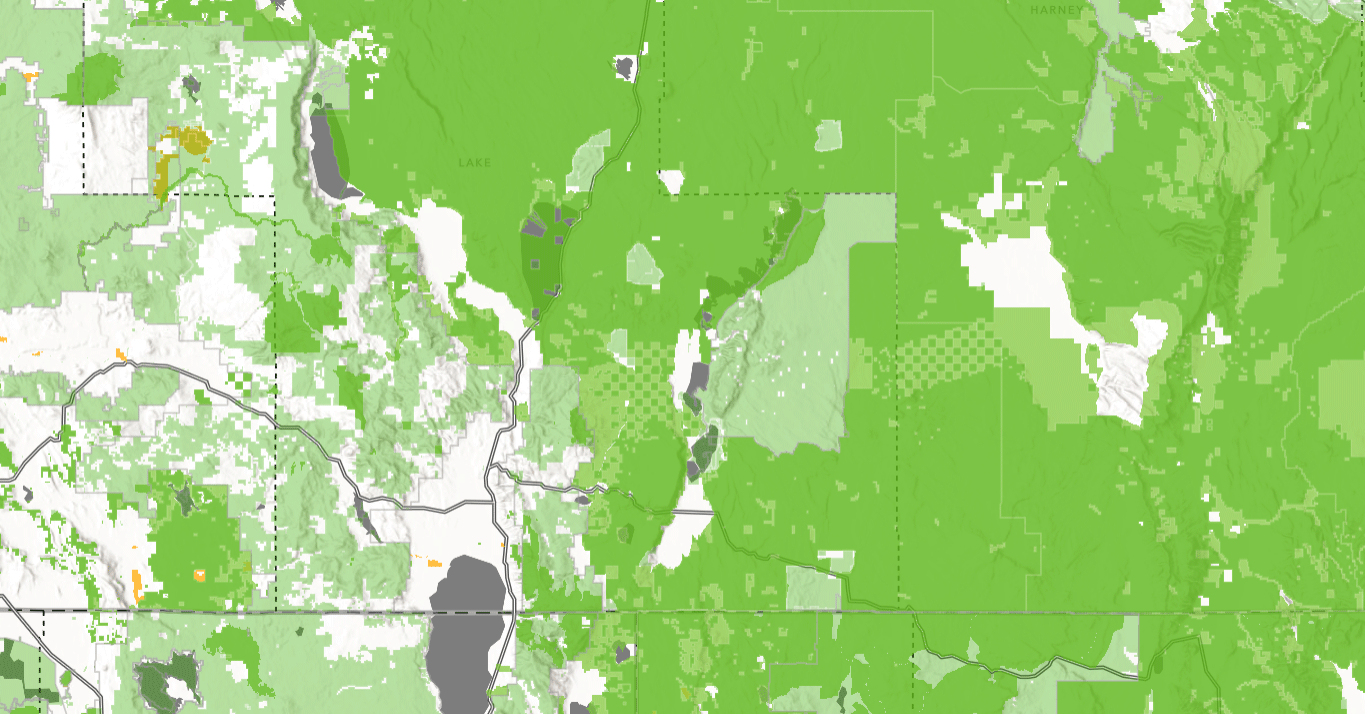
These series of maps should provide a wide range of functionality, whether they’re for creating beautiful maps with the vector tiles, doing spatial joins and intersections with the feature views, or analyzing and summarizing large areas using the image services.
For questions of comments about this blog, please visit our GeoNet.


Commenting is not enabled for this article.