Note: If you are using Calcite components in your app, an upgrade to Calcite version 3.0.3+ is required with this release.
Version 4.32 is out and is packed with new features and enhancements to improve the mapping and analysis experience in your apps. From display filters for optimized filtering of large datasets to the ability to drag route stops in the Directions component, multiple highlights within a single layer for visual emphasis, Arcade’s access to the view’s current time window, and a lot more. Read on to learn about the release!
Build apps using components
Our recommendation, moving forward, is that new apps built with the SDK should utilize web components. With this release, you will see a lot of progress with our transition to components within the SDK website. There are new and updated resources teaching best practices, and the component API reference is integrated into the SDK documentation. Component pages include a sample playground allowing you to tweak the configuration and see the corresponding code.
The core functionality of widgets is already available as components. Initially, widgets are wrapped within web components. Over time, we are incrementally refactoring them to not include the preexisting widget architecture and further embrace web component standards. For example, style encapsulation via the shadowDOM. Once a component has undergone this optimization, the corresponding widget is deprecated. This release includes 12 components that meet this criteria, and 12 corresponding widgets that are now deprecated. See Esri’s move to web components for more information about the widget transition period and future.
Display Filters
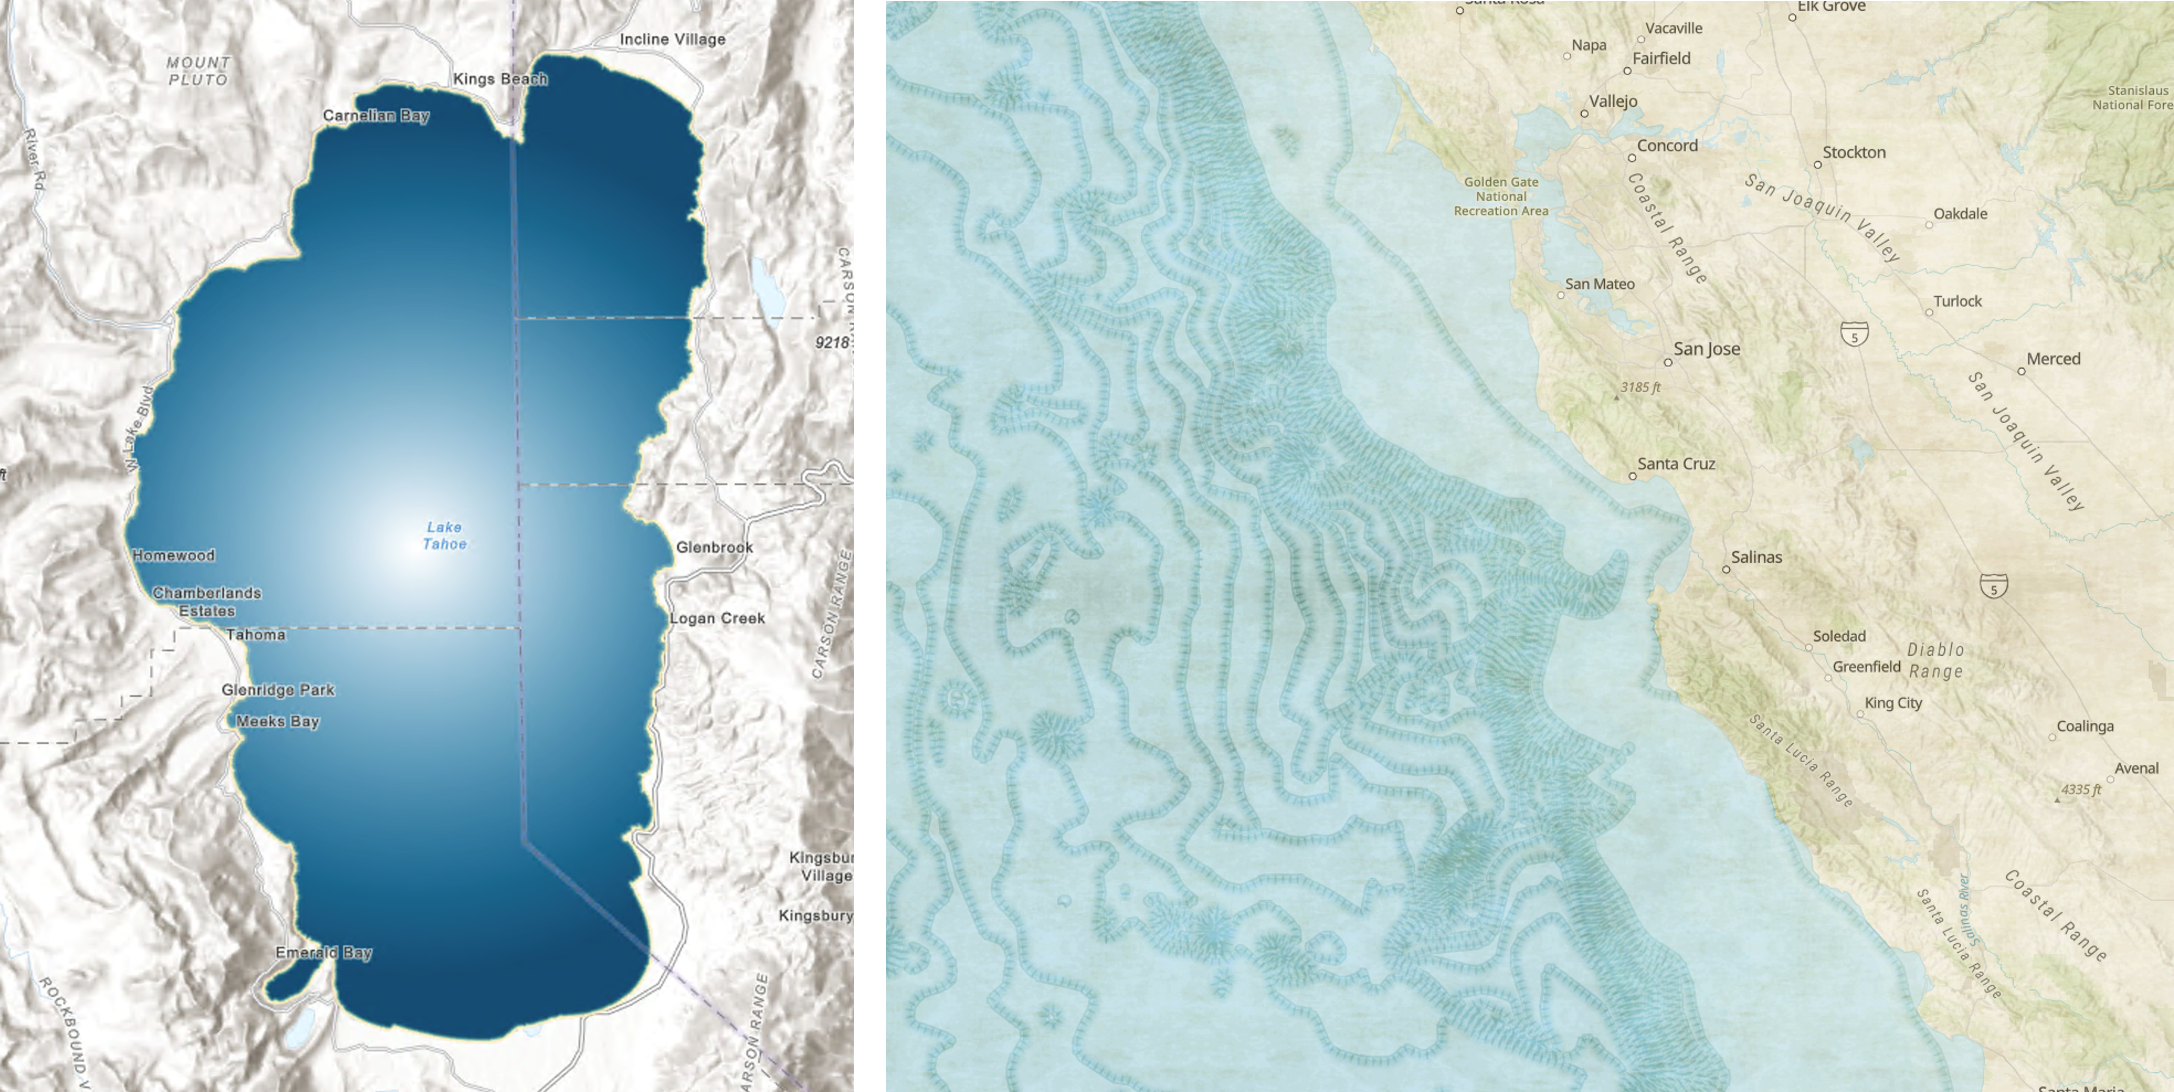
Display filters enable filtering and display of large (and small) datasets with maximized performance. A great use for display filters is for scale dependent rendering of features. In the below sample that displays 2.7 million water line features, a display filter only shows larger rivers at small scales and begins to display smaller streams at larger scales. You can also apply filters manually, controlled by an attribute value. At previous releases, you would have to duplicate the layer and set the scale range and definition expression on each copy of the layer to achieve the same behavior.
Display filters are distinct from definition expressions (which excludes data from being used by all components of your application) and instead only filters the data displayed by the map. Today they must be authored in ArcGIS Pro and published with your service, but we plan to add the ability to create display filters in ArcGIS Online and ArcGIS Enterprise in a future update.
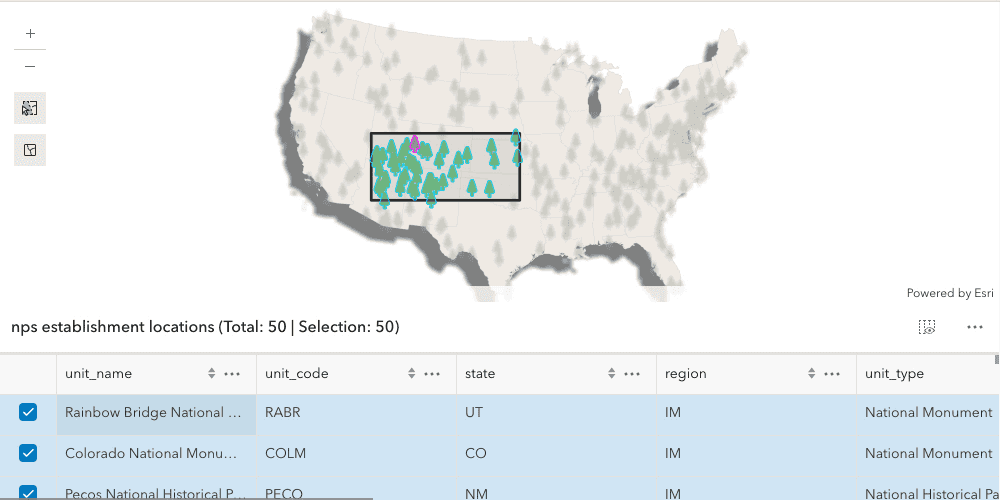
Multiple highlight colors in a single layer
Apply multiple highlight colors across features within the same layer to visually emphasize them based on user interaction or application context. In the example below, the user selects features by drawing a rectangle which are highlighted in green. Then as they hover over the selected features in the table, a second highlight color is used to set focus on the corresponding feature on the map.
The enhancements to highlight capabilities also apply to 3D. In the below example, buildings are selected from the list and have a blue highlight, and when the user hovers over one of them a yellow highlight color is used to distinguish it within the larger selection.
Track rendering (beta)
Visualize tracks of objects such as vehicles, ships, or aircraft in a 2D map. You can configure popups, labels, and renderers for various track parts (latest observation, previous observations, and track line). Previously, you could only configure a single renderer for all visible observations. This visualization technique can either be applied to data streamed in real-time with Stream Layer, or as a way to explore and visualize historic data in a Feature Layer, GeoJSON Layer, CSV Layer, WFS Layer, and OGC Feature Layer. The styling of observation points along the track can be dynamically driven in a variety of ways, for example by attribute values (such as speed) or based on how old the observation is.
Directions: interactively drag stops
Directions component (and widget) have been significantly enhanced with more functionality and a modernized UI design. You can interactively add, move, and remove stops and barriers on the map, and use a new option to request the optimal stop order.
Knowledge Graphs and Web Link Charts
The Knowledge Graph capabilities in the SDK (now out of beta) allow you to model real-world systems that contain both spatial and non-spatial data, and the relationships that connect them. New in this release:
Web link charts contain a link chart layer with the data from your knowledge graph. Web link charts are a new type of visualization, analogous to maps and scenes, that are specifically for visually representing and analyzing a knowledge graph. The implementation of web link charts extends WebMap so they allow you to leverage existing tools and patterns while also adding some additional link chart specific capabilities for refining your link chart visualizations and conducting graph analysis.
New components including the Link Chart component for loading a WebLinkChart from an ArcGIS Enterprise portal item, and a component to switch between link chart layout styles (e.g. forced direct).
Editing with templates
This release introduces new ways of creating and editing features on the web. Editing templates contain tools and settings for creating 2D or 3D features. Until now, there was only one template type available – feature templates. New support for shared templates provides additional workflows to create features:
- Feature templates create features on a single target layer.
- Group templates (new) create features across multiple layers in the same feature service. The primary template determines the geometry type drawn, and it drives the placement of secondary features, based on the rules defined by the author of the group template.
- Preset templates (new) add predefined features to a map and also creates features across multiple layers in the same feature service.
Feature templates can be authored on the web within Map Viewer and in fields maps, as well as in ArcGIS Pro. Group and preset templates can currently only be authored in Pro 3.4 with a Pro add-in. Built-in authoring support within Pro will be available in the next update. Over time the authoring experience will migrate to the web.
In the example below, a preset template named “Pump station with devices” is used to incorporate predefined features onto the map in the exact order they were selected during the template’s creation.
Drawing toolbar in Editor
Editor now includes a toolbar to assist with the creation of circles, rectangles, polylines and polygons. Editor also now respects feature templates published with these draw tools. Prior to this release, polygon layers defaulted to the polygon draw tool and polyline layers defaulted to the polyline tool.
Additionally, Editor displays a staged list of features in a create workflow. A user can delete features in this list, zoom to them, and modify attributes prior to feature creation. Hovering over a list item displays a temporary highlight color over the feature as a visual indicator of the corresponding feature on the map.
Better sketch experience
Sketch offers a better user experience and has more configurations available to accommodate different layouts. These improvements include:
Component scale: You can configure the scale of the component to be small (more compact), medium, or large.
Intelligent resizing: When the available space for sketch is too small to accommodate all tools and options, the component automatically collapses the least important parts first, while ensuring active and most recently used tools are always visible.
More drawing tools available: Opt-in support for freehand polygon, freehand polyline, and multipoint draw tools.
Optimized for both floating and docked uses: You can choose between two styles of the toolbar; floating and docked. The floating option optimizes the layout for display over a map, based on the available space and the configured component scale. Docked is designed for embedding Sketch within a non-map UI like a Calcite panel. It automatically loses its drop shadow and makes the best use of the available space within the parent container.
Oriented imagery measurement and data collection
Image measurement: Measure assets and objects directly within the image space in the Oriented Imagery Viewer. The ground-related measurement tools allow you to measure distance, area, height above ground, and retrieve the ground coordinates on the Map or Scene corresponding to selected points in the viewer.
Data capture: Create features over an image displayed in the Oriented Imagery Viewer. Ideal for inspection workflows, users can mark assets and extract valuable information from images within the viewer. Features are persisted in a feature layer.
Utility network updates
Many updates in this release benefit utility network workflows. In addition to the enhancements listed above (and others in the release notes), the following features were added:
Subtype Group Tables: This enables you to work with non-spatial objects such as those typically used in the telecommunication industry.
Add and Delete Associations: Editor allows adding and deleting of associations between features in forms.
Tracing enhancements: Enhancements include the ability to execute traces with nonspatial data and also to see associations in trace results.
It’s time to use geometry operators
Geometry operators (now out of beta) were introduced at 4.31 as the eventual replacement for the geometry engine, which provides functions for testing, measuring, and analyzing spatial relationships between two or more 2D geometries client-side. The new geometry operators not only encompass all the existing functionality of the geometry engine but also introduce over 20 new capabilities. For an overview of the operators, please refer to the Introduction to geometry operators guide page. Some of the latest updates includes:
Projection: This release introduces support for a new project operator, which will eventually replace the projection engine. This operator provides client-side capabilities for converting geometries from one spatial reference to another.
Shape preserving projection: This operator transforms 2D geometry segment endpoints and interior points to maintain their original shape accurately.
Query attribute bins
Attribute bin queries simplify large or complex datasets by summarizing them into meaningful intervals, making patterns or trends easier to identify. For example, hurricanes that occurred between 1900 and 2024 can be grouped by month to analyze seasonal patterns and determine which months have the highest frequency of hurricanes.
Gradient symbology
Create beautiful vector symbols using gradient stroke and gradient fill symbol layers. This enhancement to CIM symbols brings more options for cartographic styling in your applications, with support for linear, rectangular, and radial gradients. This also brings improved support for some web styles published from ArcGIS Pro – such as the watercolor or glassy orb styles.
Try out this new terrain analysis sample
Explore key terrain attributes, such as slope, elevation, and aspect using the new terrain analysis sample. It uses client-side image analysis capabilities such as raster functions and our tiled global Terrain 3D layer for fast display and interactivity.
Learn more
This blog is only a peek into the many updates included in this release. Get the full scoop by exploring the release notes, playing with the latest samples, and trying out the component API reference’s new experience.
2025 Esri Developer and Technology Summit
Come meet the product teams that build Esri’s web development technology and discuss your projects with us! We have an amazing lineup of technical presentations planned covering recent technology advances, best practices & techniques, and inspiring examples. Find out more about the Esri Developer & Technology Summit website.

Article Discussion: