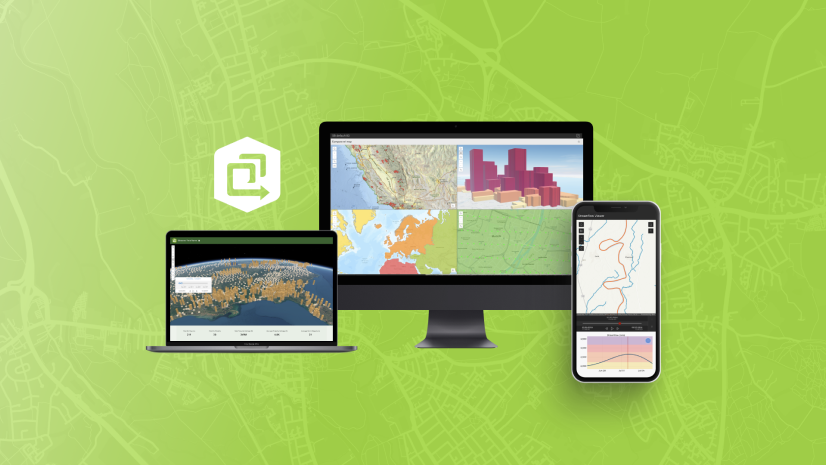
Observer is a new ArcGIS Instant Apps template that allows you to explore and learn about a web scene by using tools that filter and display statistics about data in the scene. Displaying data in 3D provides a more immersive way to visualize information, allowing users to better understand spatial relationships and the three-dimensional aspects of data, such as elevation and proximity.
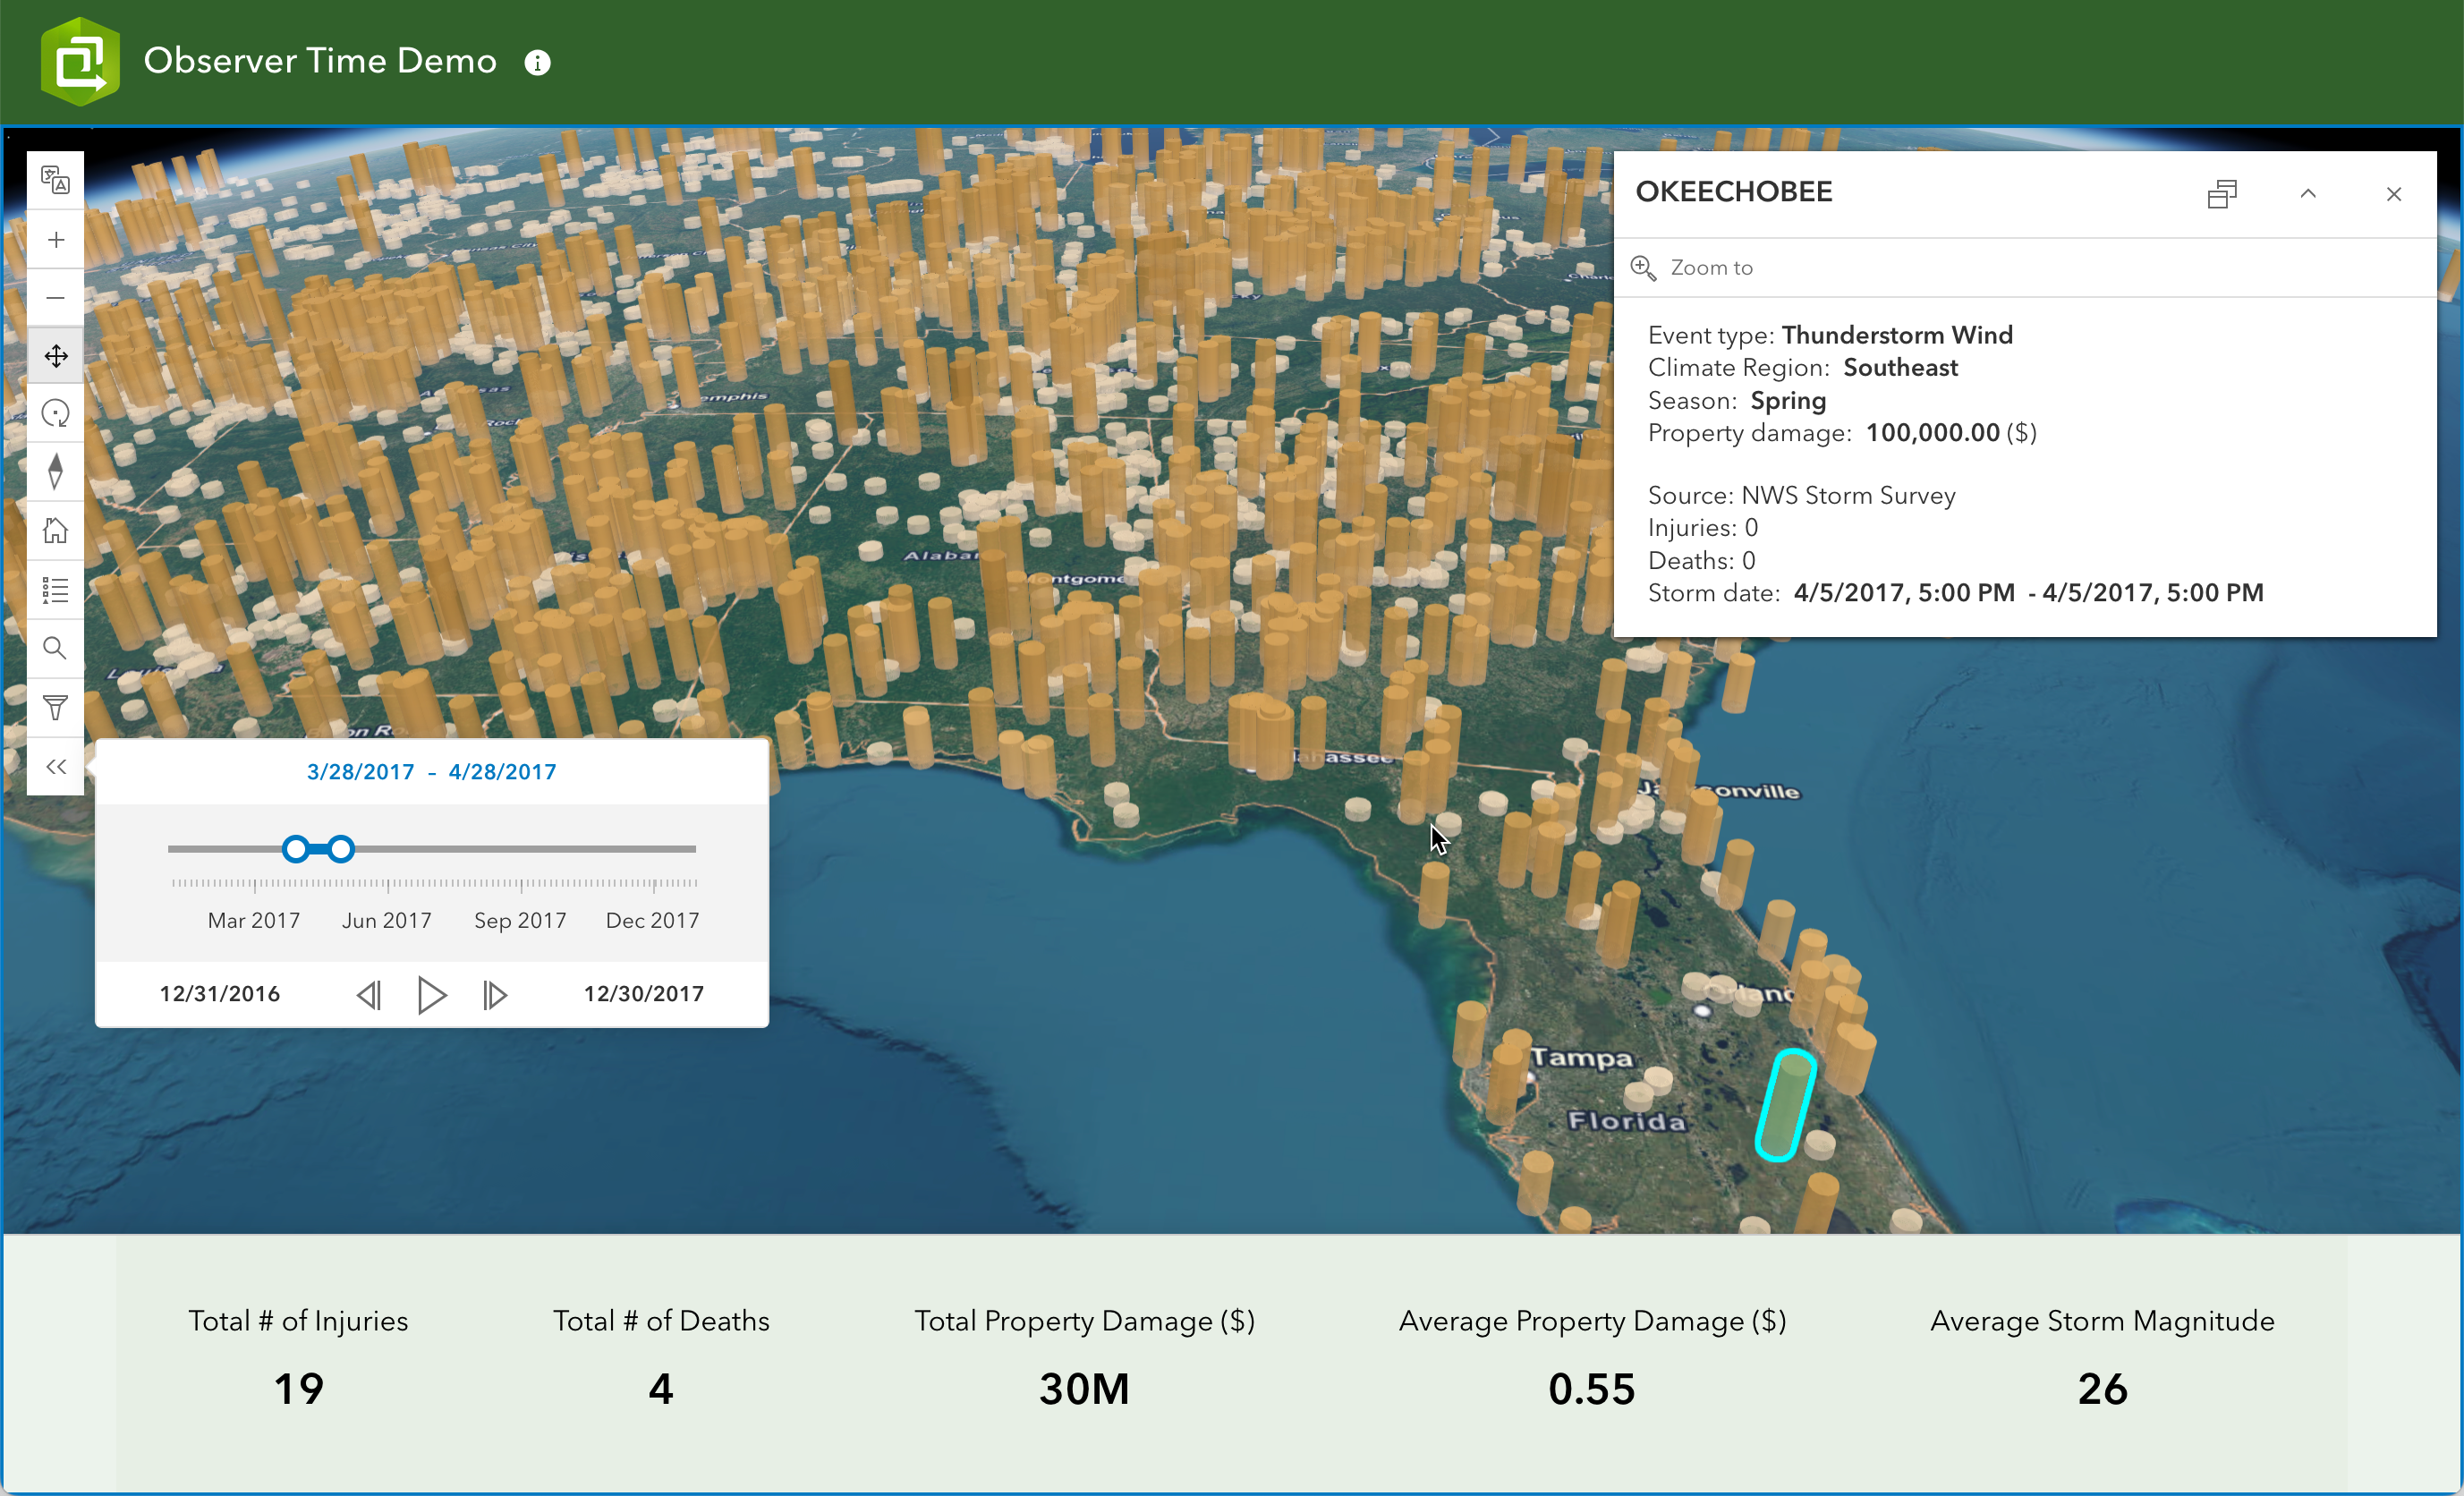
This app includes filter tools such as the attribute filter and time slider as well as a summary scoreboard tool to display statistics about the data in the scene. These tools allow app viewers to gain valuable insights about the content in the scene at a single glance. There are additional tools available in Observer to assist with navigating and exploring the app as well as tools to provide information about the app.
The Observer app would be a great tool to use to visualize data for many use cases, such as the following:
- View the impacts of flooding over time on underground assets, such as pipelines.
- Summarize construction status, costs, or lease availability while viewing the development of buildings in a city or real estate assets.
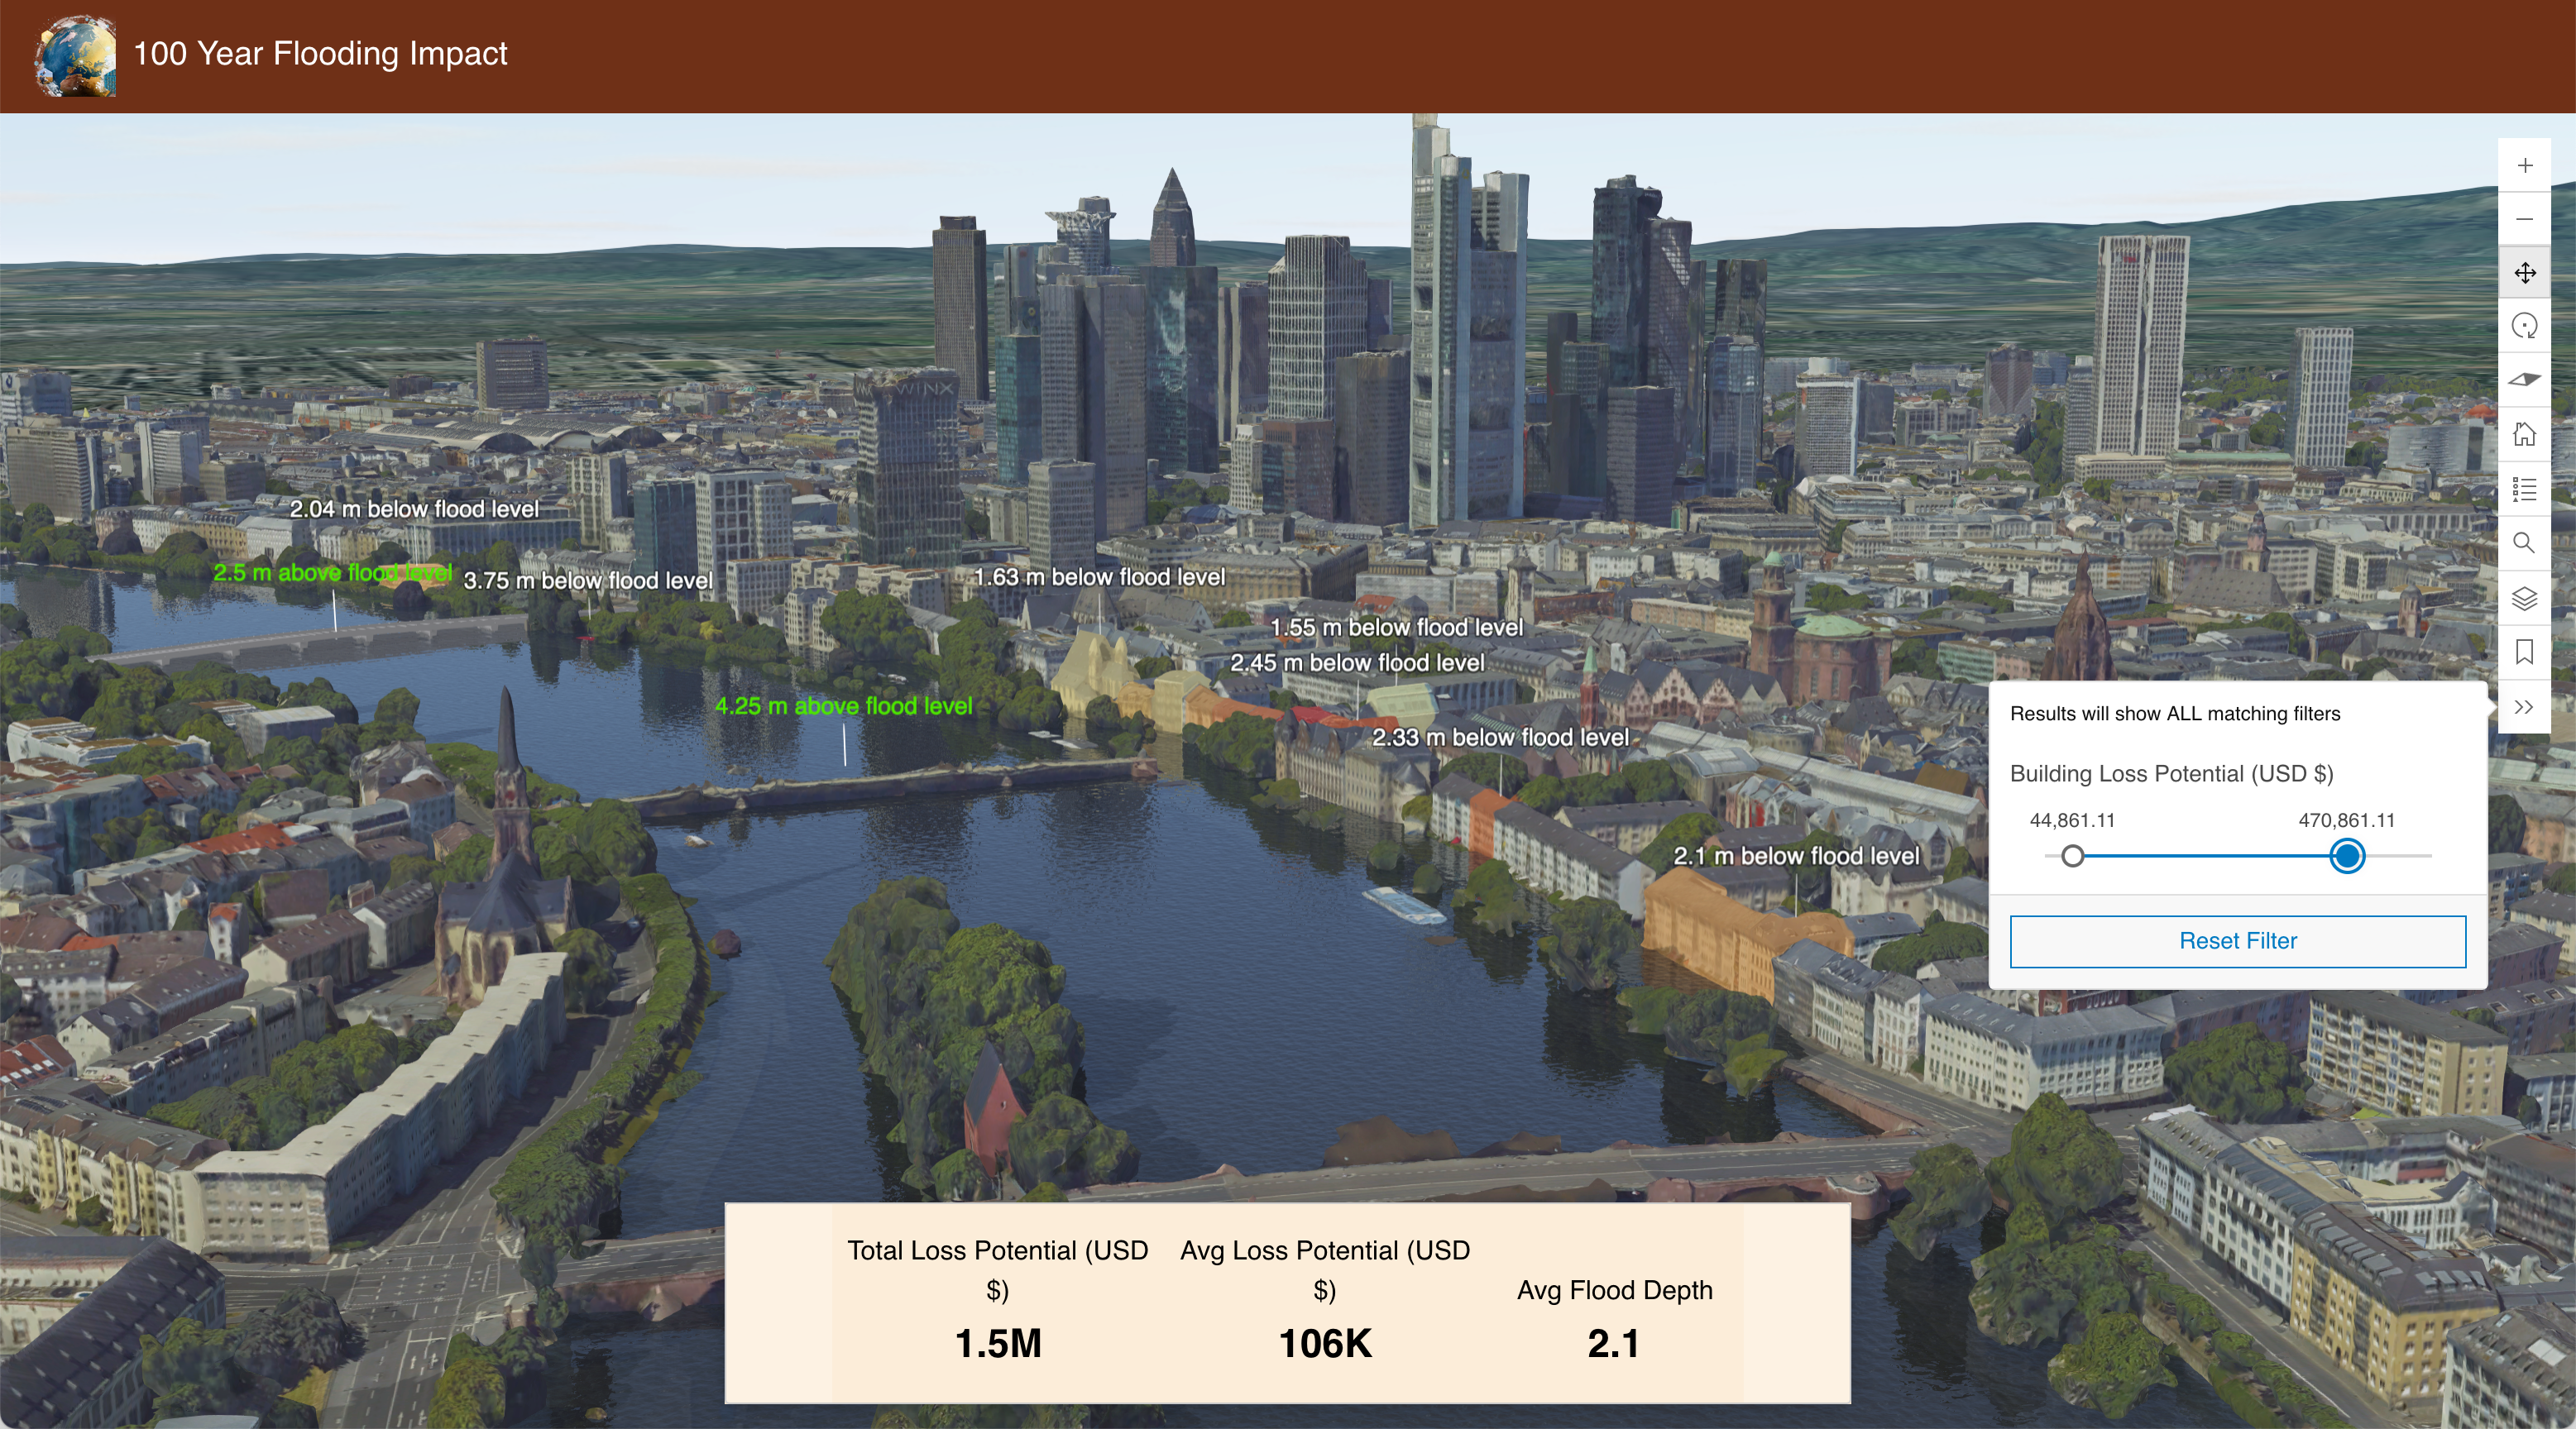
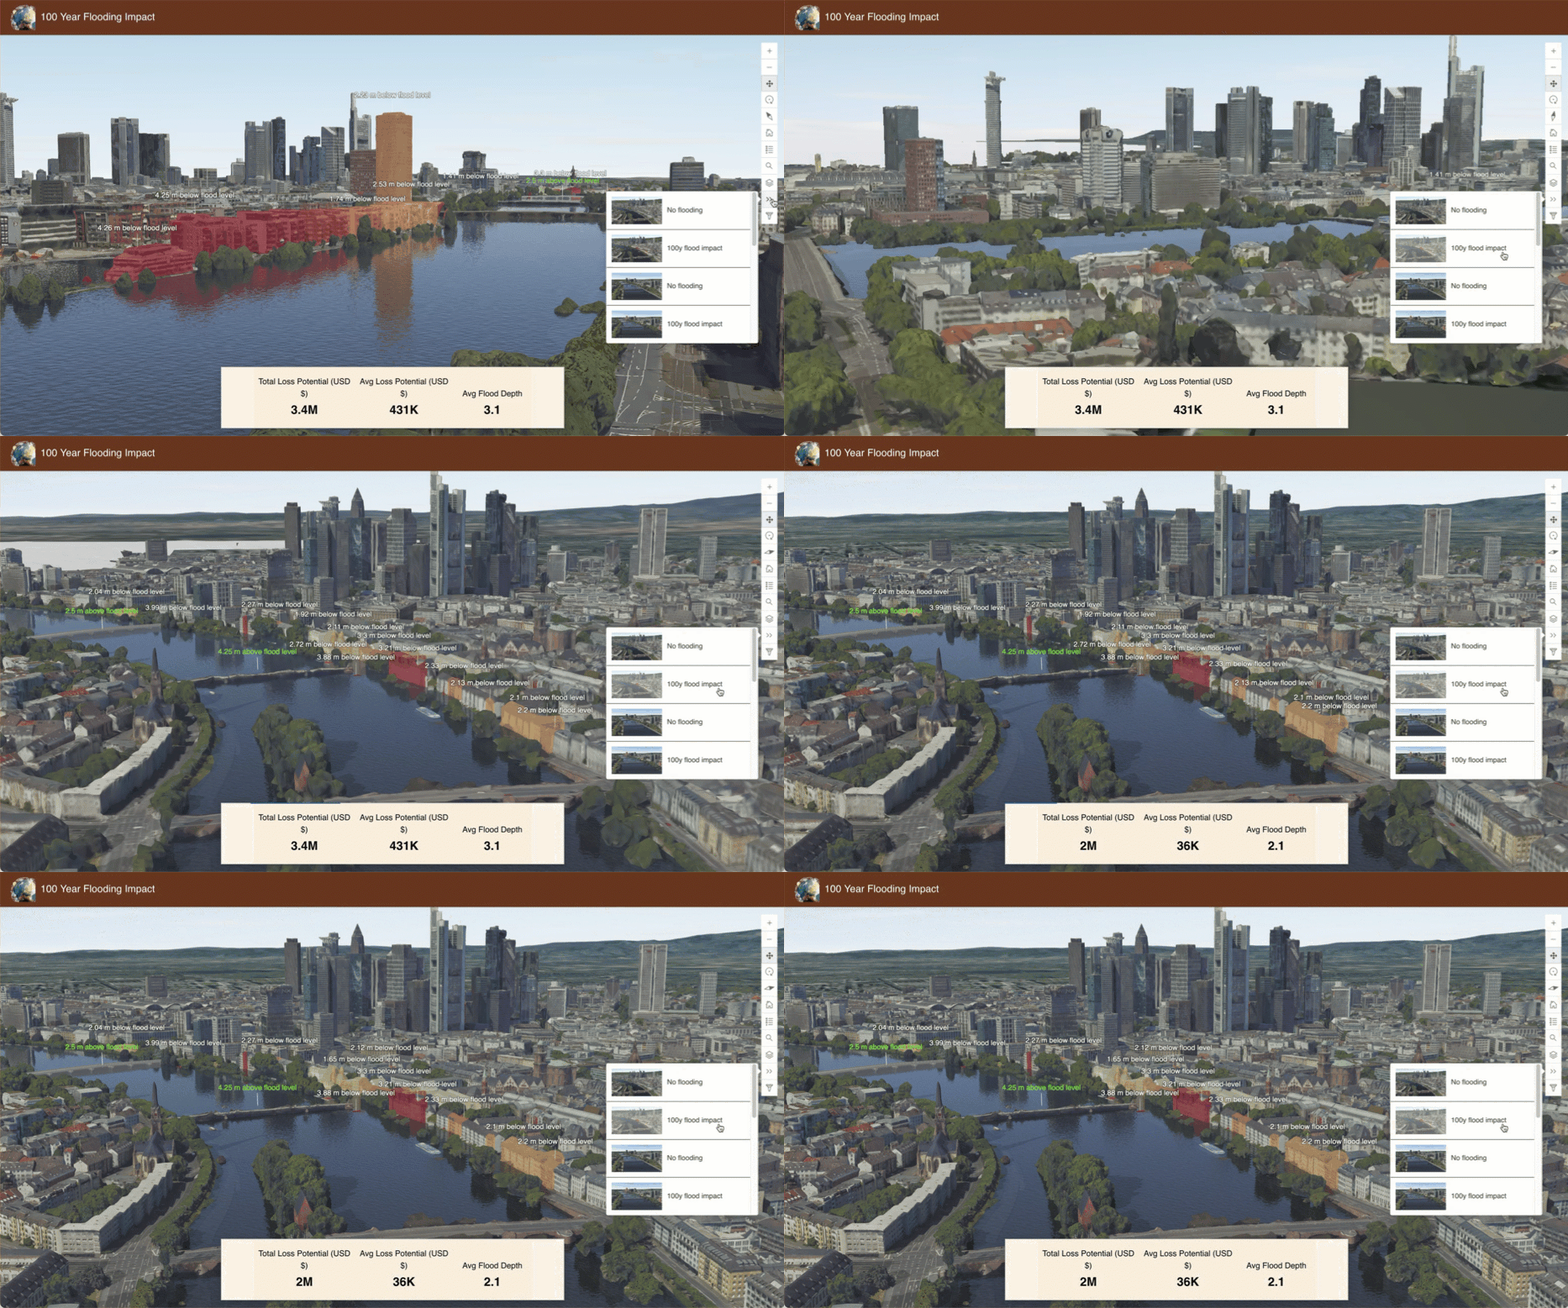
- Compare the structural and financial impacts from an environmental event in an area of interest while visualizing the data.
Set up a web scene
The first step in having a successful Observer app, is setting up a web scene. Having a well-configured web scene improves the viewing experience of the app by having curated content that is accessible and straightforward. When configuring a web scene, there are certain elements that should be considered:
- Basemaps: Basemaps provide context and visual reference for the data being displayed. In ArcGIS Online, there are 3D basemaps available to use when setting up a scene. 3D basemaps contain layers—such as buildings, labels, or trees—that you can turn on and off.
- Layer visibility: Add layers that will display in the scene. Determine which layers are on and off when the scene loads.
- Symbology: Use smart mapping styles to communicate information through color, symbols, and patterns that enhance understanding and highlight key features or trends within data.
- Pop-ups: When a feature in the scene is clicked on a pop-up will open displaying attribute information from the data. Pop-ups can be configured to show in depth descriptions about features, attachments like images, or charts that show off graphic representations.
- Slides: Save snapshots of the web scene that show different views. Saving slides in a scene can help tell a story or focus in on the most important locations in a scene.
- Time: A time slider in a web scene allows users to visualize temporal changes and patterns in the data. This allows users to analyze patterns or trends and make informed decisions based on historical information.
The Observer app has many tools that take advantage of the configured elements in a web scene. For example, the time filter tool uses the time configurations that are determined in Scene Viewer.
Create an Observer app
Once a web scene is saved, it can be used in an Observer app. To create an Observer app, start with the Instant Apps home page*. You can get to the home page from Scene Viewer, from the content page, or from the app launcher.
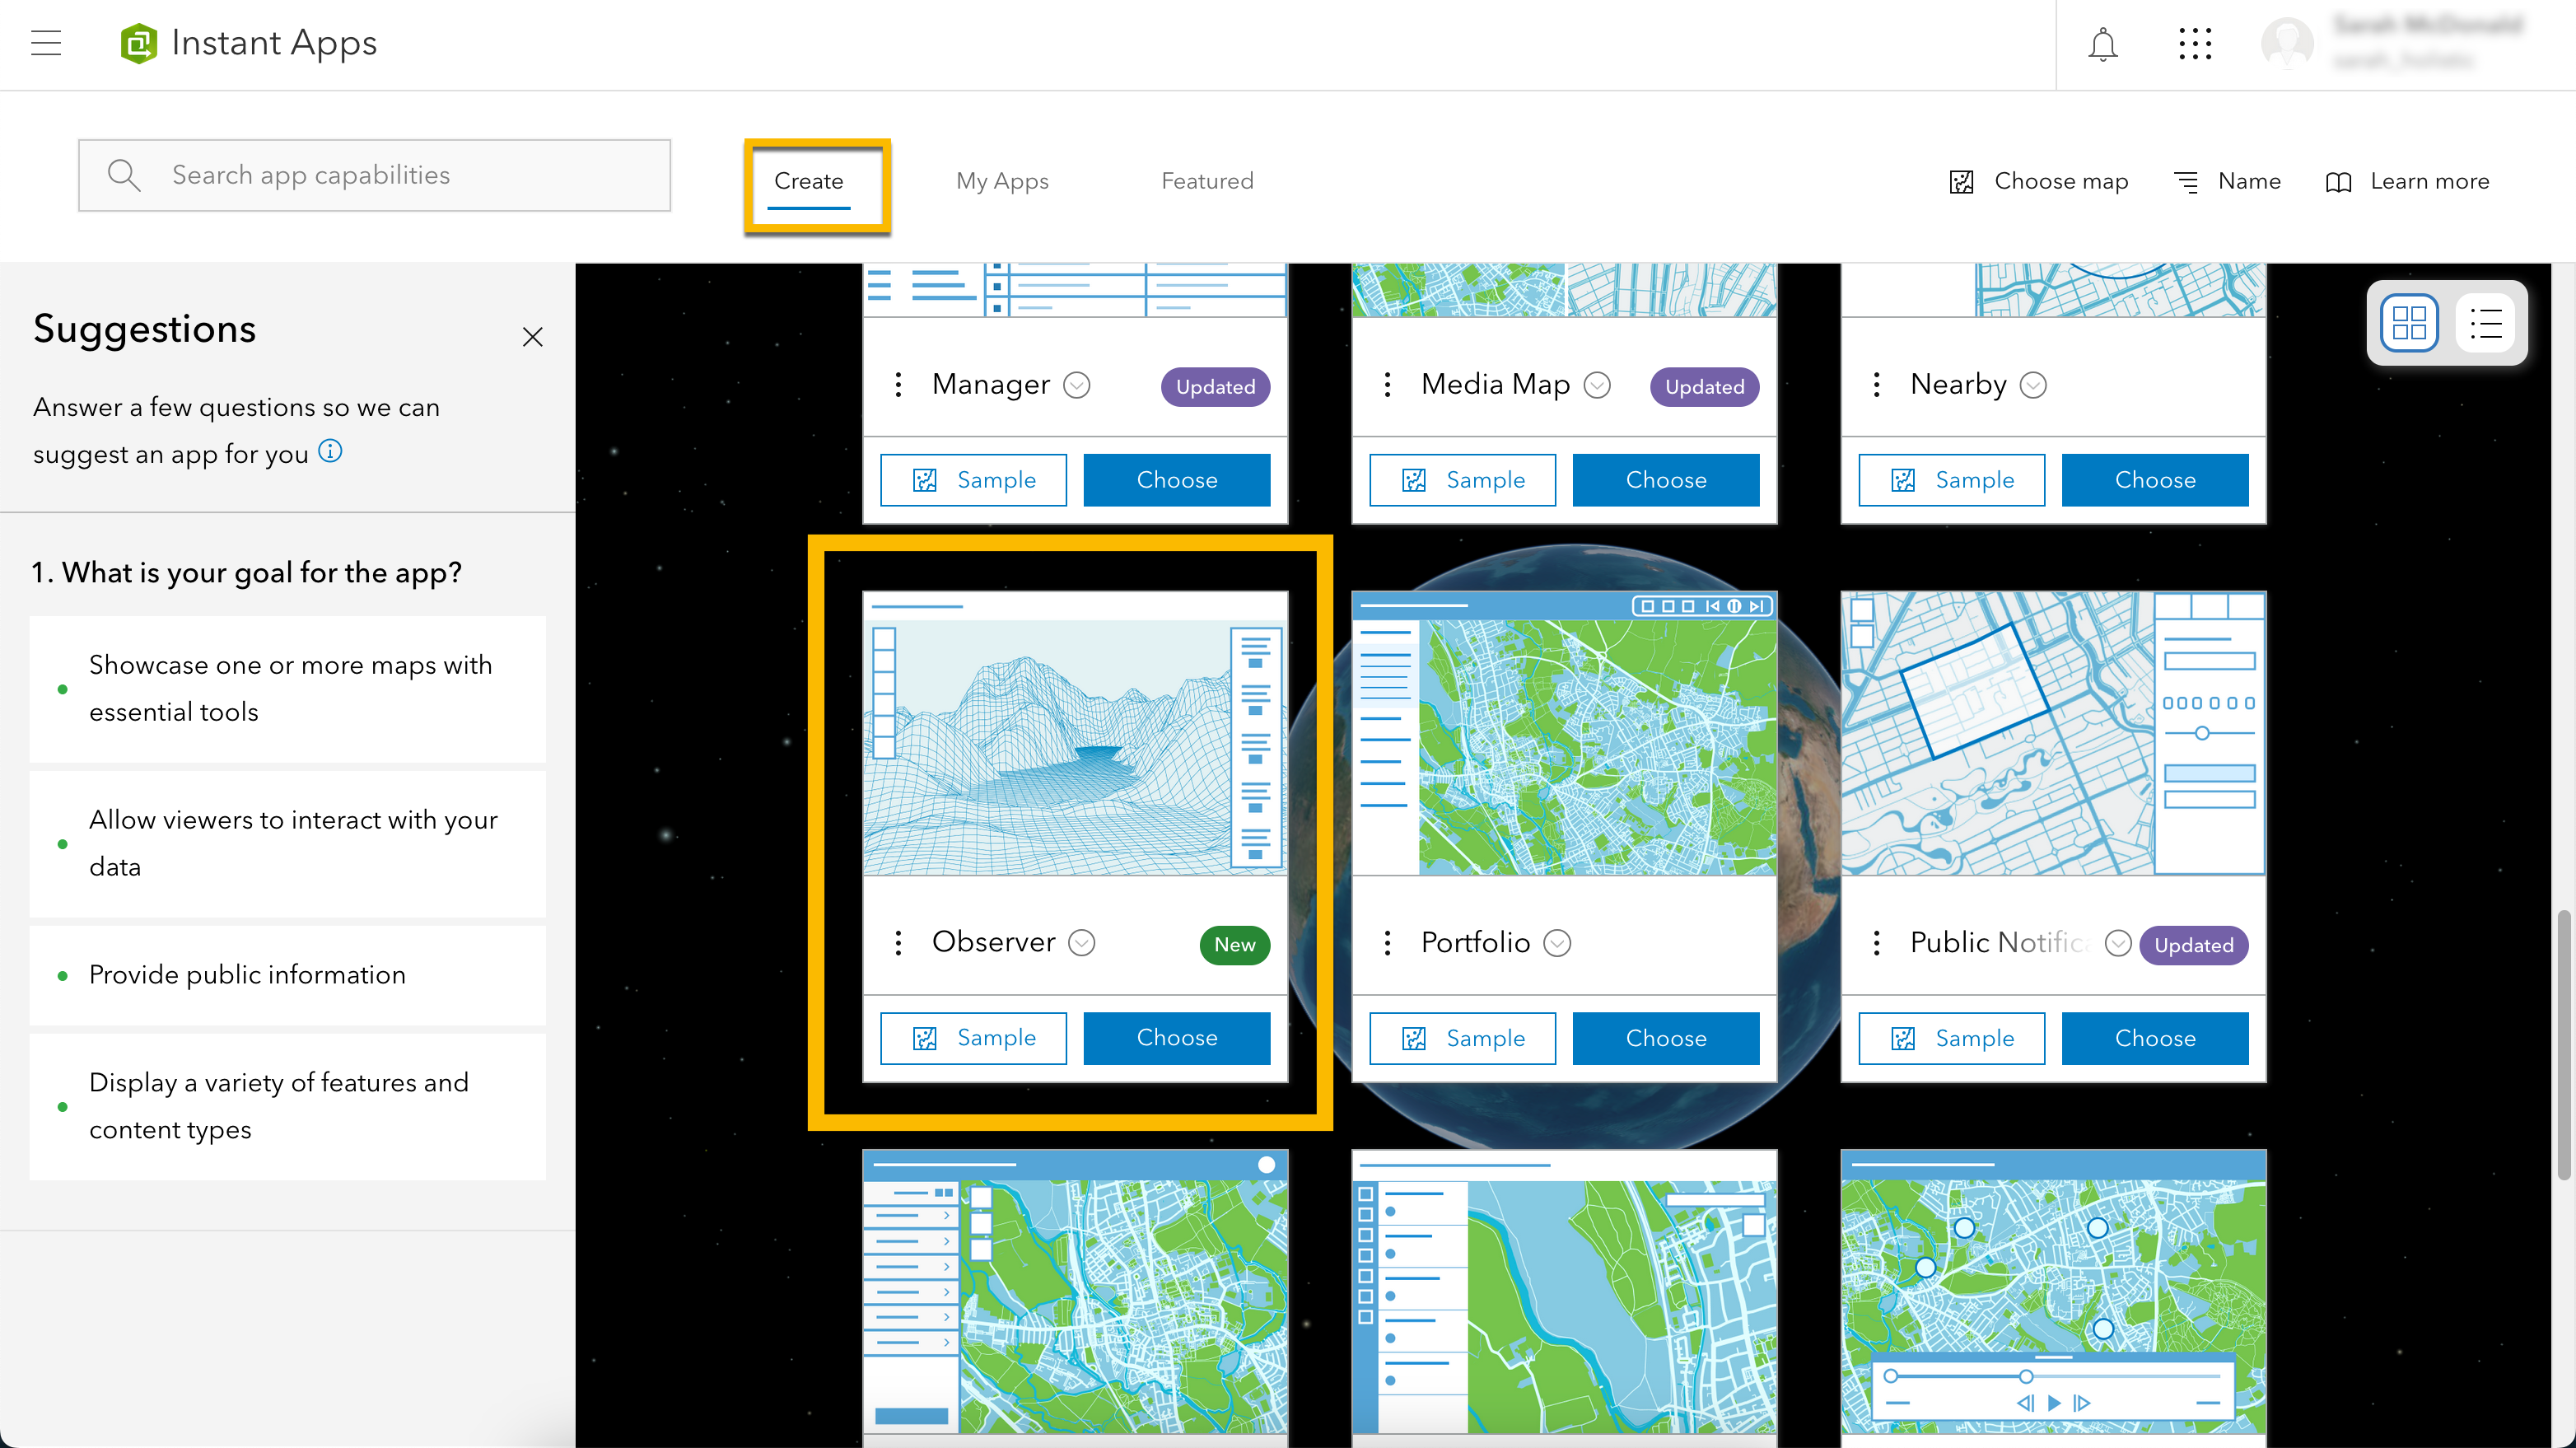
Once the app is created, you will have the all the tools and settings that are available in the app. Some notable tools and settings include the following:
Introduction window – A window that displays when your app first loads. Include text and images in the window to introduce users to your app or provide simple instructions on how to use it.
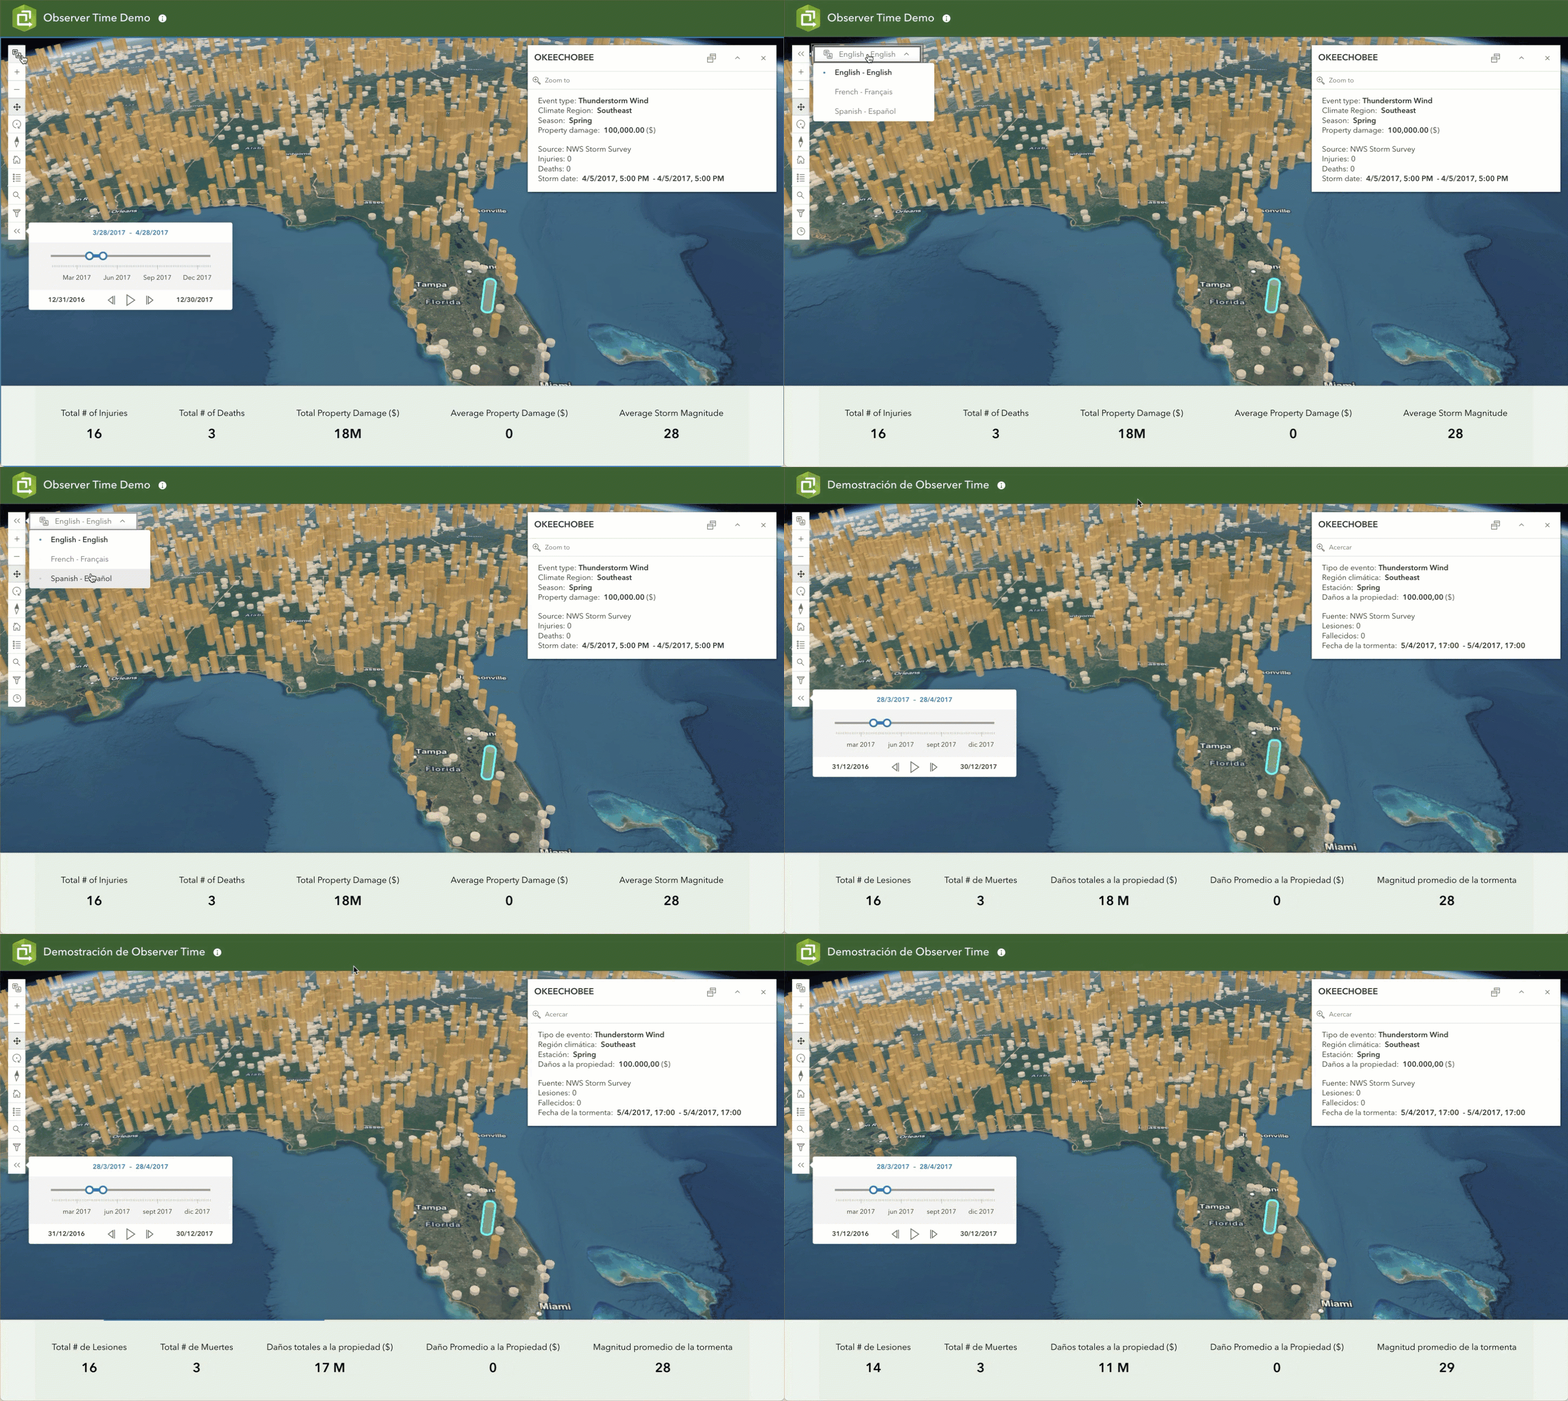
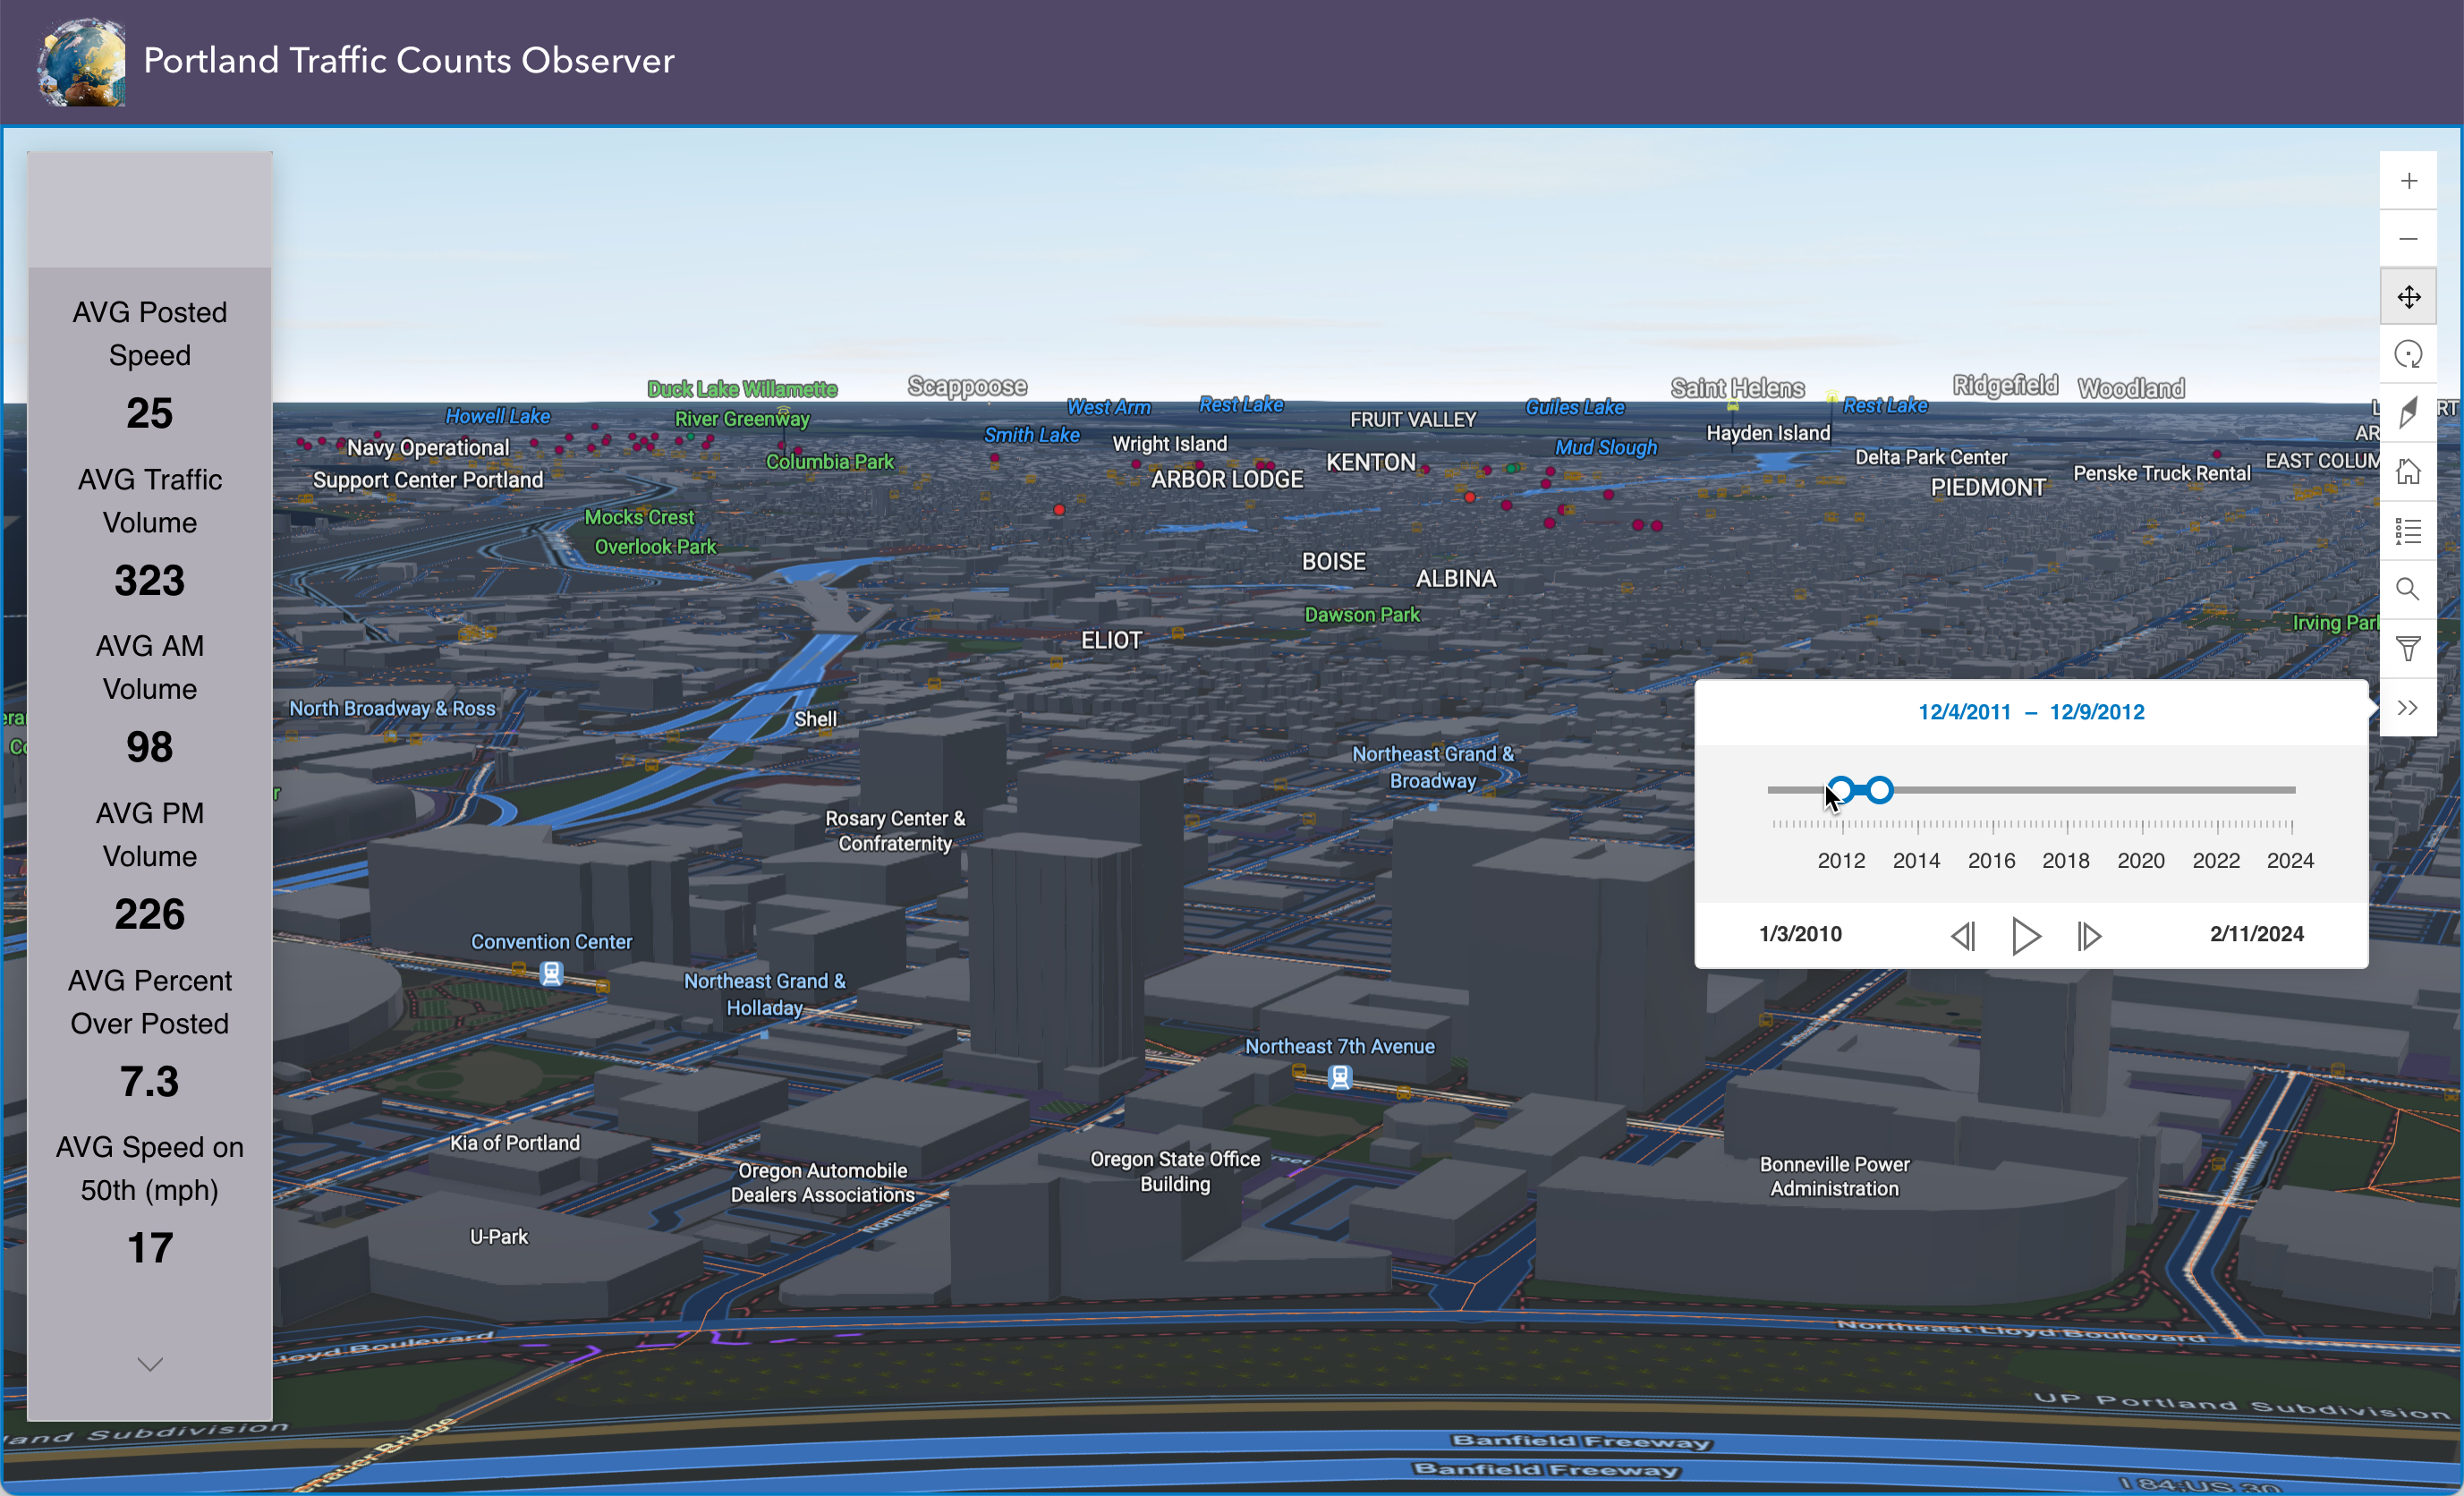
Summary scoreboard – Display statistics based on attributes in layers to summarize data in the scene. Choose to use operators such as average, count, sum, maximum, and minimum value to calculate statistics for. Provide a label for each and choose a position and style for the scoreboard. You can float the scoreboard over the map or pin it to the edge of the app so the scoreboard fully spans the app.
Attribute filter – Including attribute filters in your app allows users to interactively explore data by refining what is visible based on specific attributes. This allows users to focus on subsets of data and gain deeper insights into patterns and relationships in the scene. The attribute filter supports two types of filters: predefined and user input.
Time filter – Use the time filter to take advantage of pre-configured time settings from the web scene. The slider in the time filter can be used to visualize temporal patterns and trends in data in the web scene, allowing users to interactively explore changes over time.
Feature search – Find addresses and locate features in the scene. To refine search results, you can add a search source from layers in the map (and by URL), choose specific locators from your organization, and add a custom locator.
Theme settings – Use the theme settings to adjust the default appearance of your app. Choose to define a light or dark mode in the app along with a custom or predefined theme that will be applied to elements in the app such as widgets, the header, or the summary scoreboard. Include a custom logo in the header to keep your app on brand.
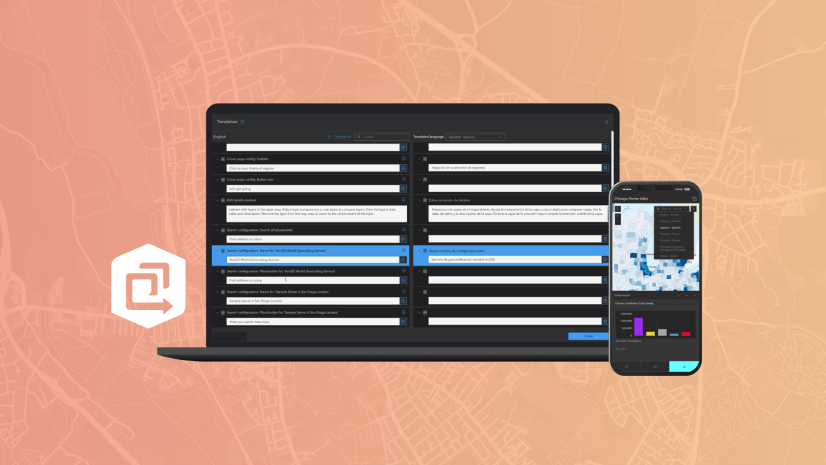
Language switcher – Include the option to provide multiple translations for the text in your app. The language switcher combines ready translations of Esri-defined text from the app layout with your own translations from the app configuration, such as the app title, scoreboard labels, introduction window, and other custom text.
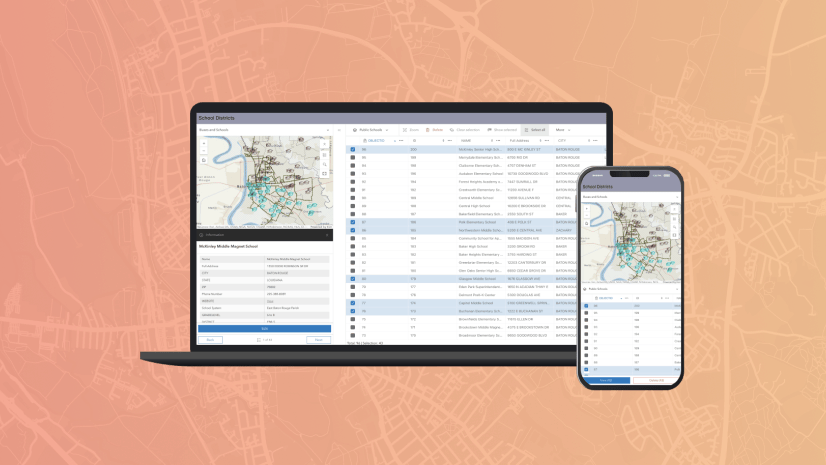
Once you’ve configured the tools and settings for your app, use the views option in the app configuration to preview what your Observer app will look like on mobile. Observer is set up to be mobile responsive, so no additional mobile configurations are necessary. In conclusion, Observer provides a user-friendly interface and robust features to encourage interactions with your scene. Explore the possibilities with Observer and elevate your scenes to the next level.

Article Discussion: