Included in the September 2021 release is a new ArcGIS Instant App, Slider! The Slider template utilizes a playable slider to bring numeric and time enabled data to life. The numeric option supports integer fields, expanding the options for animating data beyond only time enabled data. For example, the slider can showcase date-related fields stored integer fields (year or time of day) or other types of values such as census response rate or election results. The time option animates time enabled webmaps. The app includes options to control play speed, change the display of non-active and active features, and manager the slider theme. It also includes all the options you’re already familiar with for (most) instant apps such as bookmarks, layer lists, legends, navigation controls, hover pop-ups and a cover pages, as well as many more!
Let’s take a look at the new Slider Instant App
Slider with Numeric Values
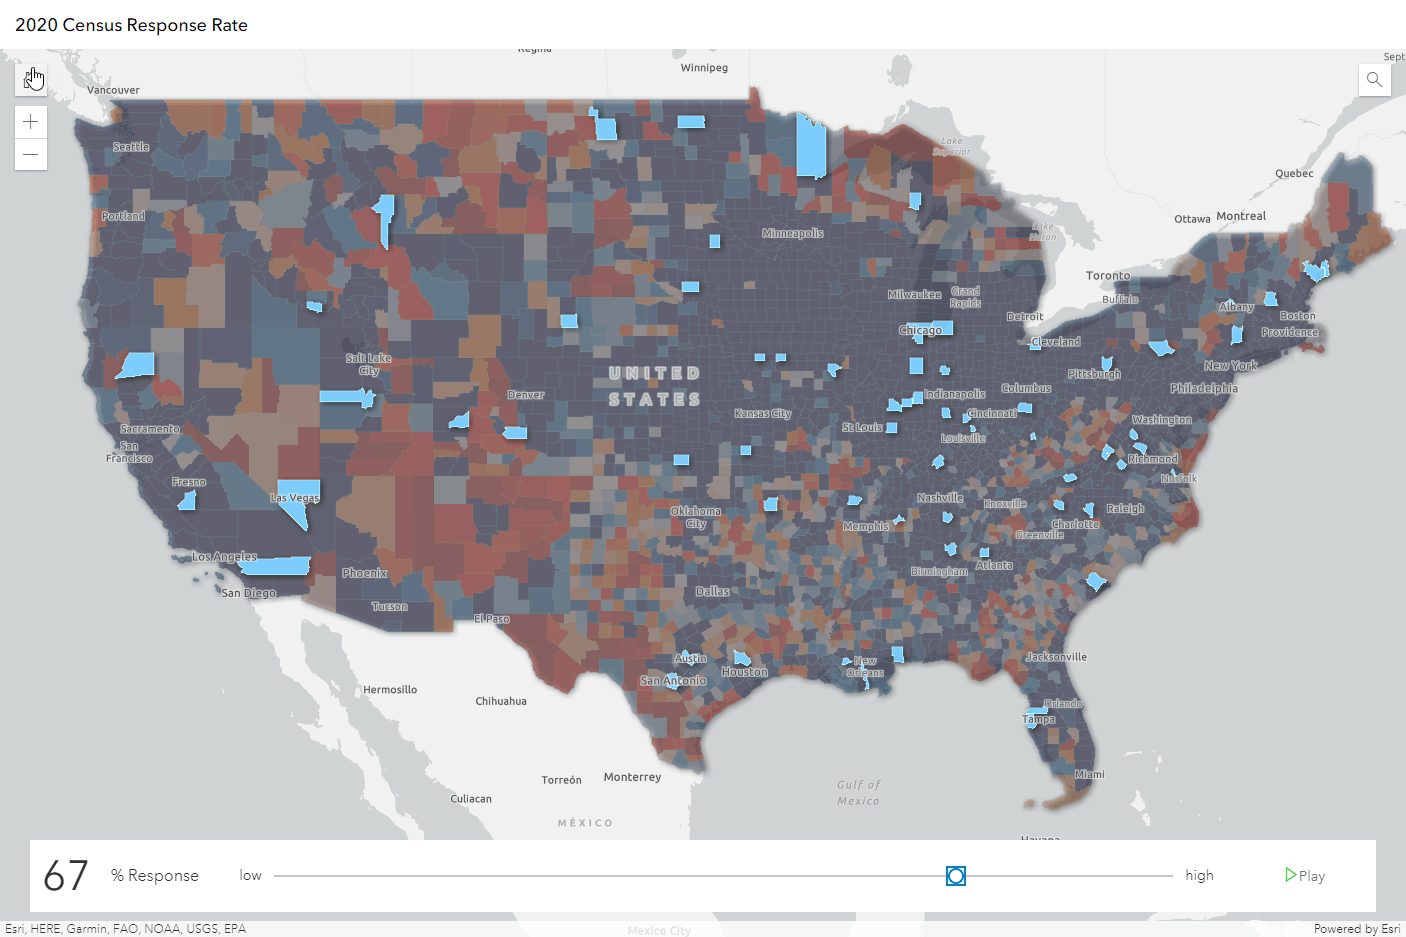
The numeric slider options animate any integer field. The example below demonstrates numeric census response rates from 2020. The app highlights counties ranging from a low-to-high response rate.
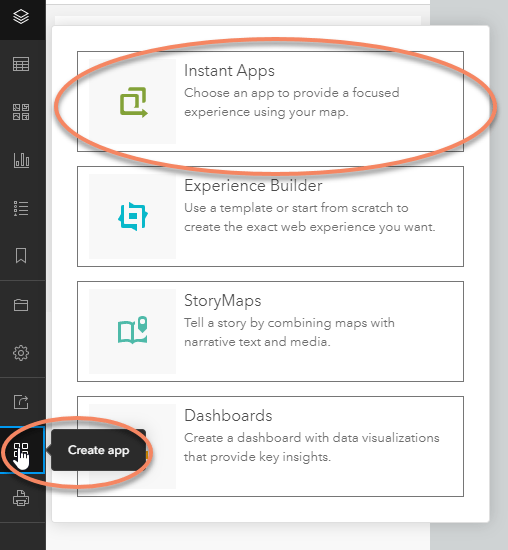
Use the Create App button (either from the Map Viewer or My Content) to make a new app. From the Instant App gallery select Slider:

Express Setup launches and provides you the core options through a 5-step process. Step 1 selects the map. Step 2 configures the slider. First, select whether the slider operates on Numeric or Time values. The app defaults to Numeric when the map does not contain time enabled data, Time when it does.
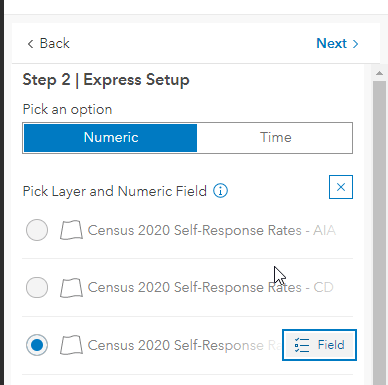
Select the layer and field the slider reads. In this case, the slider uses the layer containing county level data and the field containing overall response rate to power the slider.
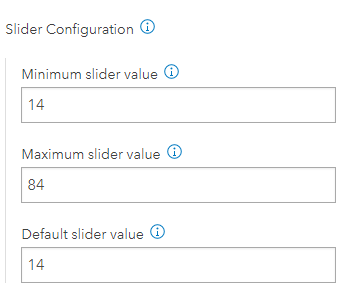
Next, configure the slider. By default, the min and max values are populated from the minimum and maximum field values. All values in the slider settings must be withing the range of the actual field values.
Choose how to display non-active features. Features are hidden by default, but for this example the app applies opacity to features so they are still visible in the map. The Full Setup provides an option to highlight features if the active features need more emphasis.
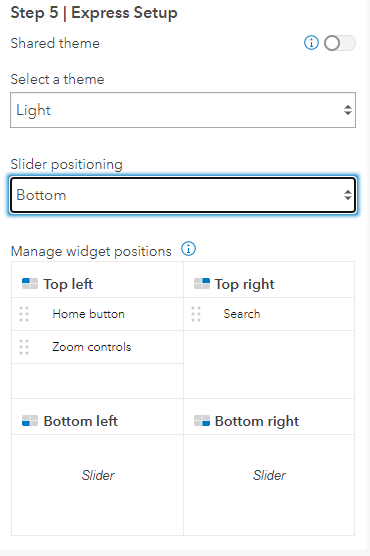
Step 3 provides options to add information about the app through a header and introduction panel. An introduction panel provides context and direction to app users. Step 4 configures the search and screenshot tool. Finally, Step 5 controls the theme and look of the app. The slider expands to the width of the app, so you will see two quadrants of the position manager blocked out when setting the locations of tools. This prevents any overlap or crowding.
Full Setup
Looking for more options? Full Setup to the rescue! Below, the example demonstrates how an applying effects to active features makes them really pop. Within the Slider section of the app, find the Active Feature effect. For this app, brightness has been applied to active features.

The numeric version of the slider has the option to add labels to the slider and current value. This helps provide context guide app users when using the slider.

After configuration, it’s publishing time. Click the publish button to publish and share the app.
Slider with Time Enabled data
The Slider Instant App also supports time enabled web maps. To use the time option in the Slider app the web map must contain a time enabled layer. For more information on how to configure time settings visit the help. Take time to configure the time settings in the web map, the app uses these settings.
For this example, we will be using the National Weather Service Precipitation Forecast data available through the Living Atlas. The dataset includes cumulative precipitation data in 6-hour intervals. When the web map is ready, you can create a Slider Instant App through the Create App option and choose Slider.
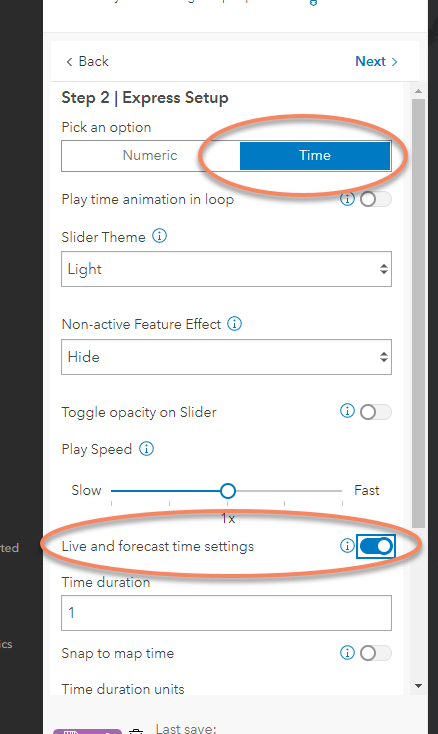
As mentioned earlier, the app launches in Express Setup. Since the web map has a time enabled layer, it will default to the Time option. Within the time option, there will be a Live and forecast setting – enabling this will switch the app to support forecast data. The time slider will now start at the current date.
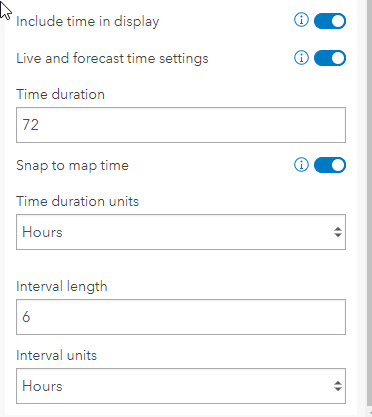
As described in the live feed’s item description, the data is in 6-hour increments for 72 hours. We will configure the time settings to match that. Since the data is setup in 6-hour increments, toggling on Snap to map time prevents any overlap of weather polygons and snaps to the closest 6-hour increment. Since the increments are 6-hours, switch to Full Setup to toggle on and include time in the slider display (in addition to date).
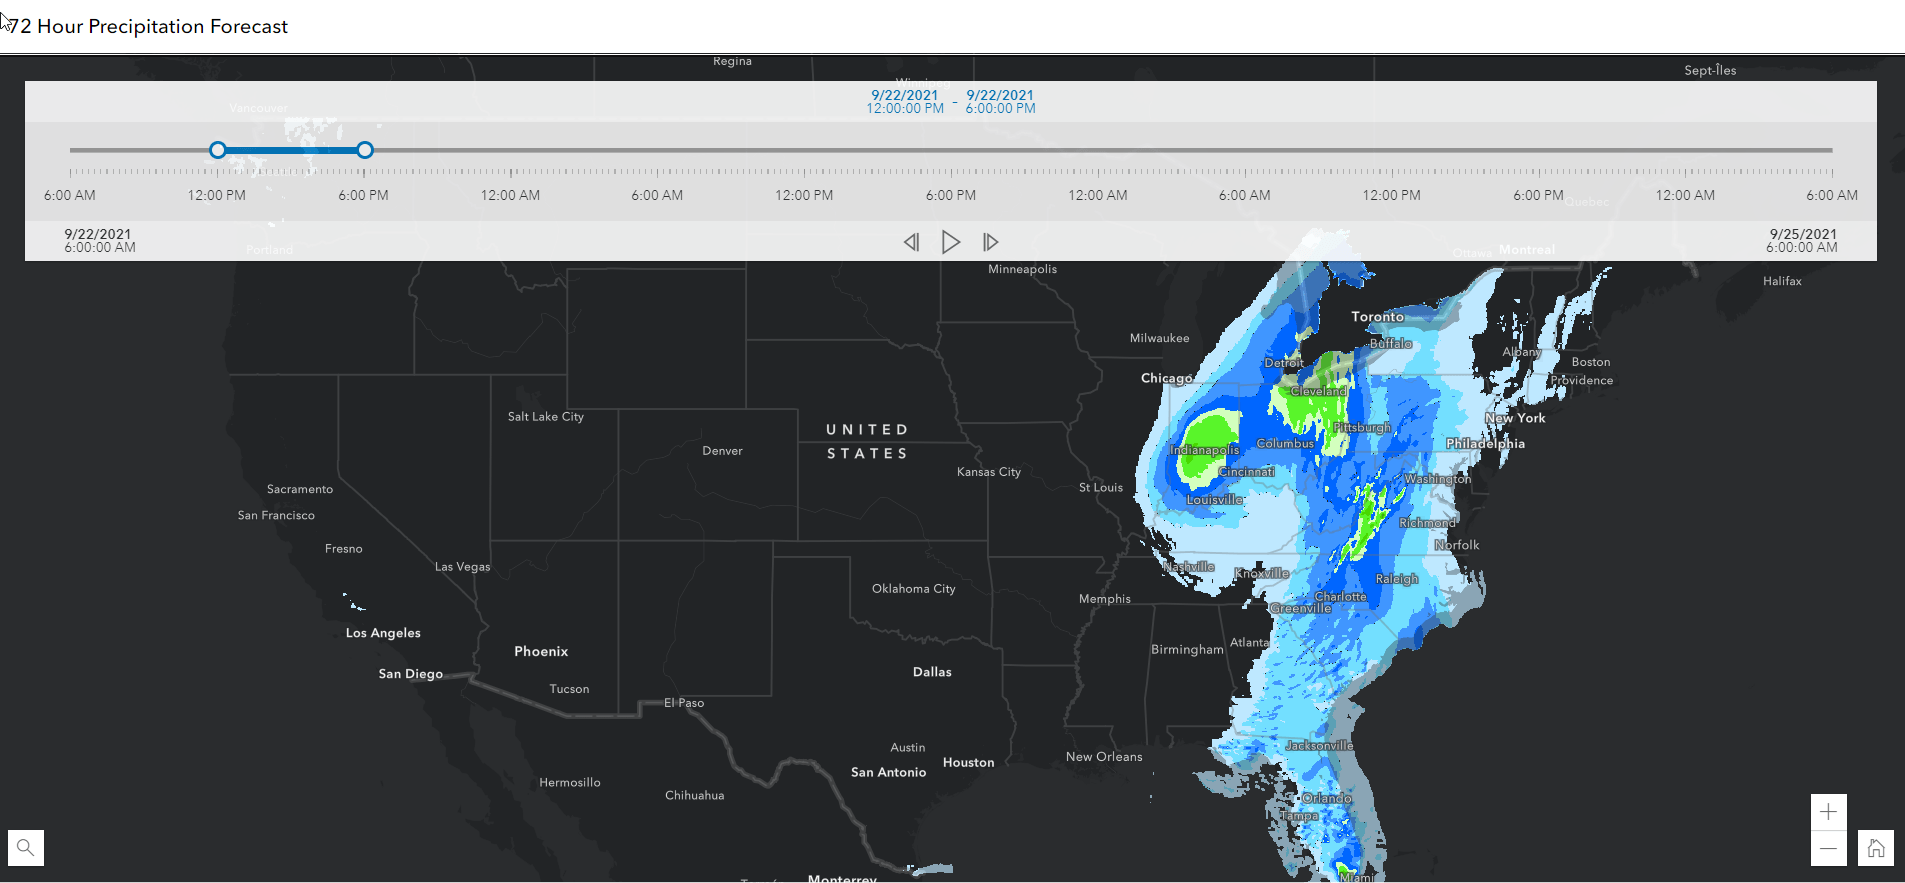
Finally, review the app and select Publish when configuration is complete . Each time the app is opened, the slider will start at the app user’s current time and show 72 hours of precipitation forecast. Try it out for yourself!

Article Discussion: