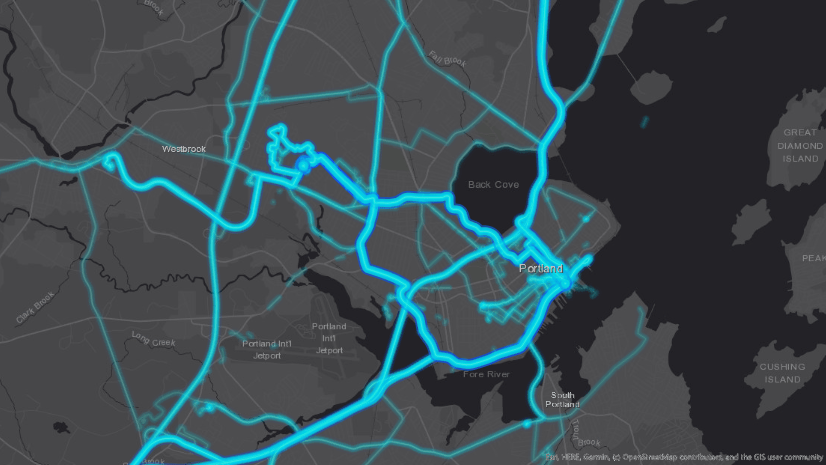
After an event, it can be very useful to see where personnel were during the course of the day. One interesting way to visualize this is by creating an animation over time using data recorded by ArcGIS Tracker or ArcGIS Field Maps. The two animations below play back the last known locations and historical tracks over time using some data I captured while on a short hike.

Export the data from ArcGIS Online
The first step is to export the historical tracks from ArcGIS Online. Tracks can be exported to a CSV file, downloaded, and then imported into ArcGIS Pro to build the animation. In ArcGIS Online, navigate to either the location tracking feature service or any track view. On the Overview tab, expand the Export Data dropdown menu and select Export to CSV file.

Add a title and one or more tags, then click Export. Once this completes, there will be an option to download the file. Click Download and save the file to your desktop. You should be able to open the generated CSV file in a program like Microsoft Excel and verify there are rows of data.
While there are alternative ways to export data using other geoprocessing tools, exporting directly from ArcGIS Online is the fastest and recommended way. On ArcGIS Enterprise, tracks must be downloaded using different methods such as Extract Data (which have some limitations).
Process the data
Now that we have the location data, let’s open it with ArcGIS Pro. In ArcGIS Pro, navigate to the CSV file, right click, select Export and then select Table to Point Feature Class… This will import the data into a File Geodatabase so that we can add some additional fields and do some calculations to prepare the data for the animation.

In the XY Table to Point dialog, provide an Output Feature Class name, set the X Field to “x”, set the Y Field to “y”, set the Coordinate System to “GCS_WGS_1984” and then run the tool.

Next, select the generated feature class and add it to a new map (if it is not already added to the map). In the Contents pane select the layer. Then, under the Data tab, select Fields.

In the table, add two new fields: Start Time, and End Time. These are the fields we will use to drive the time-enabled animation.
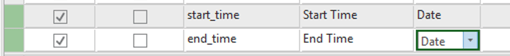
Next, we need to populate these two fields. For the Start Time field, we are going to convert the “location_timestamp” field from a UTC timestamp (integer field) to an actual date field. Open the Calculate Field Geoprocessing tool and fill it out as shown below using this Python 3 expression and code block:

Next, we will calculate values for the End Time field. For this, open the Calculate End Time Geoprocessing tool and run it using the parameters outlined below. For each tracked user, it will set the End Time to be the next Start Time value in chronological order. This will allow us to only show the current location of every user at any point in time in our animation.

Now that the two date fields have been populated, we need to enable time on our feature layer. Open the Properties for your feature layer and select the Time tab. Set the Layer Time to be “Each feature has start and end time fields”. Set the Start Time Field to “Start Time”. Set the End Time Field as “End Time” and then click OK.

Next, in the Time ribbon, configure the Current Time by setting the Span to 0 and locking it. You may want to configure the Full Extent based on your dataset.

Creating the animation
Now that our layer is time-enabled, we can create our first animation. This animation is going to show last known locations at any point in time. First, under the View ribbon, in the Animation section, click Add.

Use the time-slider on the map to show the first time-range by scrolling it all the way to the left.

Then, in the Animation Timeline click Create first keyframe. You should see the animation properties (if you don’t, right click on the keyframe and select Animation Properties) that looks similar to the following screenshot.

Next, use the time-slider on the map to show the last time range by scrolling it all the way to right.

Then, in the Animation Timeline click Append next keyframe. You should see animation properties similar to the following screenshot. If you want the animation to be longer or shorter, you can adjust the Time value.

Now you should have a working animation. It may make sense to overlay the current time as the animation progresses. To do this, select the Map Time overlay.

Then, in the animation properties, edit the text so that it only shows a single date. Make sure the overlay is displayed for both the first and second keyframe by setting the Start Key to 1 and the End Key to 2.

Finally, you can export your animation as movie, gif, or other formats. In the Animation ribbon, under the Export section click Movie. Then fill out the options based on your needs and click export. Once it is completed, you can open your animation in Windows Media Player, or in a browser for viewing.

Animating all the tracks
If you wanted to create an animation of all the historical tracks over time, you can do that with just a few minor changes.
- For your feature layer, configure the Time to be Each feature has a single time field and set the Time Field to “Start Time”.
- In the Time ribbon, unlock the Span and set the Number of steps to a value that makes sense for your data.
- Then create a new animation using the same steps as above. Make sure that the second keyframe includes the full time-range of data
It’s also possible to animate tracks in a 3D scene! The following video shows a hike in New Hampshire.
Summary and additional resources
As you may have noticed, there are a lot of options to consider when creating an animation. We just went through some of the basics to highlight how tracks can be re-played. Here are some additional resources:


Article Discussion: