Drone Imagery in Microsoft Apps
Sharing your drone derived imagery products is an important part of the imagery workflow. While it is quite easy to create maps and web apps in ArcGIS Online, the ArcGIS suite also lets you meet your stake holders directly in the apps they work and collaborate in, like Microsoft Teams, Microsoft Power BI, or Microsoft Excel. Drone data adds context and perspective to the information in these apps. Specifically, your drone data can be easily accessible to show change over time, highlight important hazards and features, or add a beautiful but accurate backdrop to your data and conversations. In this article I will show you how you can bring your crucial imagery to the people that need to see it.
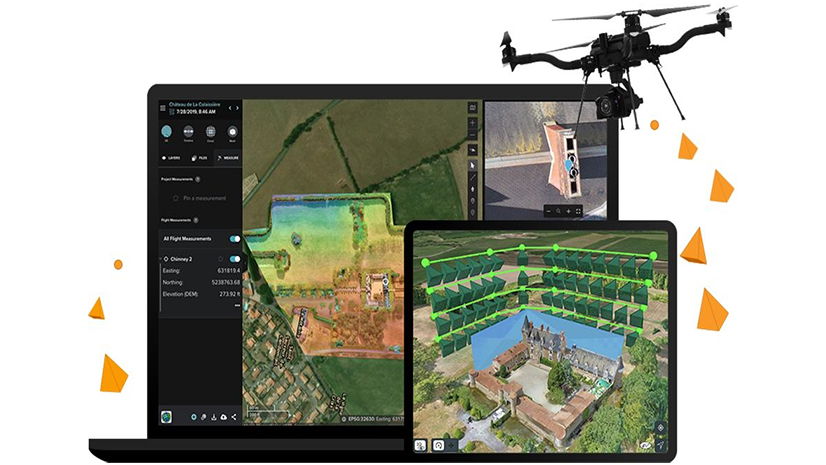
Site Scan for ArcGIS
If you are unfamiliar with Site Scan for ArcGIS it is an end-to-end cloud-based drone mapping software for collection, processing, and analysis. All processing takes place in an autoscaling cloud environment that creates high quality 2D and 3D imagery products. You can learn more about Site Scan here. Site Scan connects to the rest of the ArcGIS Environment (ArcGIS Online and ArcGIS Enterprise) with just a few clicks. David Ozer explains the process very well in his article here.
Data used in this example
I will use a real estate example to highlight the capabilities of each app and the drone data, but the concepts can be applied to any industry. The dataset I am using is of the Packing District shopping center. We captured it with an Astro from Freefly. Freefly is an U.S. based drone manufacturer that makes powerful vehicles. I encourage you to check them out if you are considering starting a drone program. Now let’s view how you can explore and share your drone imagery through these common Microsoft apps.
Drone data adds context to Microsoft Teams
Many organizations use Teams as a platform for communication and collaboration. For example, at Esri, I use the Teams chat feature to send messages to my colleagues without the formality of writing an email. Sharing your Site Scan products and data can work in much the same way. ArcGIS for Teams allows you to share your ArcGIS maps and scenes through a chat message or as something more organized and authoritative through specific channels or tabs. If you do not have access to ArcGIS for teams Rebekah Folsom wrote a great article about how to get started here.

If I don’t want to make something formal or authoritative, I can quickly message my team the scene through the chat to show them what I am working on.

Drone data adds context to Microsoft Power BI
ArcGIS for Power BI brings Esri maps and data straight into a Power BI dashboard. Markedly, one of Power BI’s strengths is having up-to-date information and metrics in an easily viewable format. Oftentimes the information shown through Power BI across your team is time sensitive and critical. Drone data can be collected ad hoc and when you need it to be displayed alongside your latest tabular data. This is what makes drones and Power BI go hand and hand.
As a Power BI user the ArcGIS widget is already available to you without installation. You can simply add the widget to any dashboard you are creating. You can learn more about access here. Without an ArcGIS account you can add Living Atlas data and base maps straight into Power BI. However, with an ArcGIS subscription you can access all your data stored in ArcGIS Online as reference layers. Site Scan exports processed images straight to ArcGIS Online and by extension Power BI. First you add the ArcGIS widget to a dashboard. Secondly, enrich it with some georeferenced data (in my case parcel data.) Finally add layers from ArcGIS Online for reference. You can see the drone imagery adds essential context to the real estate data.

Parcels can be clicked to gain important metadata from popups.

Drone imagery viewed inside a Power BI dashboard gives team members that work primarily in Power BI extra insights. Some details cant be seen any other way than through aerial snapshots. For example, the progress of a construction site.

Drone data adds context to Microsoft Excel
Drone imagery can add beautiful context to your tabular data in Microsoft excel with the Esri add-in ArcGIS for Excel. As with other GIS data it can be added to Excel through the Esri add-in ArcGIS for Excel. In this example we have an Excel table featuring the real estate data from earlier. ArcGIS for Excel allows you to work with your spreadsheets and GIS data from ArcGIS Online seamlessly, including the drone imagery from the Packing District. In addition, ArcGIS for Excel enables you to view the parcel’s latitude and longitude data from the spreadsheet as points on a map within Excel. In this case, large points are set to symbolize the parcels with higher sales values. Meanwhile, different colors symbolize each parcel shape based on ownership. Finally, the beautiful drone imagery is shown below as a timely and detailed base map.

Important attributes like tenants, sale price and rent can be viewed in pop ups alongside the imagery.

The real value of bringing your drone data into excel can be seen through zooming in and seeing the progress and details of the construction site.

ArcGIS offers a seamless path to collect, process, and share your drone imagery. Microsoft apps are ubiquitous at most organizations. Drone data adds context to these important apps. To sum up, sharing your hard collected imagery through Microsoft apps can add a new perspective and context that your team members never knew they needed.


Article Discussion: