Get the latest Demographic Data for the US for your local and on-premises use now! Here are the highlights of the data update:
Updated Demographics:
2019/2024 US demographics including population, households, income, age, ethnicity, and more. These Updated demographics from Esri include current year estimates and 5-year projections of the US demographic data. Below are some key new additions to this data:
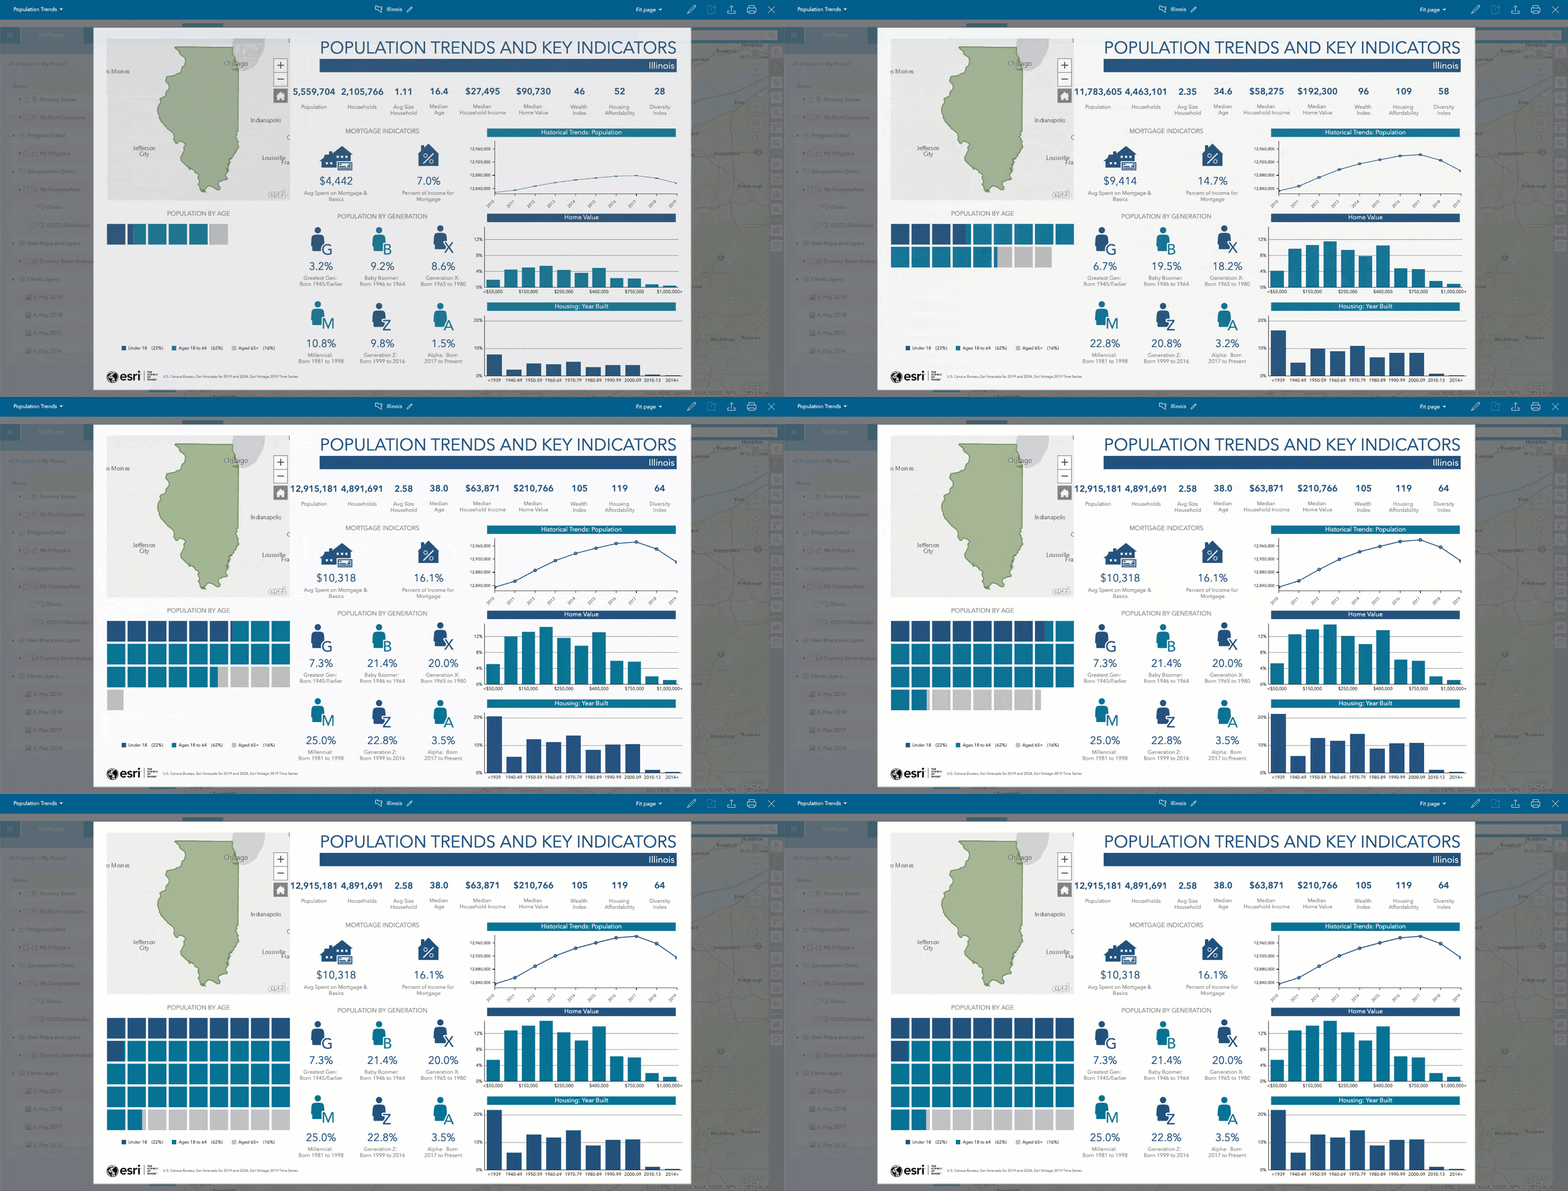
- Historical data: Many Business Analyst users have asked for the ability to use historical data in their workflows. We listened, and we’re excited to bring this feature to you. Access historical data for the US population, households, and housing units from 2010 through 2019. With this, you can easily create infographics, charts, or maps to understand demographic trends in an area.

- New variables on life-stage and dependency that represent ratios of children and seniors to the working population.
- New Wealth Index which represents the affluence of the area relative to the national level. Values exceeding 100 represent above-average wealth.
- New housing affordability index that quantifies the ability of a typical resident to purchase an existing home in an area. It is the financial ability to purchase a home and is largely driven by the gap between household income and home value.
- Updated Housing variables, such as, home value, tenure (owner/renter), vacant units and housing affordability.

Consumer Spending:
Esri’s five-year forecast of Consumer Spending provides an indication of future spending for consumer products and services five years out.
- 2019/2024 Consumer Spending – incorporates the latest Consumer Expenditure Surveys (CEX), 2016-2017, from the Bureau of Labor Statistics (BLS).
- New with this release are the five-year forecasts of Consumer Spending data
Tapestry Segmentation:
Tapestry segmentation provides an accurate, detailed description of America’s neighborhoods—divided into 67 distinctive segments.
- Esri’s 2019 Tapestry segmentation has been updated with latest demographic estimates.
Market Potential:
Esri’s U.S. Market Potential data provides details about the products and services consumers want and the civic attitudes in multiple categories.
- 2019 Market Potential data has been updated with the 2018 GfK MRI survey data.
Business Locations and Summary:
Data on more than 13 million businesses including name and location, industrial classification code, number of employees, and sales sourced from Infogroup.
- 2019 business locations have been updated with Infogroup’s April 2019 data.
- 2019 business summary has been updated with 2019 Infogroup business data from January 2019 summarized by SIC and NAICS categories.
American Community Survey (ACS) Data:
- 2013-2017 ACS 5-year Estimates – includes new topics: Class of Worker, Gross Rent, Number of Earners, Computers & Internet Subscriptions.
Download this data update for Business Analyst Desktop and Enterprise from my.esri.com. You need to be current on maintenance for Business Analyst products to get the download.


Commenting is not enabled for this article.