ArcGIS Business Analyst has a new geoprocessing tool. Generate Grids and Hexagons, released with ArcGIS Pro 3.0, allows you to do the following:
- Create grid cells (squares, hexagons, or H3 hexagons)
- Create boundaries around the grid cell centroids
- Enrich the boundaries (walk times, buffers, and so on.) with any number of data variables
- Join the data variables back to the grid cells
Here is a brief video that shows grid building and data aggregating, then takes the scenario a bit further to show site scoring in action for the Milwaukee area. Check it out.
Prior to our tool development, our colleague Dennis Jarrard created a geoprocessing model and really cool story that accomplishes much of this scenario. The new tool simplifies the process in ArcGIS Business Analyst Pro.
Grid building and site scoring
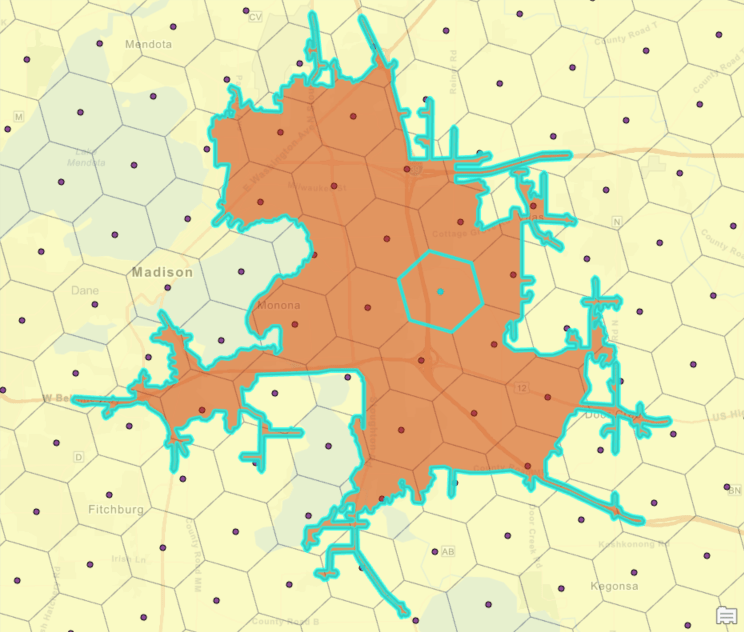
To illustrate some of the concepts shown in the video, here is an example of one selected grid cell with a 10-minute drive time boundary around it. A similar boundary is created for all cells and used to enrich data to them.
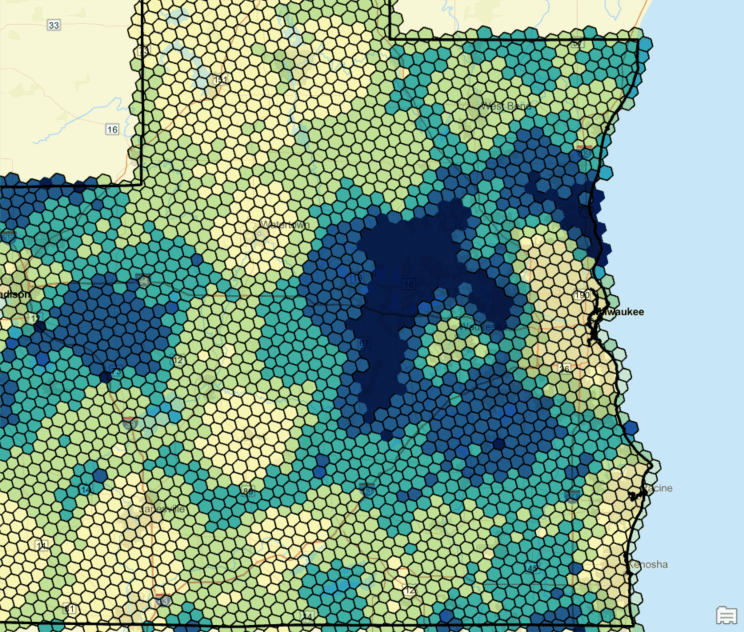
You can create a grid surface of any size and visualize data for “reachable areas” around the grid cells, not just the grids cells (which can often be too small for meaningful demographic analysis). For example, the map below shows Uber H3 grid cells in the Milwaukee area with concentrations of household spending on traveling. Each cell represents a 10-minute drive time around each grid center.
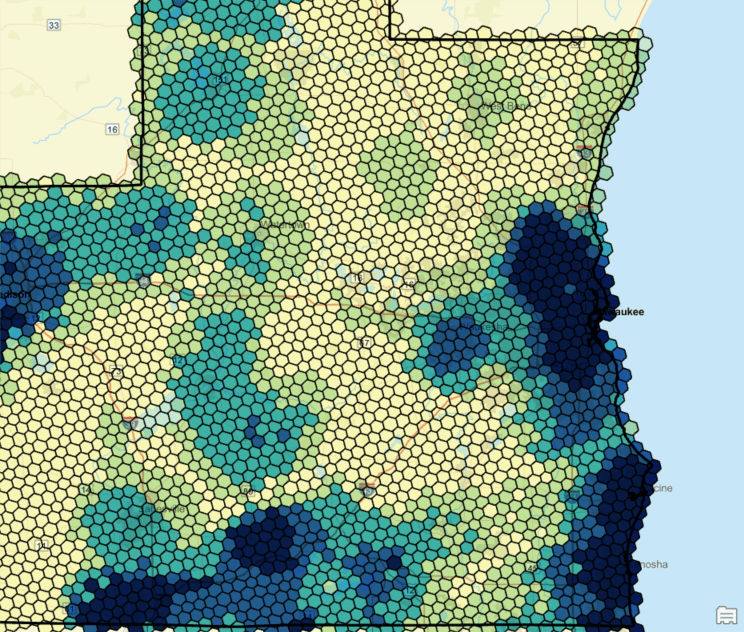
Here is the same area, but with a different data variable showing Esri’s Diversity Index (it’s a totally different spatial story). Any number of variables can be enriched. This includes demographic data from Esri, or any proprietary variable from an organization, such as quarterly sales, customer analytics, or crime stats.
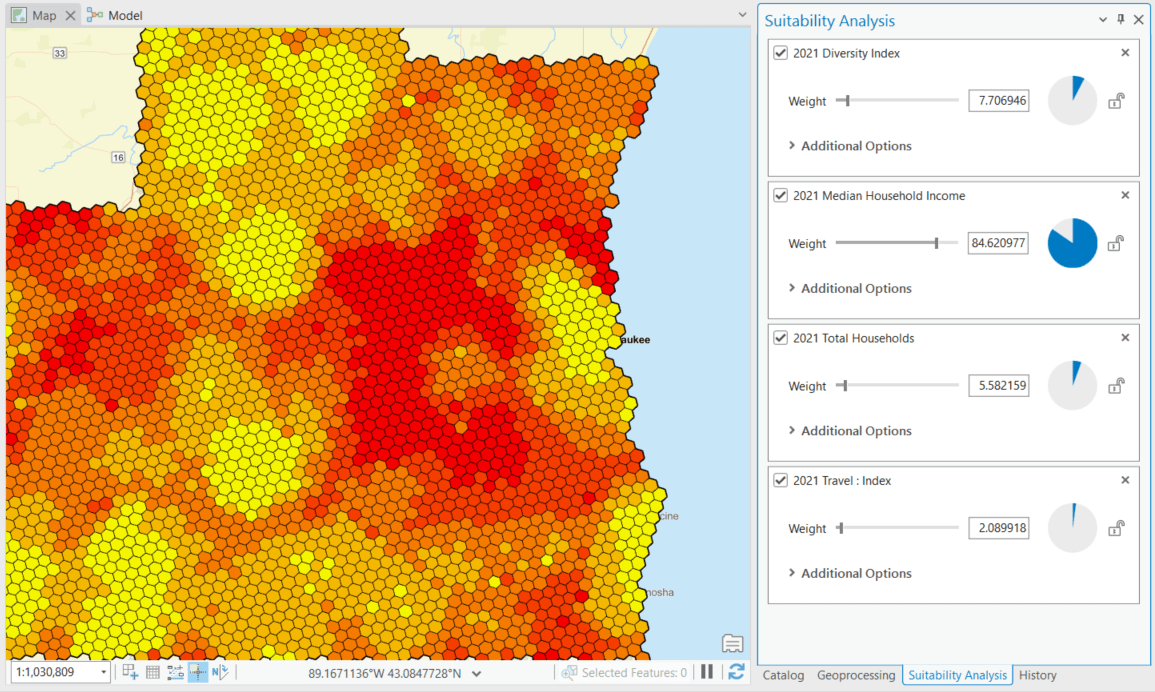
This resulting layer can be used in Suitability Analysis to input multiple grid cell data variables into one combined index value. The index value can then be used to rank grid locations across a region, country, or the world. In the example below, the input grid variables are weighted to show one main value, such as a score or rank. The highest concentrations of ranked cells can lead to decision-making on where to locate a clinic or what demographic is trending in an area.
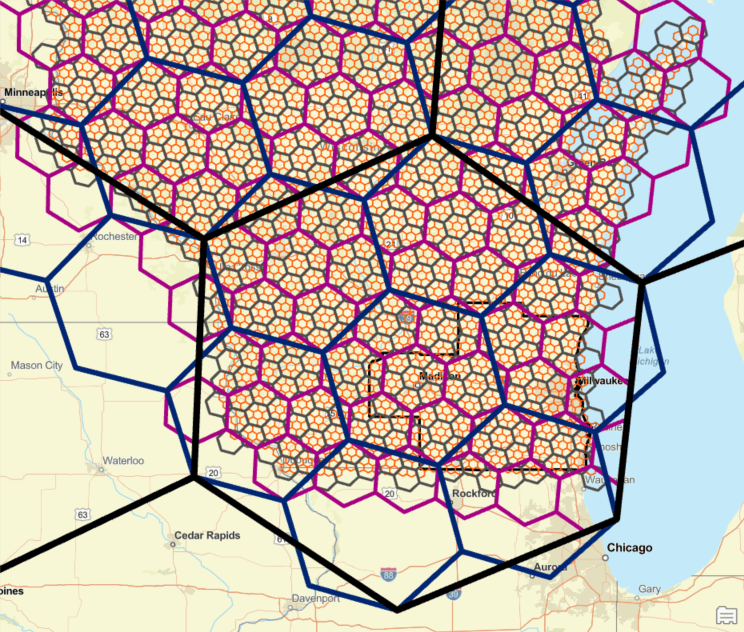
Circling back to grid cell options, Generate Grids and Hexagons uses standard square and hexagon grid options that are also found in the Generate Tessellation tool. However the addition of Uber’s open source H3 hexagons makes grid management smart with multiple levels.
Here are several H3 hexagon levels over Wisconsin, where each layer nests over one another to form adjacent boundaries. Grid cells on the same level never overlap – even when processed independently.
The use cases of this workflow are limitless for any discipline or industry. Dennis showed a market evaluation example. The video shows a site selection example. It can be used in healthcare, banking, retail, or forestry. Our Chief Scientist Dawn Wright thinks this could be used to understand coastlines. In the future, we’d like your thoughts if this tool should be included as a core ArcGIS Pro tool.
Article Discussion: