ArcGIS Velocity allows organizations to ingest, visualize, analyze, and act on data from sensors and asset tracks. It also enables processing of high-volume historical data to gain insights into patterns, trends, and anomalies. Remote monitoring of assets, predictive maintenance, and process optimization are just a few of the benefits you can gain from your sensor and IoT (Internet of Things) data using Velocity.
ArcGIS Velocity is updated regularly, below are several highlights of the November 2022 release:
- Feeds, data sources, and outputs – Ingest data from a broader set of third-party APIs, including PurpleAir and OpenSky.
- Analytics – The Calculate Field and Map Fields tools, in your real-time and big data analytics, were enhanced to support track functions via Arcade.
- Data management and visualization – Enhancements to Z value handling and 3D geometries for storage and visualization of your 3D data.
Now, let’s take a deeper dive into each of these and other new capabilities and enhancements!
Feeds, data sources, and outputs
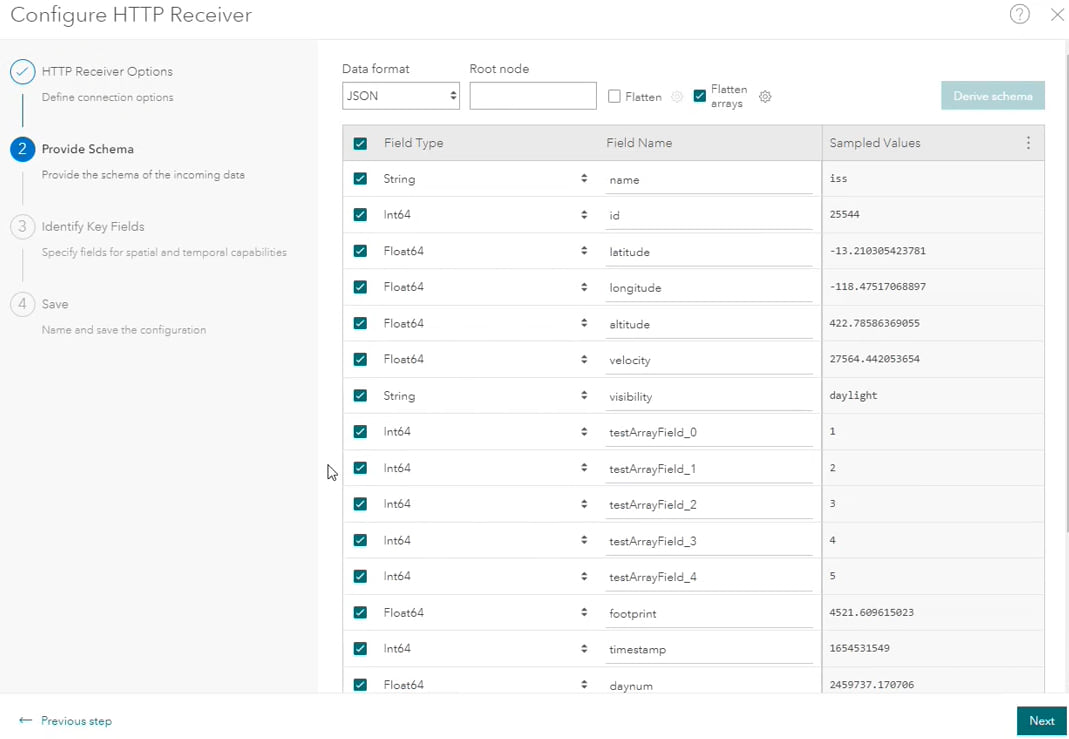
With this release, ArcGIS Velocity is now able to work with and ingest data from a broader set of third-party APIs, including PurpleAir and OpenSky. This is possible through added support in the JSON data format for parsing of array structures including the ability to ingest array objects as features, flatten array objects into fields, exempt certain arrays from flattening, and specify arrays as root nodes. This was only possible in the past using complex Arcade expressions, but now you can parse arrays when defining the schema of the incoming data.

In addition, the HTTP Poller feed type now allows you to configure global variables in the POST body, expanding the options of APIs you can work with in Velocity. As an example, many APIs require you to have from and to dates to interact with them, to do things like get data from one date to another.
Prior to this release, you’ve been able to write data to Velocity feature layers that are backed by the spatiotemporal data store as well as write to ArcGIS Online hosted feature layers. With this release, the feature layer outputs, Feature Layer (new) and Feature Layer (existing), allow you to write data to your ArcGIS Server feature layers, allowing you to ingest data from external sources and store it in your own environment. One of the key benefits of this is enabling the ingestion of real-time data via cloud services but storing more sensitive data directly into on-premises environments.
When capturing output data to ArcGIS Online hosted feature layers, in previous releases you may have encountered an analytic validation error if your input feed exceeded the 2 events/second restriction. At this release, that error message is adapted to a warning message. This allows your real-time analytics to be used to filter or otherwise reduce the data rate when you are storing to Online hosted layers.
And lastly, for those of you at the Dedicated license level, you can now view how much compute a feed is consuming directly on the feed details page.
Analytics
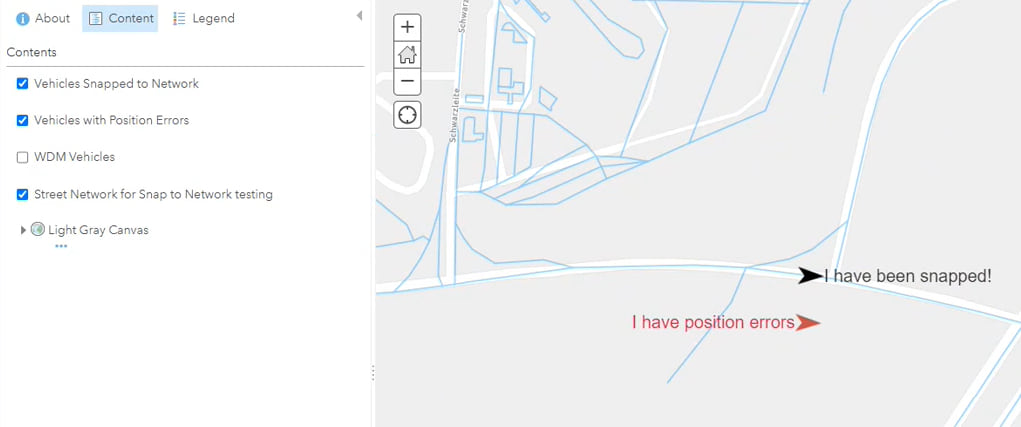
With this release several analytic tools and capabilities were enhanced. First, the Snap to Network tool is now supported for real-time analytics. This significantly improves the visualization of all your moving assets such as vehicles and personnel. For example, say you have a public facing app that displays city buses on a map. In many cases the bus’s reported location may differ slightly from the road it is traveling, making the buses appear on the map as if they are not on the road. Using the enhanced Snap to Network tool at this release, the bus locations can now be snapped, in real-time, to the underlying road network so they align to the actual road feature.

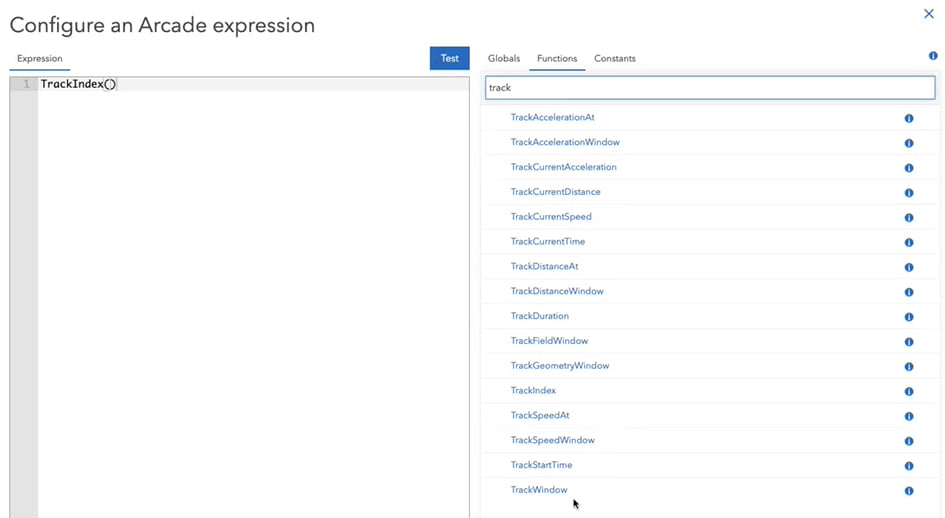
In addition, the Calculate Field and Map Fields tools, in your real-time and big data analytics, were enhanced to support track functions via Arcade. This gives you the ability to build your own expression logic using Arcade expressions to solve use cases such as calculating moving averages, statistics, accessing past observations for a track, and more – on any attributes and geometry of your data. For more information on the supported track functions and additional details, see Use track functions.

Another analytic enhancement is run settings for non-scheduled big data analytics. When choosing the runs once option for a big data analytic, in the Standard and Advanced license levels, you can now select a larger compute run setting, making it easier for you to run one-time jobs that load large volumes of data.
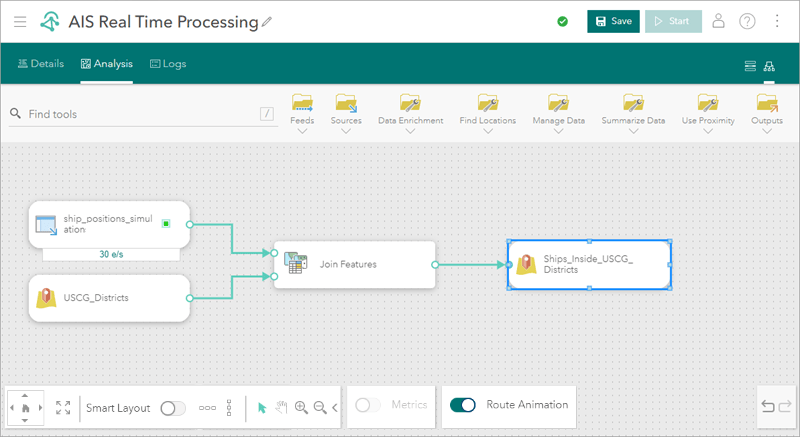
And lastly, when working with analytics, the analytic editor now defaults to the model view, making it easier to author analytics that have multiple processing branches.

Data management and visualization
One small, but exciting enhancement around visualization was the improvements to Z value handling and 3D geometries for storage and visualization of your 3D data.
And more…
For a complete list of enhancements and everything new, check out the What’s new topic in the documentation. If you have ideas/enhancements/feature requests for the product, be sure to post them on the ArcGIS Velocity Ideas board in the Esri Community.
To learn more about ArcGIS Velocity, browse the available resources to access product videos, quick lessons, documentation, and more!

Article Discussion: