ArcGIS Velocity is the real-time extension for ArcGIS Online, enabling organizations to ingest, visualize, analyze, and act on data from sensors and asset tracks. It also enables processing of high-volume historical data to gain insights into patterns, trends, and anomalies. Tracking assets such as vehicles and fleets for a current view on operations, analyzing personnel movement to ensure safety, and monitoring changing conditions for more informed decisions are just a few of the benefits you can gain from your sensor and Internet of Things (IoT) data using Velocity.
ArcGIS Velocity is updated regularly, below are several highlights of the February 2025 release:
- Feeds
- Enhance your real-time flight tracking capabilities by accessing comprehensive, up-to-the-minute airborne aircraft data through the FlightAware Firehose API with the FlightAware (Airborne) feed type.
- Optimize your ground operations by accessing detailed, real-time surface movement data through the FlightAware Firehose API with the FlightAware (Surface) feed type.
- Enrich analysis and decision–making by connecting to highly accurate and timely weather data from Baron Weather with the Baron Weather feed type.
- Outputs
- Streamline notifications with the new Microsoft Teams output type.
- Speed up decisions by reducing the latency of alerts with the Slack output type.
- Analytics
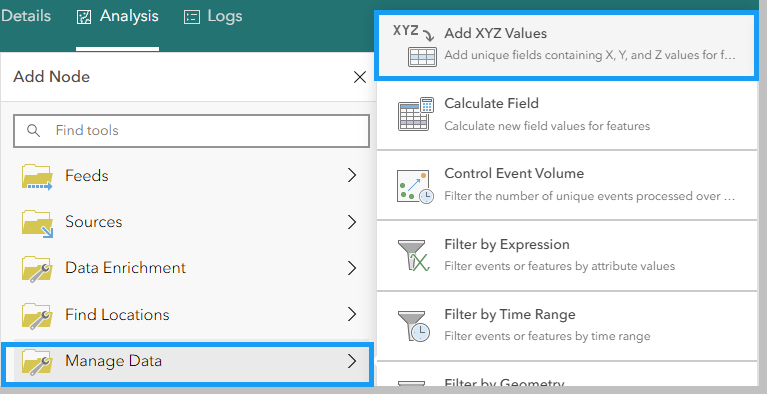
- Improve analysis workflows by extracting coordinates into new fields from point features using the Add XYZ Values tool.
- General
- Explore the other enhancements and bug fixes in this release with a complete list of what’s new.
Now, let us take a deeper dive into each of these and other new capabilities and enhancements in this release!
Feeds
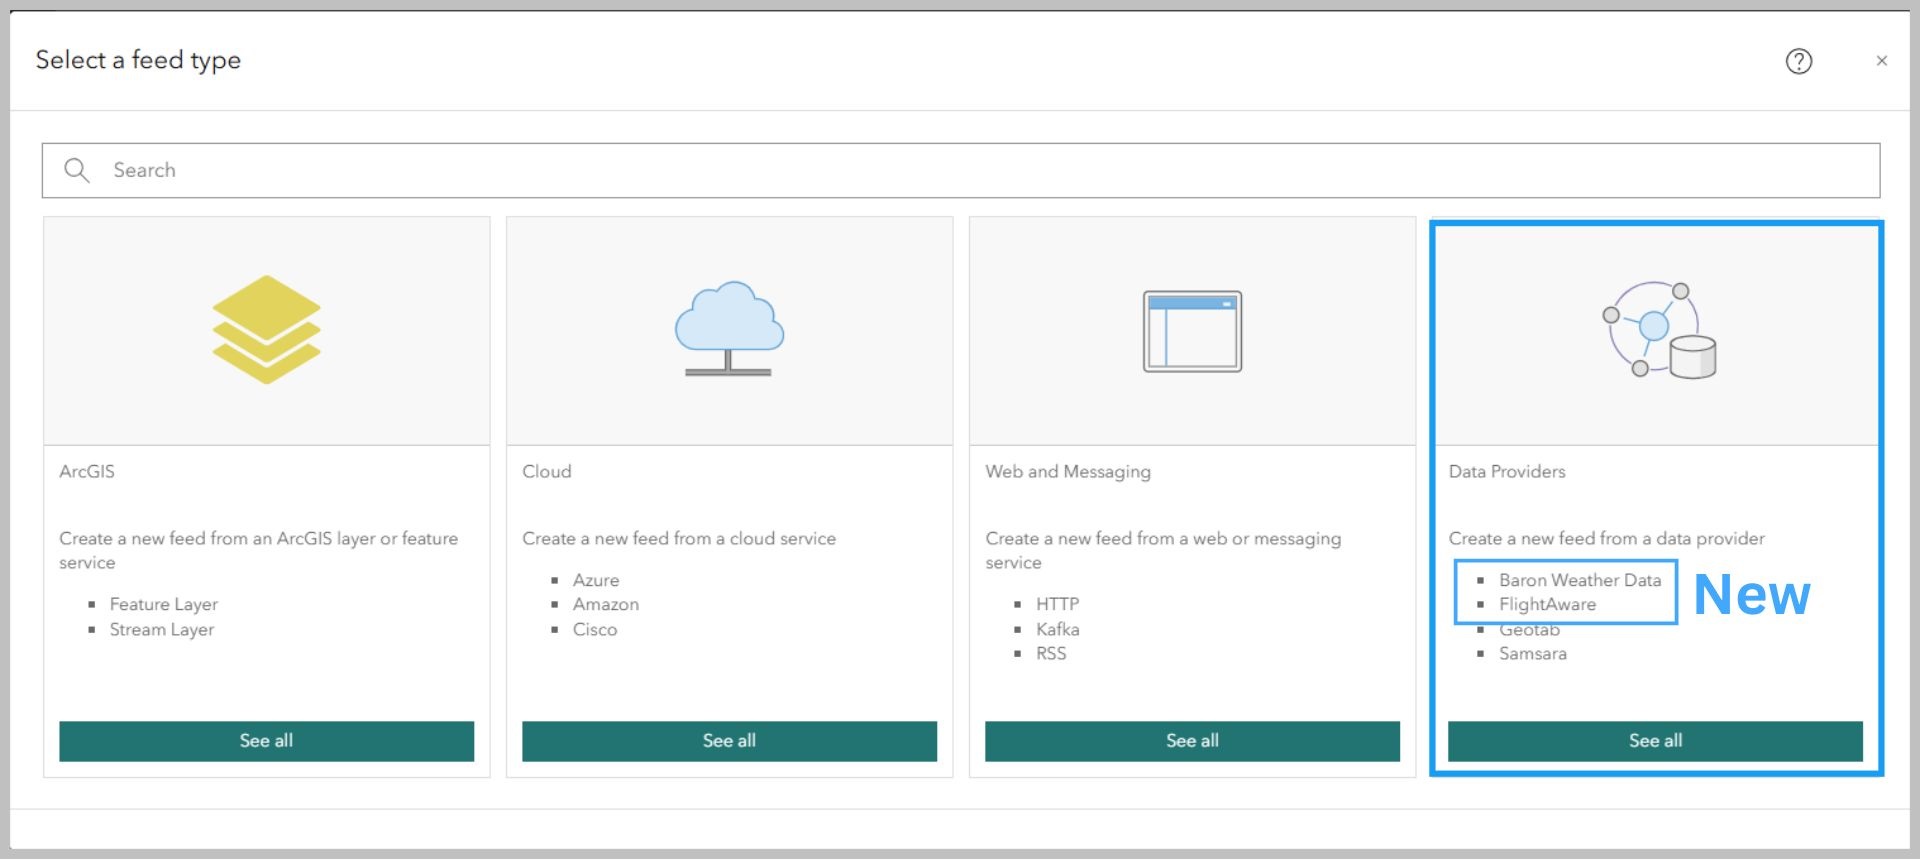
Add flight-related insights to your analytics using the FlightAware feed types
FlightAware feed types in Velocity connect to the FlightAware Firehose API to receive data related to flight positions, flight status data, and surface movement positions. FlightAware feed offers two new out-of-the-box box feed types, the FlightAware (Airborne) and FlightAware (Surface) feeds. You may be wondering why Velocity is offering two different feed types and what is the difference between the two? Although both connect to the same Firehose API, the key distinction is whether you are focused on in-flight aircraft tracking or optimizing airport operations.
With the FlightAware (Airborne) feed, Velocity connects to FlightAware’s Firehose API to provide information about planes that are flying in the sky. It helps you understand where they are, how high they are, and how fast they are moving. This feed also provides flight status information, including flight details and departure and arrival messages. Getting this feed into your analytics provides enhanced visibility into flight operations with the ability to track arrivals and departures, cancellations, flight information, hold entry, hold exit, power on, surface on, surface offblock, and more dependent on the details of your FlightAware subscription.
Similarly, the FlightAware (Surface) feed connects to FlightAware’s Firehose API to access data, however, this data is specific to surface movement positions of vehicles and aircraft. It provides information about where they are positioned at the airport, such as if they are taxiing to the runway or parked at a gate. By incorporating surface position data, analysts can make informed decisions based on the current position of aircraft on the tarmac and their proximity to designated arrival or departure airports. Additionally, alerts can be configured based on analysis with other real-time data, such as lightning strikes and vehicle positions. Connect to this feed to track the vehicle and aircraft positions on the ground, near surface positions, location entry, and location exit events.
If you are just getting started and want more information on supported event type schemas and field definitions, go to FlightAware documentation. If you are a current FlightAware customer, you can get started using FlightAware feeds in Velocity by logging in to the FlightAware URL and creating the feed. For more details, go to FlightAware (Airborne) and FlightAware (Surface) documentation. If you are interested in learning more, explore our blog that discusses how FlightAware’s integration in ArcGIS Velocity helps monitor emergency response during incidents like the Palisades fire.
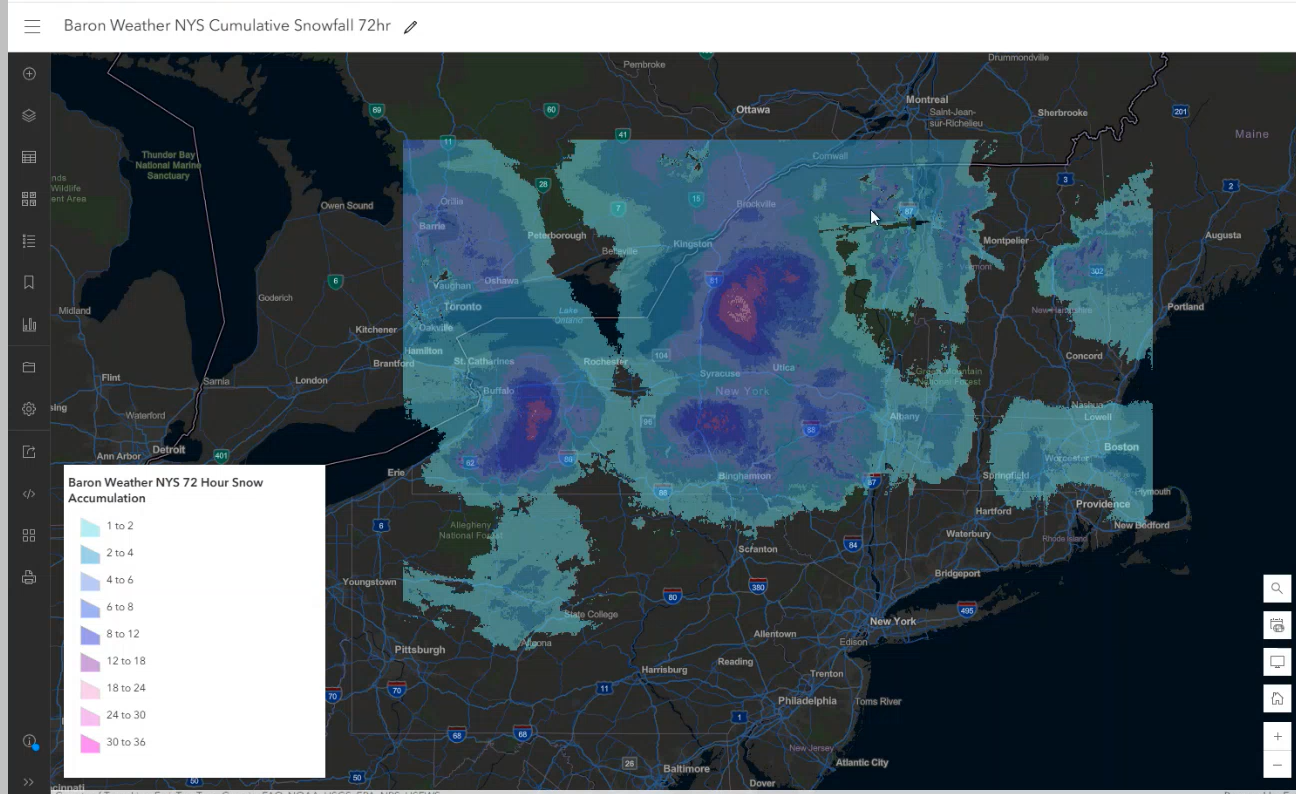
Add hyper-local weather data for increased detail to your maps and analysis using the Baron Weather feed
With the new Baron Weather feed type, Baron Weather customers can quickly import reliable weather and meteorological data in Velocity that is higher resolution than what is available from the weather service.
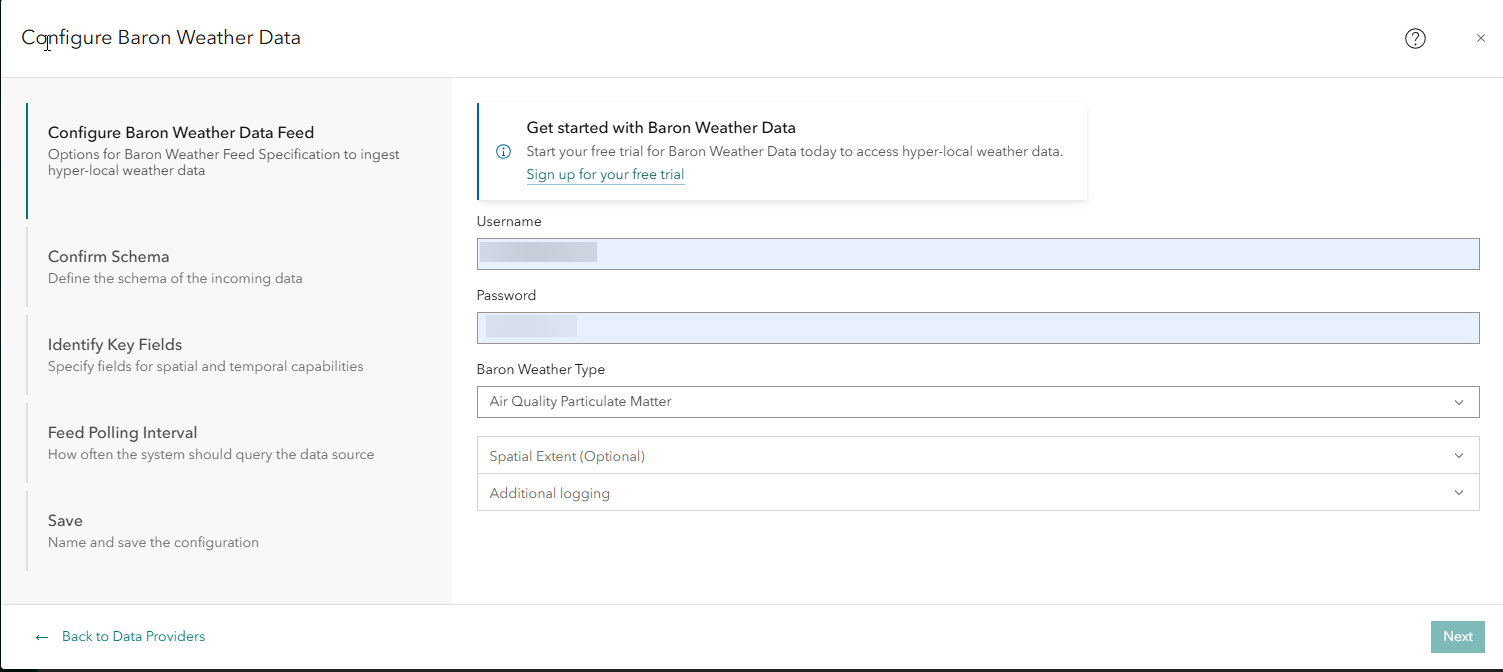
The Baron Weather feed type currently supports 21 data feeds. Enhance safety and success by monitoring your assets or events with Baron’s advanced severe weather tracking capabilities, including nationwide radar, satellite, and patented storm tracking data. Utilize Baron’s extensive weather datasets alongside your existing spatial data to limit extreme weather impacts on your organization.
Interested in incorporating hyperlocal real-time weather data into your Velocity-enabled applications? Test out the data with a free 30-day trial from Baron.
Outputs
Streamlining automated notifications with Adaptive Cards in Microsoft Teams for interactive notifications
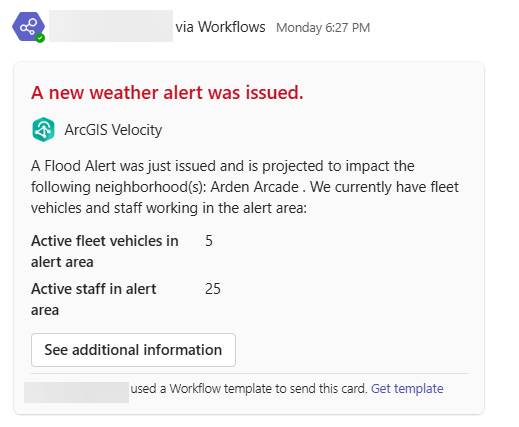
While notifications are sent via SMS or SMTP, platforms like Teams and Slack have become the primary communication channels in the office environment. Organizations are increasingly relying on these platforms for critical communications and building workflows. Receiving notifications, such as severe weather updates through Teams and Slack represents a huge shift in our notification system and how we stay informed. By using the Microsoft Teams output in Velocity, you can get those weather and operation-related notifications right in your organizations preferred communication channel, reducing the need to switch between channels.
The Microsoft Teams output makes it easy to generate and send Adaptive Cards. Adaptive Cards are rich interactive messages that can contain text, graphics, and buttons, providing a dynamic way to share information. You can incorporate feature data from real-time and big data analytics into Adaptive Cards, which are then posted to Microsoft Teams.
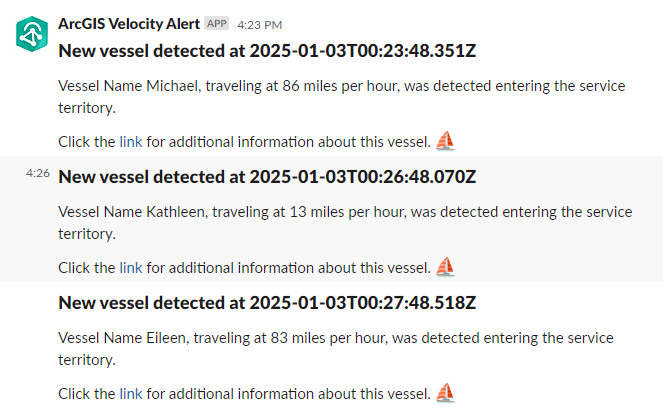
Shorten the time from analysis to action with Slack outputs and interactive features
Similar to the output support for Microsoft Teams, there is now the ability to send messages directly to Slack channels within your organization, making communication more dynamic and user-friendly. Slack supports messages with text, graphics, and interactive buttons. Additionally, users can incorporate feature data within their messages, allowing for the seamless sharing of critical information in real-time.
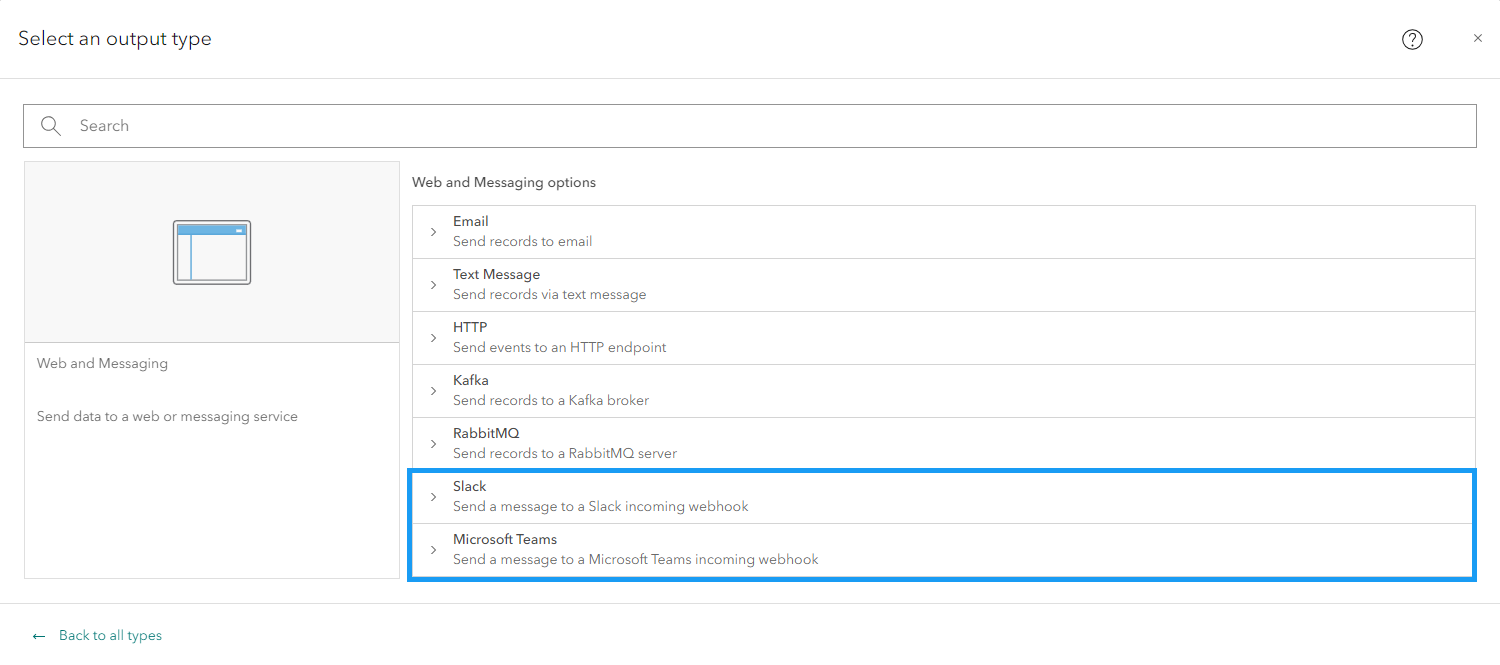
Setting up Microsoft Teams or Slack output in Velocity is straightforward; you will need to generate a webhook URL in Microsoft Teams or Slack, which can be configured in Velocity. To add the Microsoft Teams or Slack output to your analytics go to Outputs > Web Messaging, then choose Microsoft Teams or Slack.
More details on configuring the new outputs, check out the JSON examples provided in the Microsoft Teams and Slack documentation!
Analytics
Streamline downstream analysis with new support for coordinate attributes
The Add XYZ Values tool takes feature locations and pulls out coordinate values into new, individual fields: x-value (longitude), y-value (latitude), and z-value (elevation). These coordinate values being stored as individual attributes enhance downstream analytics, visualizations, and communications. For example, coordinate attributes can define classification and symbolization within Web Maps, drive dynamic URL parameters for application access unique to an individual, along with making coordinate values more easily available in analytic joins and filters.
General
For more information, check out the what’s new topic in the documentation. If you have ideas, enhancements, feature requests for the product, be sure to post them on the ArcGIS Velocity Ideas board in the Esri Community.
To learn more about Velocity, peruse all the available resources including product videos, tutorials, documentation, and more.
Upcoming events
- Coming to Esri Partner Conference or Developer & Technology Summit? Come see us!
- A live webinar about enhancing organizational safety with Watch Center. Register now!


Article Discussion: