ArcGIS StoryMaps is the professional tool for harnessing the power of maps to communicate your work using place-based storytelling. The easy-to-use builder enables you to combine maps, 3D scenes, embedded content, multimedia, and more to create an interactive narrative that can inspire interest — and action — from your readers.
Each month, our team uses community feedback to help inform new capabilities that can enhance your storytelling adventures. Check out what’s new this month!
Quick links
- Chart block updates (multi-series data and sidecar panel)
- Theme builder updates (shared theme, header customization, and block spacing)
- Categorized map tour
- Advanced script embedding
- And more…
Chart block updates
In December 2024, we introduced the Chart block, and we continue to enhance this powerful visualization tool.
Multi-series charts
You can now add up to three data series to Column, Bar, and Line charts; Donut continues to support one data series.
Sidecar panel
You can also now add charts to a Sidecar panel.
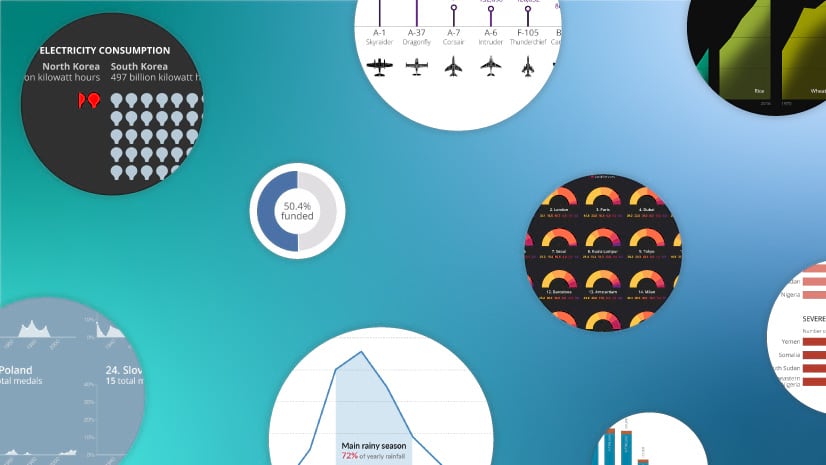
Sometimes, the most effective way to illuminate trends or patterns in your data is to chart it. Learn more about elevating your data-driven storytelling by Including charts in ArcGIS StoryMaps.

Theme builder updates
In January 2025, we added the capability to adjust your overall font size in the theme builder, and that was just the beginning of several new builder enhancements to further customize your themes!
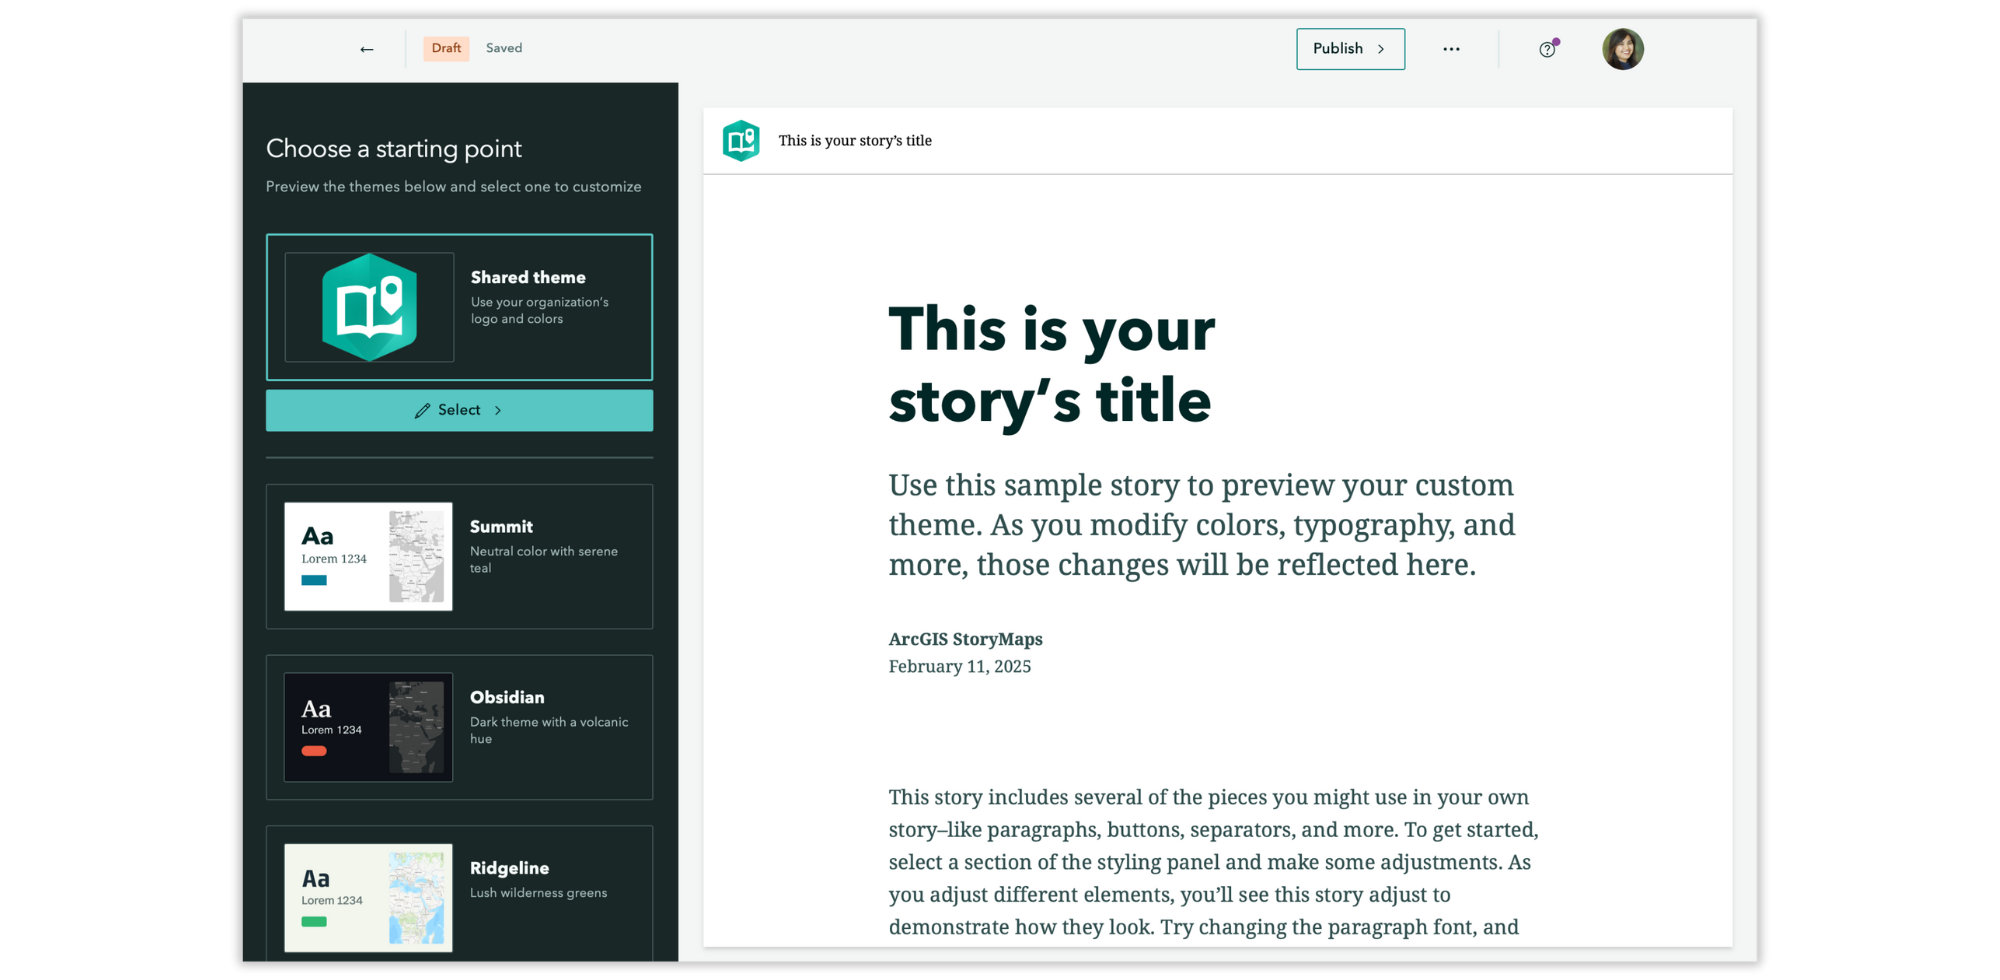
Shared theme
Organization administrators have long been able to create a shared theme to provide more consistent branding for their apps easily. And with its proven efficacy as a professional communication tool, we’re excited to share that we’ve made it even easier to apply your organizational theme to ArcGIS StoryMaps items.
A shared theme enables administrators to define a logo and colors for elements such as headers, backgrounds, buttons, and more. If your organization administrator has configured a shared theme, you will now find the shared theme as your first option to select and modify in the ArcGIS StoryMaps theme builder.
In the theme builder, you will notice that your shared theme background color is used as the theme accent color. This is to make buttons, quotes, and separators a consistent color, but it is important to note that you are able to modify these elements by selecting Use custom color.
Learn more about Managing approved StoryMaps themes for your organization.
Header customization
The theme builder now has a separate section to manage your Header customization options — and your options are expanded! In addition to your theme colors and suggested basic colors, you can also opt to choose your background and text colors using the color picker.
A secondary benefit of these expanded options is the improved theming of the navigation bar in collections. Previously, the navigation bar sometimes used a blue-green color, which may not have complemented your theme colors; the bar will now appear in your theme colors.
Block spacing
We are also happy to introduce the capability to adjust the overall Spacing of your blocks. You can now choose between Spacious and Compact styles to best suit your needs.
Creating a little world for your readers is an invitation to immerse themselves in an experience. Watch this video on Creating your own custom theme and then check out these Nine steps to great storytelling.
Categorized map tour
If you’ve been around a while, you’ll remember the Story Map Shortlist template available in the classic version of ArcGIS StoryMaps. If you’re new here, you’re just in time because we are thrilled to introduce the Categorized map tour!
The Categorized map tour enables you to organize and present locations based on categories, which can help readers easily navigate larger datasets by focusing on specific points of interest, such as historical landmarks, dining spots, or nature trails, resulting in a more personalized and interactive experience.
So, how can you add a Categorized map tour to your story? It begins with a map tour and a feature layer. In the story builder, select Map tour from the Immersive block options, then select Start with a feature service. A feature service is necessary to organize your data in a manner that enables a categorized map tour, so you should complete this step before creating your tour.
We will share a blog soon that provides an in-depth look at how to create a feature layer that enables a Categorized map tour. In the meantime, revisit how to create a map tour from ArcGIS data.
After adding your feature layer, click Layout to select Categorized from the Explorer layout options. The map tour builder now displays the options to customize your categorized tour, beginning with space to add a Tour title and collapsible Tour description. Here, you will also notice that hovering over a particular category will reveal only those points on the map. From here, click Edit data source to customize your tour further:
- Data: Modify the category title, place title, and place description.
- Categories: Modify which categories are visible (up to 8), rename categories, change the symbols and their colors, and reorder categories.
- Media: Modify the image placement, attribution, alternative text, and image source.
- Filter & Sort: Modify the maximum number of places and sort by setting.
Check out A world of wonders and Public art in Kitchener, two stories from our team that feature a Categorized map tour that might just inspire you to make your own!
Advanced script embedding
You’ve always been able to embed stories using simple iframes, but this method comes along with several limitations. The new advanced embedding feature frees you from these limitations by inserting the story right into the page’s Document Object Model (DOM), which provides full access to customize the story components and content through your own CSS and JavaScript code.
Advanced embedding presents many new opportunities such as:
- Customizing the link for a story using your own domain
- Adding a branded header and footer to your story
- Replacing the font library with one of your choosing
- Presenting a splash page
To enable advanced embedding, drop down the … More options menu, select Story settings and then the Advanced tab. Here, you will need to Enable advanced embedding, add at least one domain to the Allowed domains list, and click Save. Then, Publish your story for Everyone (Public) to activate the advanced embedding. Finally, return to the builder, drop down the … More options menu, choose Embed this story, and select Script (advanced) from the Embed code menu. This is where you’ll find the magic code needed to add the story to your own web page.
The word script can be scary, but our friendly team member, Lee Bock, is here to guide you through this exciting update. Check out his blog on Introducing story embeds via script!
And more…
- Tidal theme has been updated to improve accessibility.
- Esri DevTech25 and FedGIS25 themes have been added to the Featured themes gallery.
- Table of contents for briefings now display in more neutral colors versus the bolder ArcGIS StoryMaps product colors.
Check out the release notes for more detail about other small changes and fixes released this month.
Thank you to Ashley Du and Will Hackney for their contributions to this post.
All Adobe Stock images are © 2025 Adobe Stock. All rights reserved.


Article Discussion: