ArcGIS StoryMaps is the professional tool for harnessing the power of maps to communicate your work using place-based storytelling. The easy-to-use builder enables you to combine maps, 3D scenes, embedded content, multimedia, and more to create an interactive narrative that can inspire interest — and action — from your readers.
Each month, our team uses community feedback to help inform new capabilities that can enhance your storytelling adventures. Check out what’s new this month!
Quick links
Charts
You can now level up the visual power of your story or briefing by including univariate charts to help communicate your data. Discovered a trend or pattern? Have a key finding? A well-placed chart can provide clarity, foster engagement, or even inspire decision-making from your audience. And with this feature comes built-in interactivity and accessibility typically not achieved by static charts.
Find this new addition under the Data visualization section in the builder block palette or when adding media to a Sidecar. After selecting Chart, you will have four chart types to choose from: Column, Bar, Donut, and Line. Any of these options will then bring you to Edit chart, where you will customize your chart’s Data and Settings. In the Data panel, click within the table to fill in or paste your data. In the Settings panel, customize your chart’s title and axis labels (among other options). Have a different look in mind? You can also change the chart type without losing your data here.
Once saved to your story, you can hover over the chart block to reveal options for adjusting its size or alignment; hovering over a chart data value reveals a pop-up with its axes data. Please note that the column, bar, and line chart types automatically format to your Theme color and font settings. The donut chart type formats to your font settings, but an algorithm determines a range of legible category colors for the chart.
Charts are in beta. Please let us know on Esri Community if you have any feedback or issues.
Learn more about Including charts in ArcGIS StoryMaps.
Presentation mode in briefings
Whether it’s presenting in front of thousands of people or a few key stakeholders, we are thrilled to see our storytelling community integrate briefings into their work. So, it only made sense to add the option of presentation mode to further support the impact you’re making!
After publishing your briefing, you will now find three items at the top center of your screen:
- Show table of contents: Click to reveal a left panel with the list of slides, which can be used to easily navigate your presentation or view the titles of each slide.
- Navigation arrows with slide numbers: Click to navigate through your slides and use as a reference for presentation length and progression.
- Start/End presentation mode: Click to start or end your presentation. These actions can also be completed by using the keyboard shortcut Command-Return on Mac or Ctrl-Enter on Windows.
Read how the South Carolina National Guard Boosts GIS Work with Briefings.
Issue checker
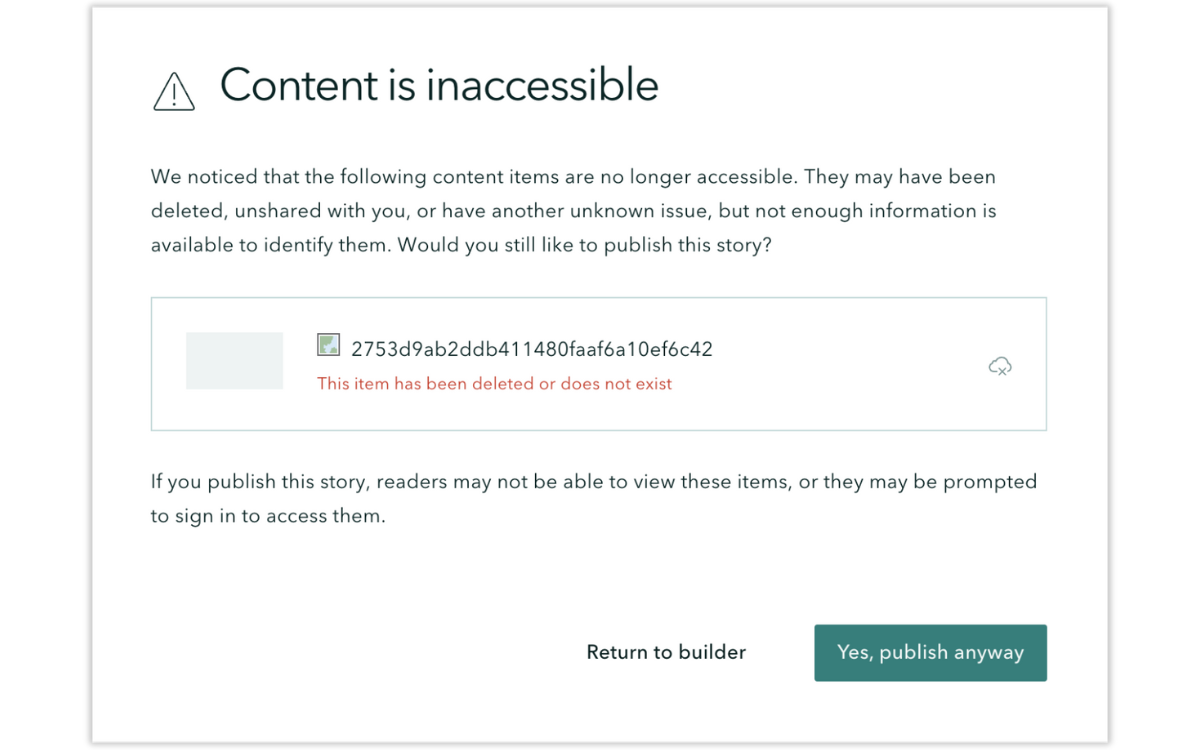
Ah, yes, we love the capability of easily integrating maps and other media into our stories and briefings, but these items also tend to come with layers of complexity that can cause unforeseen viewing issues after you’ve hit that publish button. To help you get ahead of these issues, we are excited to introduce an issue checker.
Now, after clicking to publish your story or briefing, you will be alerted if:
- A map, scene, or layer you previously added to your story or briefing has been deleted.
- A map, scene, or layer owned by someone else, which was previously shared with you, has been unshared, so you no longer have access to it (and you aren’t an admin, so you don’t have permissions to reshare it).

Ready to publish your story or briefing? Be sure nothing is detracting from all of your hard work! Read Details matter: Elevate your story with these finishing touches.
And more…
A few other updates to the ArcGIS StoryMaps builder and related tools include:
- User interface updates for data-driven map tours in the story builder that ease control, especially for tours with a lot of points
- Updated mapping capabilities with the latest version of ArcGIS Maps SDK for JavaScript
New year, new features!
Get excited with a look at what’s coming in early 2025:
- New map tour layout
- New briefing cover slide layout
- Theme updates: adjust font size and block spacing; set heading colors; and import your organization’s shared theme colors and logo
- Add transcripts for video and audio media
Thank you to Ashley Du and Will Hackney for their contributions to this post.
All Adobe Stock images are © 2024 Adobe Stock. All rights reserved.


Article Discussion: