Anyone can be an explorer. With tools like iNaturalist and ArcGIS StoryMaps, it really enables folks to explore right outside their doorstep.
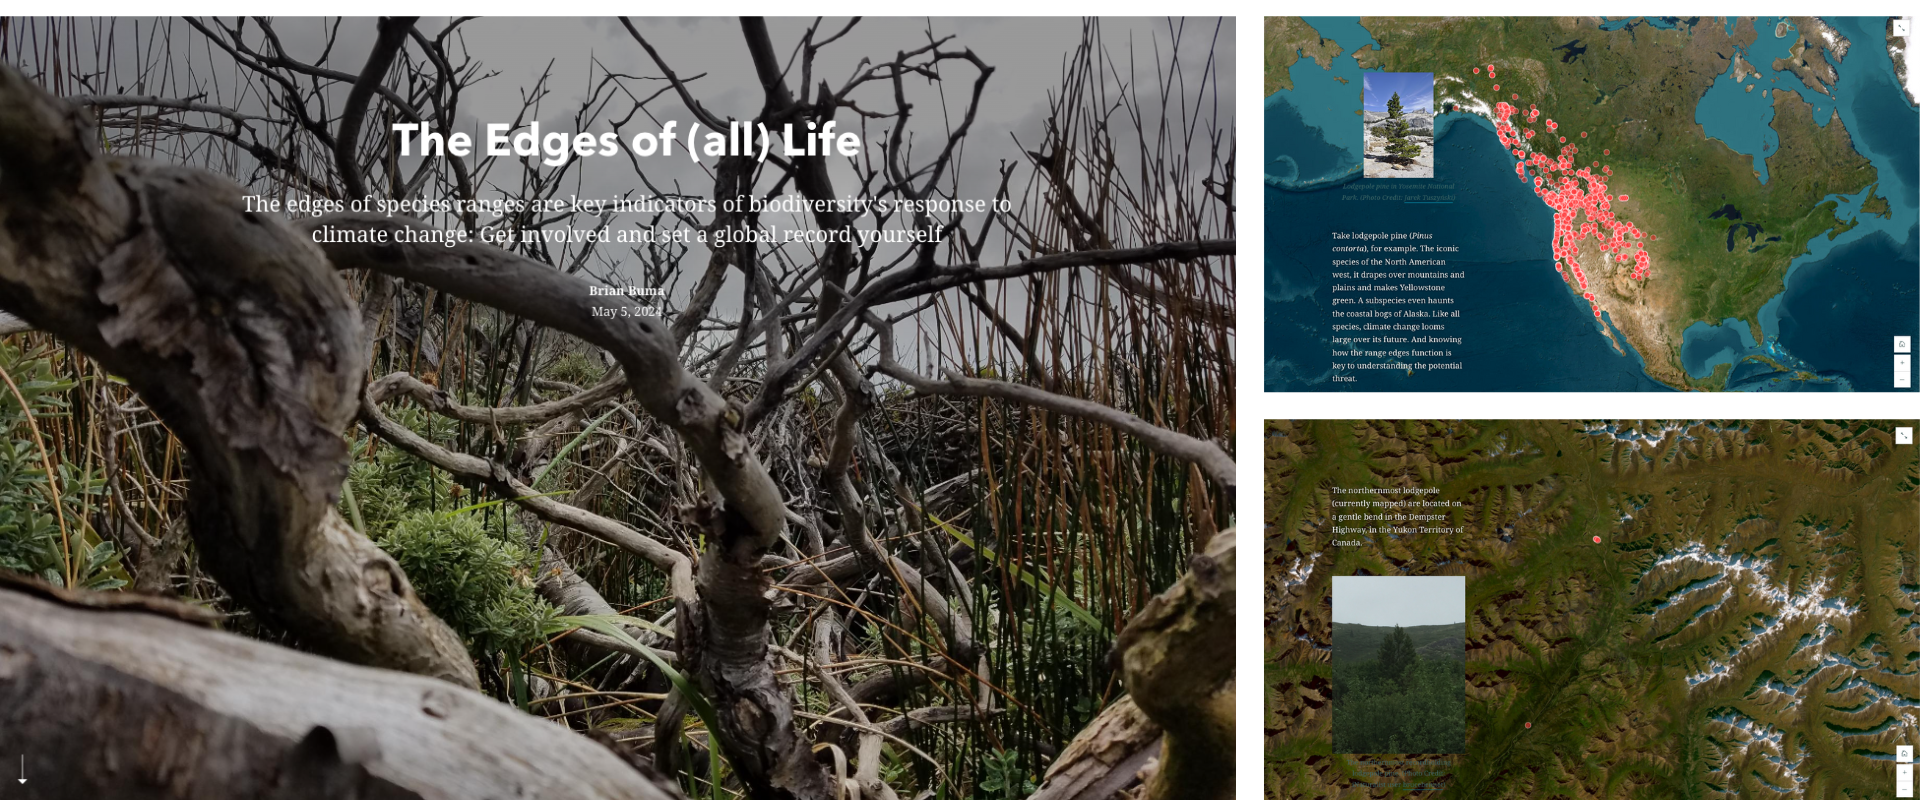
In his story, The Edges of (all) Life, Brian Buma takes us much further than our doorsteps to identify the southern- and northernmost plants, like gnarly Magellanic beeches in the Cape Horn archipelago or a lonely Arctic poppy and small green moss off the coast of Greenland. Why? While Indiana Jones did come up more than once in our conversation, his true purpose is much more real: the edges of species ranges are key indicators of biodiversity’s response to climate change.
In his roles as a Senior Climate Scientist and Director for the Climate Innovation Initiative with the Environmental Defense Fund (EDF) and Associate Professor of Research at the University of Colorado, Denver, Brian studies innovative ways to alter the trajectory of climate change. His work aims to address the ways in which we can bend the curve of feedbacks and drive new ways to limit climate change, habitat loss, and biodiversity destruction.
The StoryMaps team recently sat down with Brian to discuss using iNaturalist data and place-based storytelling to communicate his work and inspire others to help identify the edges of life. The following conversation has been edited for brevity and clarity.

Q. Thanks for sharing your experiences with us, Brian. Can you tell us a bit about your background?
A. I grew up on the edge of the woods in the Pacific Northwest, so that fostered a natural interest in wild landscapes and environmental issues. As an undergraduate, I studied biology and ecology and went on to get a master’s degree in teaching.
Q. It seems that your path didn’t end at teaching, though. What was the detour?
A. I had the opportunity to become a conservationist at the Limahuli National Tropical Botanical Gardens on the north shore of Kaua’i. Even though I grew up loving maps, my work in invasive species control and planting restoration led me to really use GIS for the first time – and it was awesome. Inspired by this work and the academic researchers who visited the gardens, I pursued a PhD in landscape ecology. I ultimately landed on wildfires and global climate change and went on to teach at the University of Alaska for several years.
Q. Wild landscapes, indeed. How did your time in Alaska inform your interest in the edges of life?
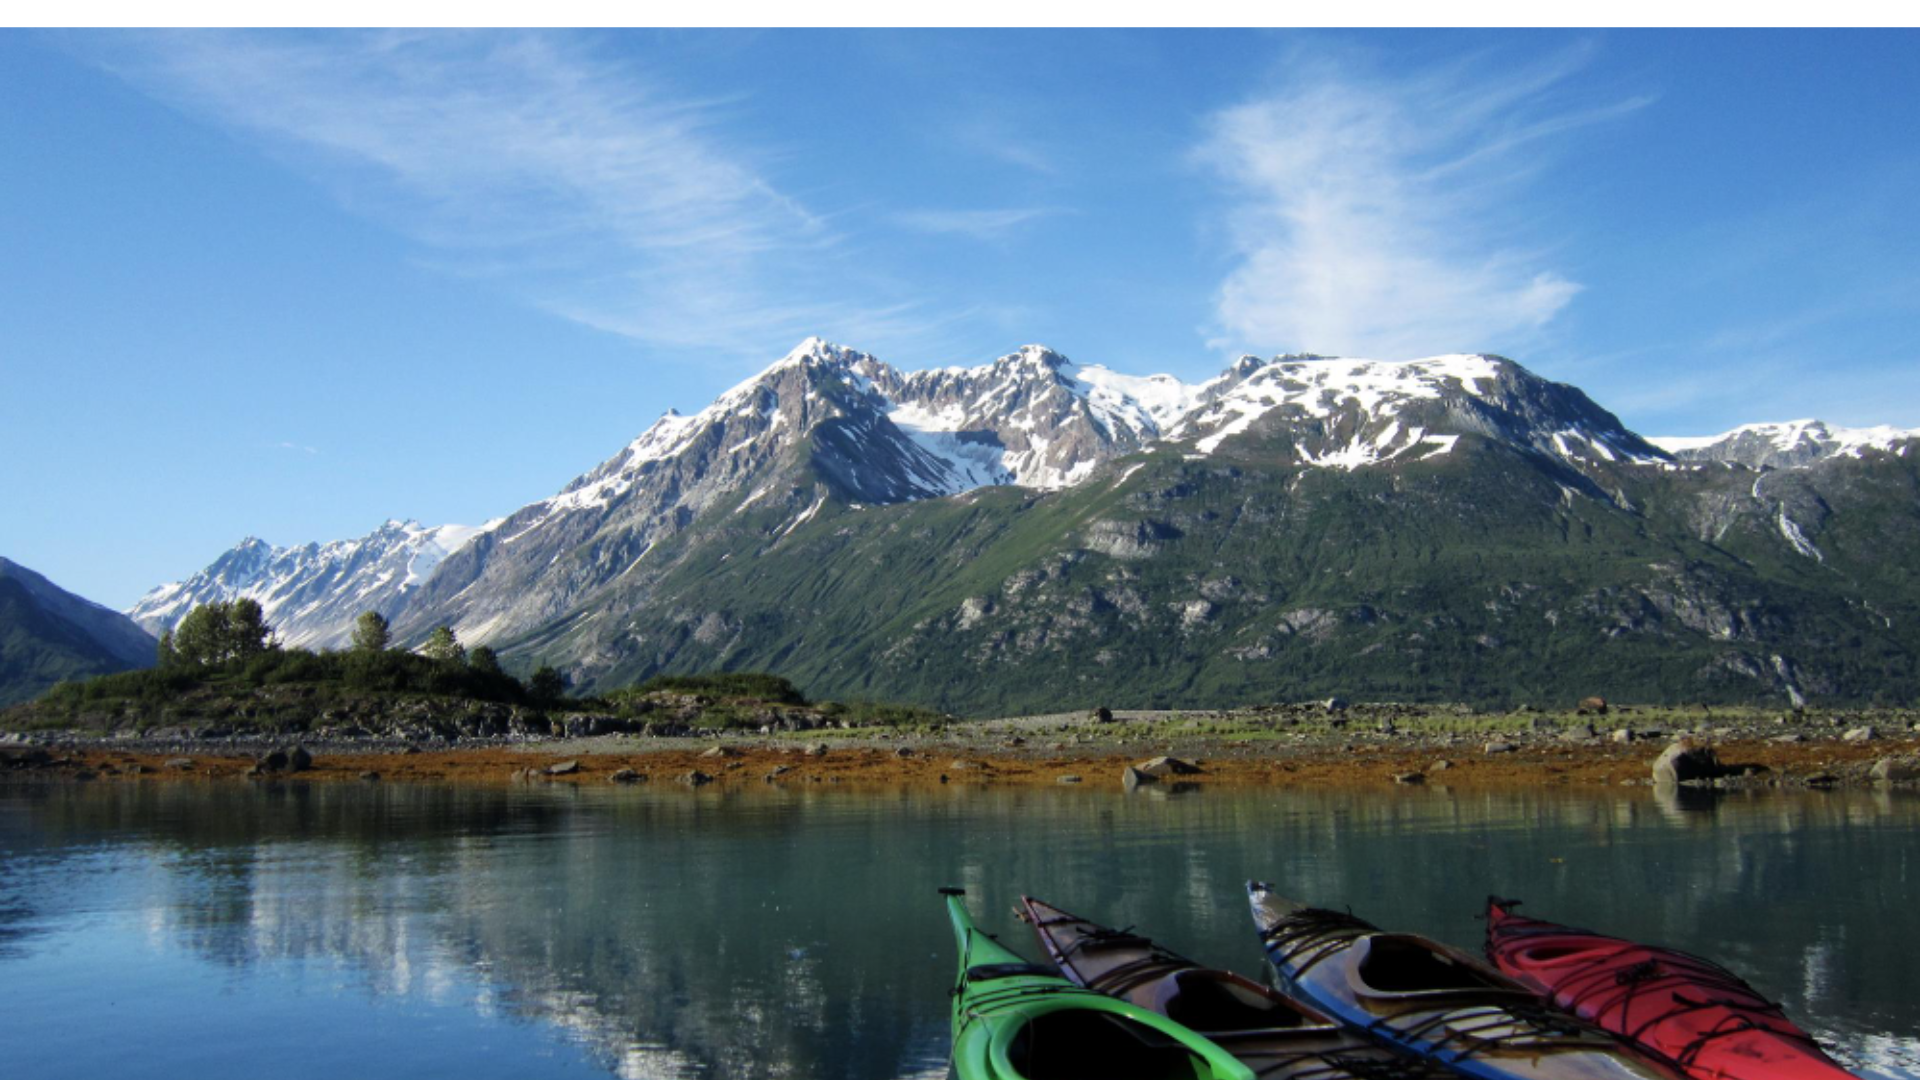
A. I was able to contribute to some of the first geospatial work in the Tongass National Forest in southeast Alaska, which was a lot of fun because even the most basic discoveries were still new discoveries. It actualized that curiosity I had as a kid, wondering what the highest thing was on a mountain or the lowest thing in a cave. It was science with a side of adventure.
Q. After Alaska, what was the next adventure?
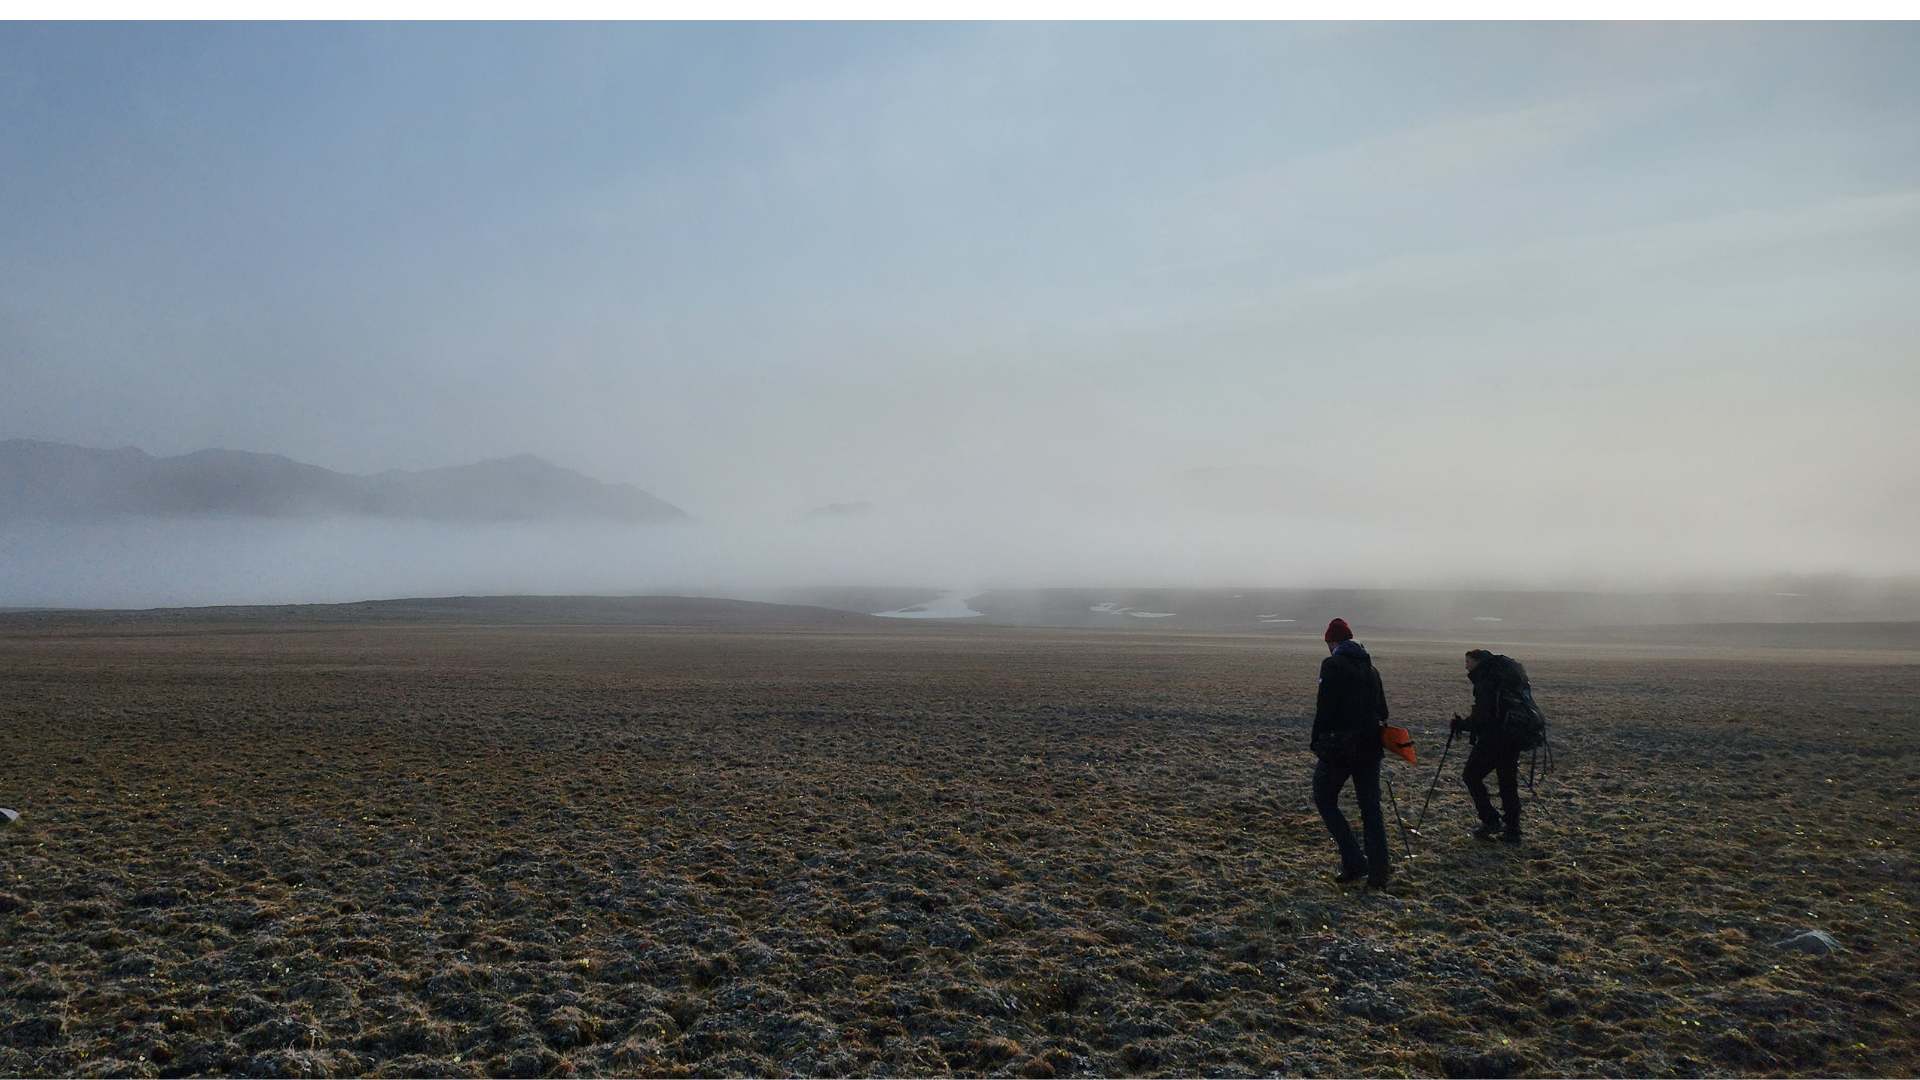
A. As adventures often do, the next one began at a bar with my friend Andres Holz. We were simply wondering where the southernmost tree in the world could be found, which led us to pursue and receive funding from the National Geographic Society to go find it. We were able to gather new scientific data from this extremely remote area (Isla Hornos in the Cape Horn archipelago), which was shared in the National Geographic magazine and a paper published by us. I was interested, though, in how I could give this feeling of exploration to everyone – beyond just reading about it.
Q. It sounds like we’ve reached the part of the story where iNaturalist and ArcGIS StoryMaps come into play.
A. Yes. I realized two things: anyone could help identify what we were calling “the edges of life,” and those observations meant more than just fostering the excitement of exploration. By studying the edge of any species, we can learn how they adapt to climate change over time, and with tens of thousands of species just in North America, we need citizen science to help gather all that data.
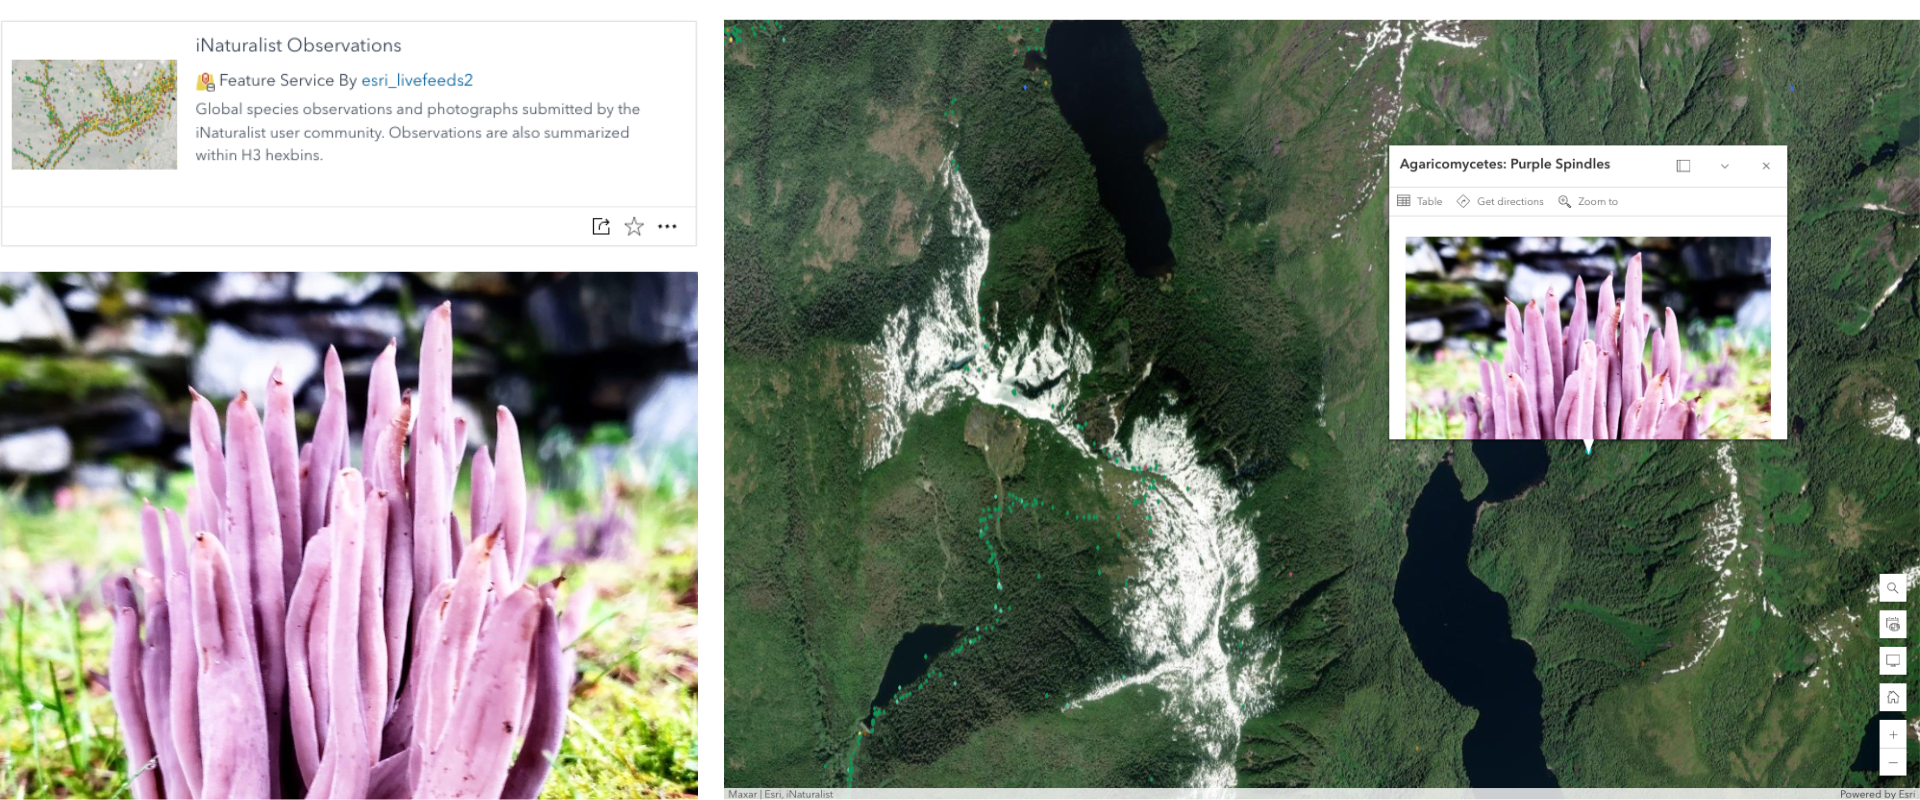
iNaturalist, a social network for sharing biodiversity information, is an easy entry point for anyone to contribute to major scientific data repositories. For example, by including iNaturalist data in my story, educators can use it easily to guide data collection with their students. The location of their schools will fit into an iNaturalist range limit, and teachers can pick a species at their south and north range limits as a jumping-off point. Something as simple as this can really help students understand how climates and habitats work.
Q. How did you come to use ArcGIS StoryMaps? How did it help facilitate your desire to inspire others?
A. Although our story was shared in the National Geographic magazine, I was also interested in a more interactive method that could really inspire people to get outside and go collect some data. I expressed this and was connected to a member of the StoryMaps team by National Geographic Geographer Alex Tait who wrote Mapping Mount Everest using the tool.
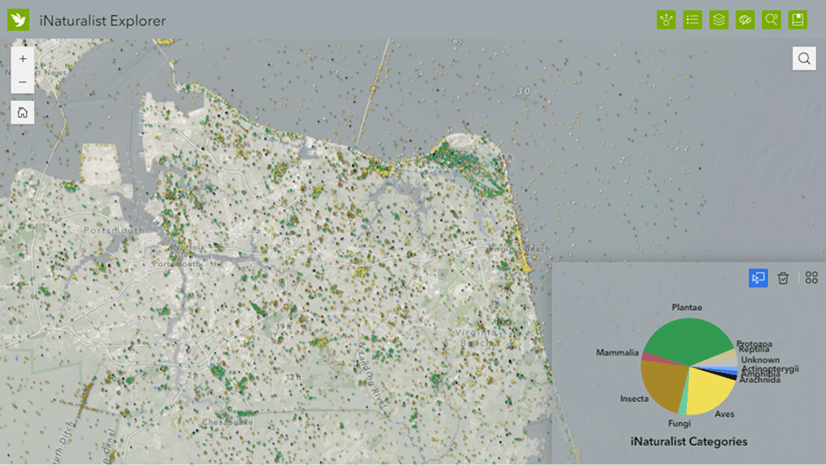
Of course, a major point of the story was to communicate science, so the basic capability to combine narrative with multimedia and maps allowed me to do so. But I also wanted to communicate the thrill of identifying species in the natural world and having web maps with iNaturalist data that readers can interact with helps initiate that feeling of being a part of the action. Everyone loves to zoom to where they live to see what’s going on there.
Since the story has been published, I’ve had educators let me know they’re using the story in their classrooms. I’ve also heard from different community clubs. It’s been a great entry point for a range of people, which is really fun to hear about.
Q. It’s been so great talking to you. Do you have any final advice or thoughts for our readers?
A. Anyone can be an explorer. With tools like iNaturalist and ArcGIS StoryMaps, it really enables folks to explore right outside their doorstep. I think it’s fun to embrace the challenge of it, to see if you can find a farther edge of life than what’s already been discovered. It doesn’t need to be the edge of the world; it can also just be the closest mountain or valley. Just find where there’s a gap and go fill it!
This featured storyteller interview was prepared as a part of the October 2024 | Observations of an iNaturalist issue of StoryScape℠.
For more interviews and articles like this one, be sure to check out StoryScape℠, a monthly digital magazine for ArcGIS StoryMaps that explores the world of place-based storytelling — with a new theme every issue.
Photo of Brian Buma courtesy Jeff Kerby.

Article Discussion: