Governments across the globe struggle to ensure residents have opportunities to continue their education, secure a well-paying job, find healthy foods, access affordable health care, and locate housing options in safe neighborhoods. They recognize many face challenges due in part to systematic and structural barriers, that constrain access to opportunity.
Social equity aims for the justness and fairness of social policy. Many governments are making a commitment to social equity, seeking to make investments aligned with the severity of needs in their jurisdiction. They want strong, equitable, communities that provide opportunities and benefits to all. To begin, they first must understand patterns, conditions and outcomes that impact various groups. Being able to aggregate, disaggregate and analyze community conditions is crucial to understanding where an abundance or lack of access to resources exists.
The Social Equity Analysis solution delivers a set of capabilities that help state and local governments understand community characteristics, analyze community conditions and actions, and generate an equity analysis index that can be used to educate internal external stakeholders.
Evaluate conditions and actions
Equity offices want to understand where community condition rates may be high or low so programs and investment can be adjusted when appropriate. Social Equity Analysis helps equity analysts load asset, condition or outcome data, aggregate it into geographic reporting areas, and calculate a community condition rate for each given geography.
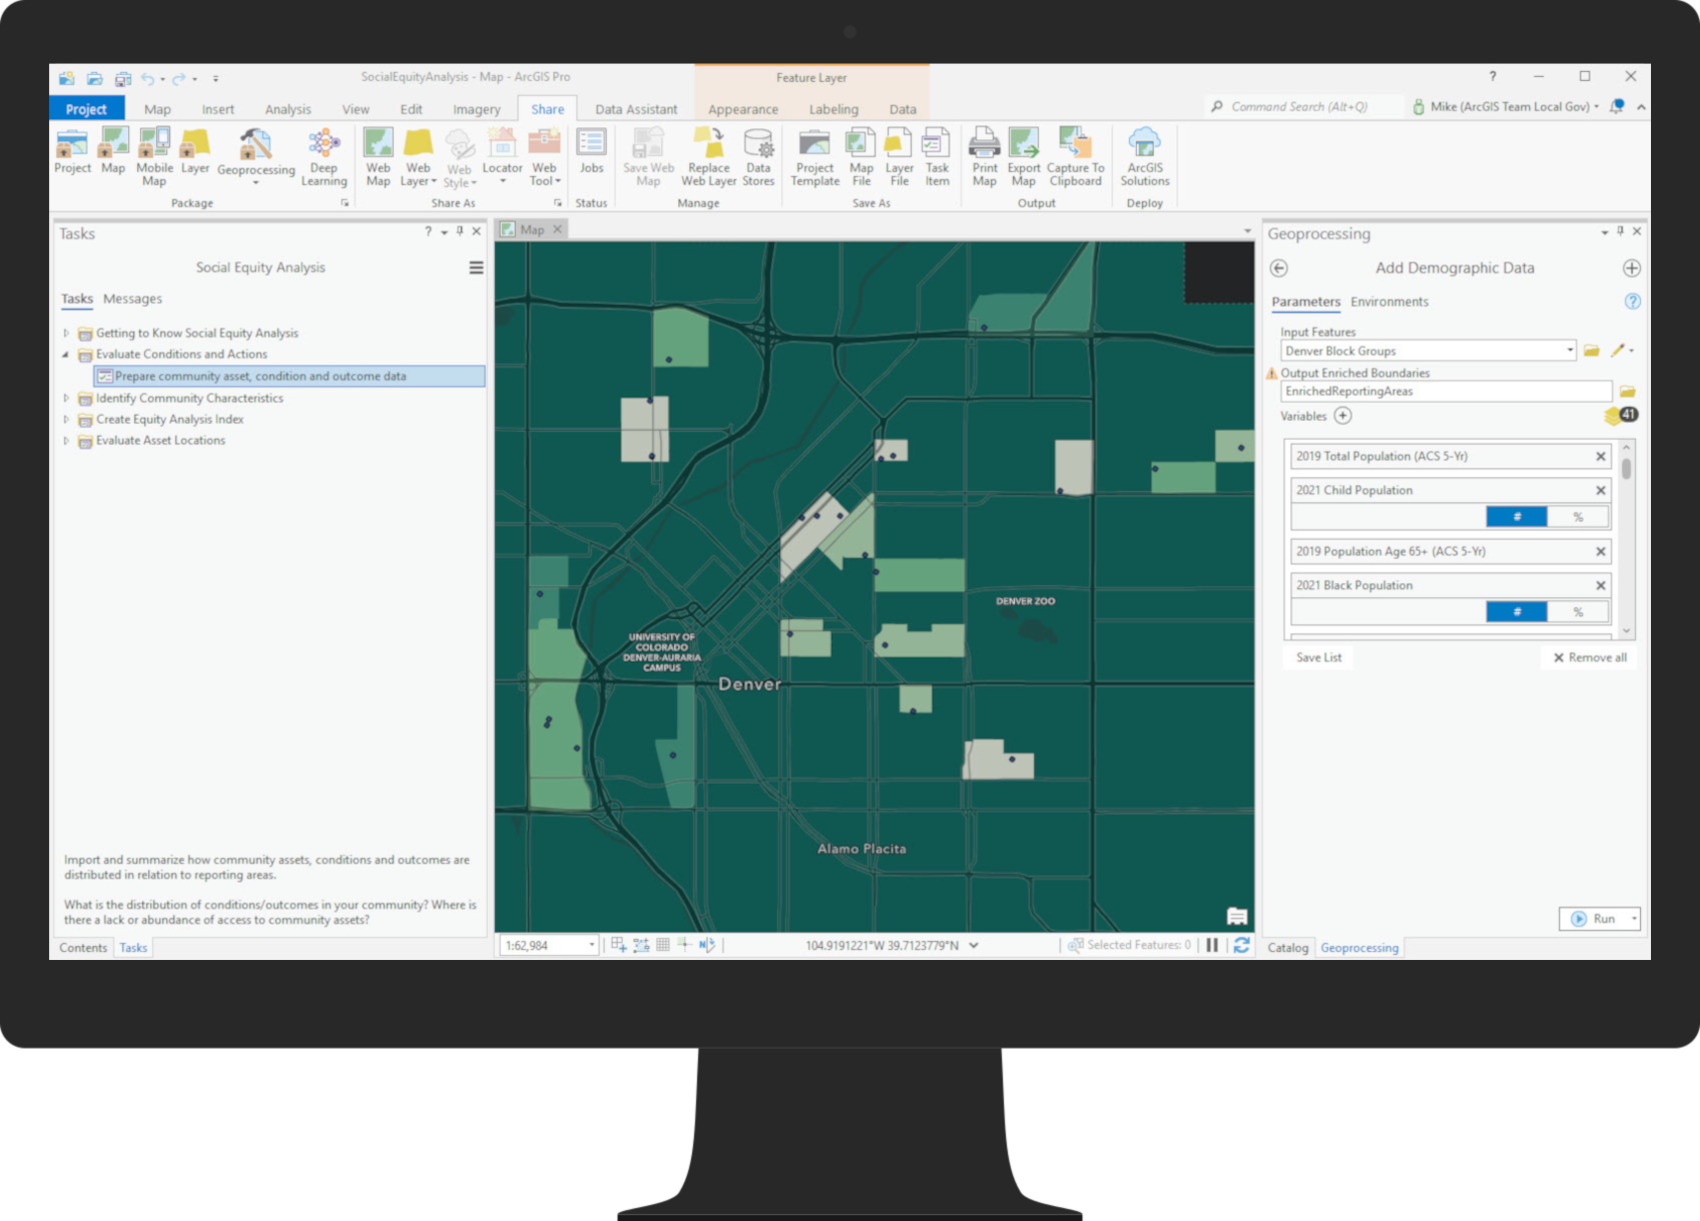
Any numeric, address or spatial data can be used to focus on specific statistics. The resulting Community Condition Rate map allows departments to see where condition rates are high or low.
Identify community characteristics
Equity offices also need to know where concentrations of focus community characteristics are located. The solution is configured to identify demographics and focus variables that are common inputs in equity analysis. These variables are added using the Enrich tool, and apportioned to your geographic reporting areas.
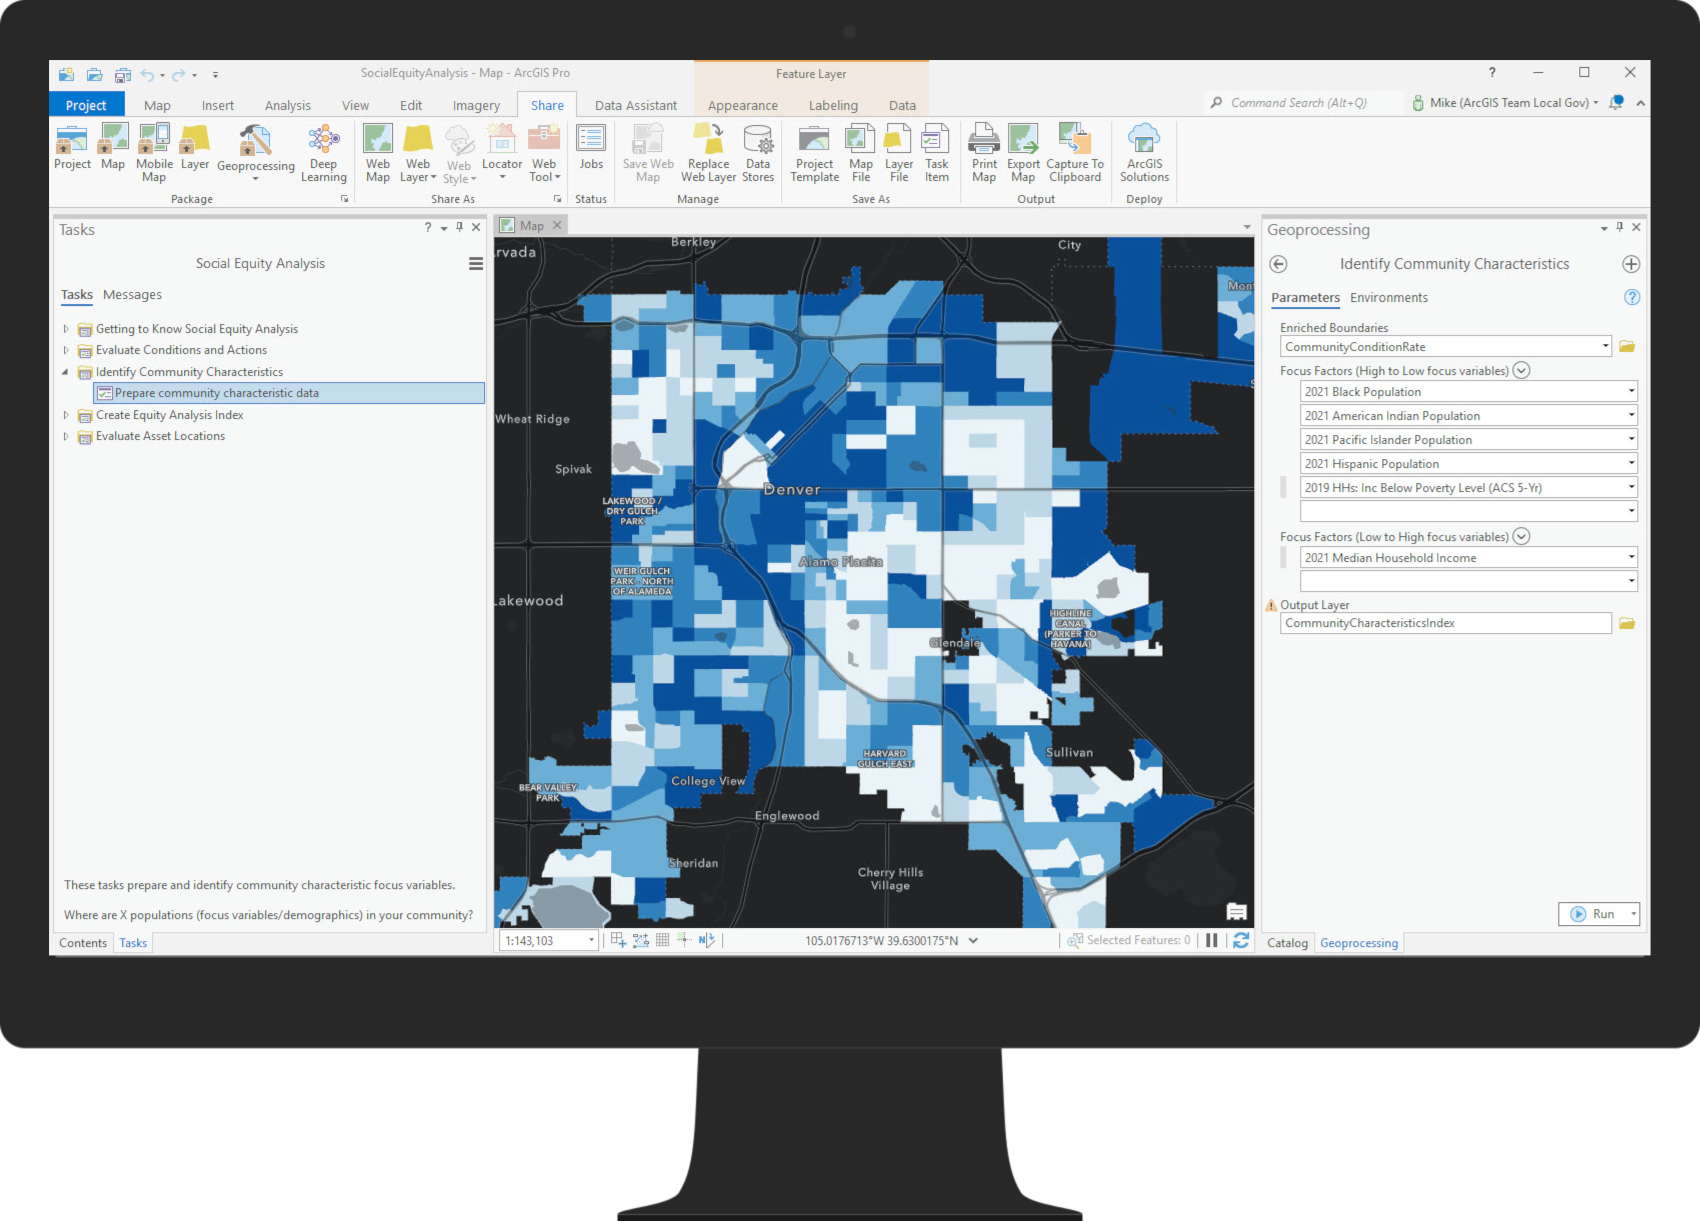
Equity analysts can adjust the analysis to focus on any focus variable, to ensure the condition which is being analyzed, is equitable. This standalone map can be useful to help analysts see where the specified focus community characteristics have the highest concentrations. The Community Characteristics Index map shows areas of highest and lowest focus based on the input focus variables.
Create equity analysis index
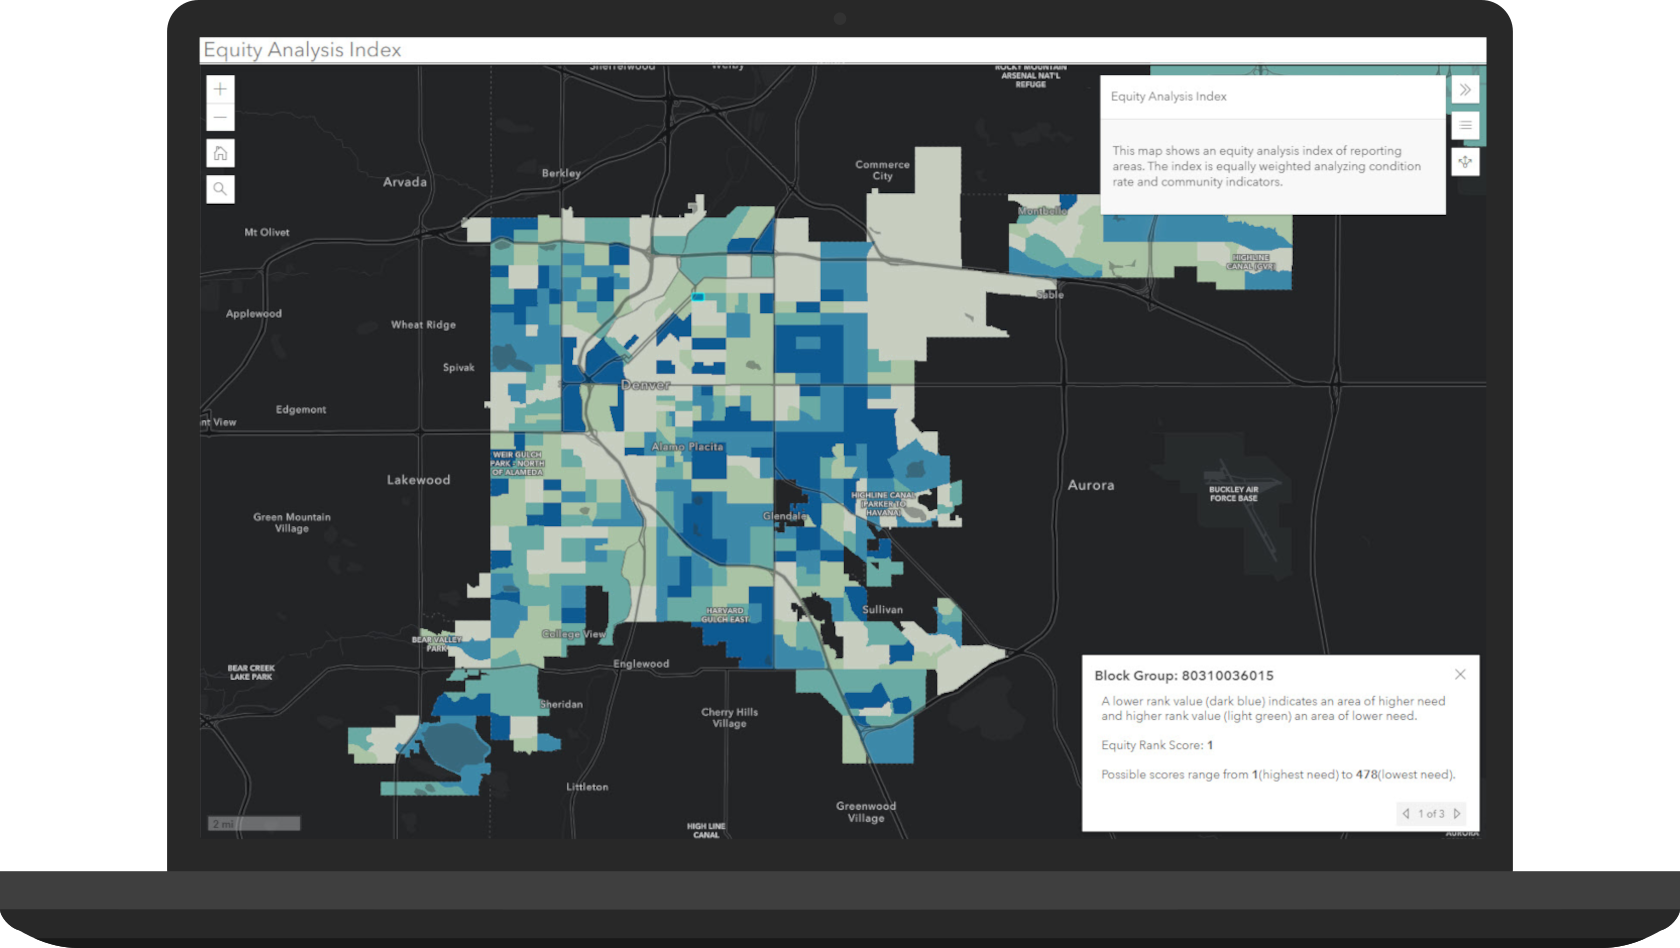
The term “equity analysis index” refers to the map produced when comparing where the Condition Rate and Community Characteristics Index maps, produced in previous steps, coincide. By combining these two key pieces of information, you get a map to see where need is the highest and lowest relatively to the other reporting areas.
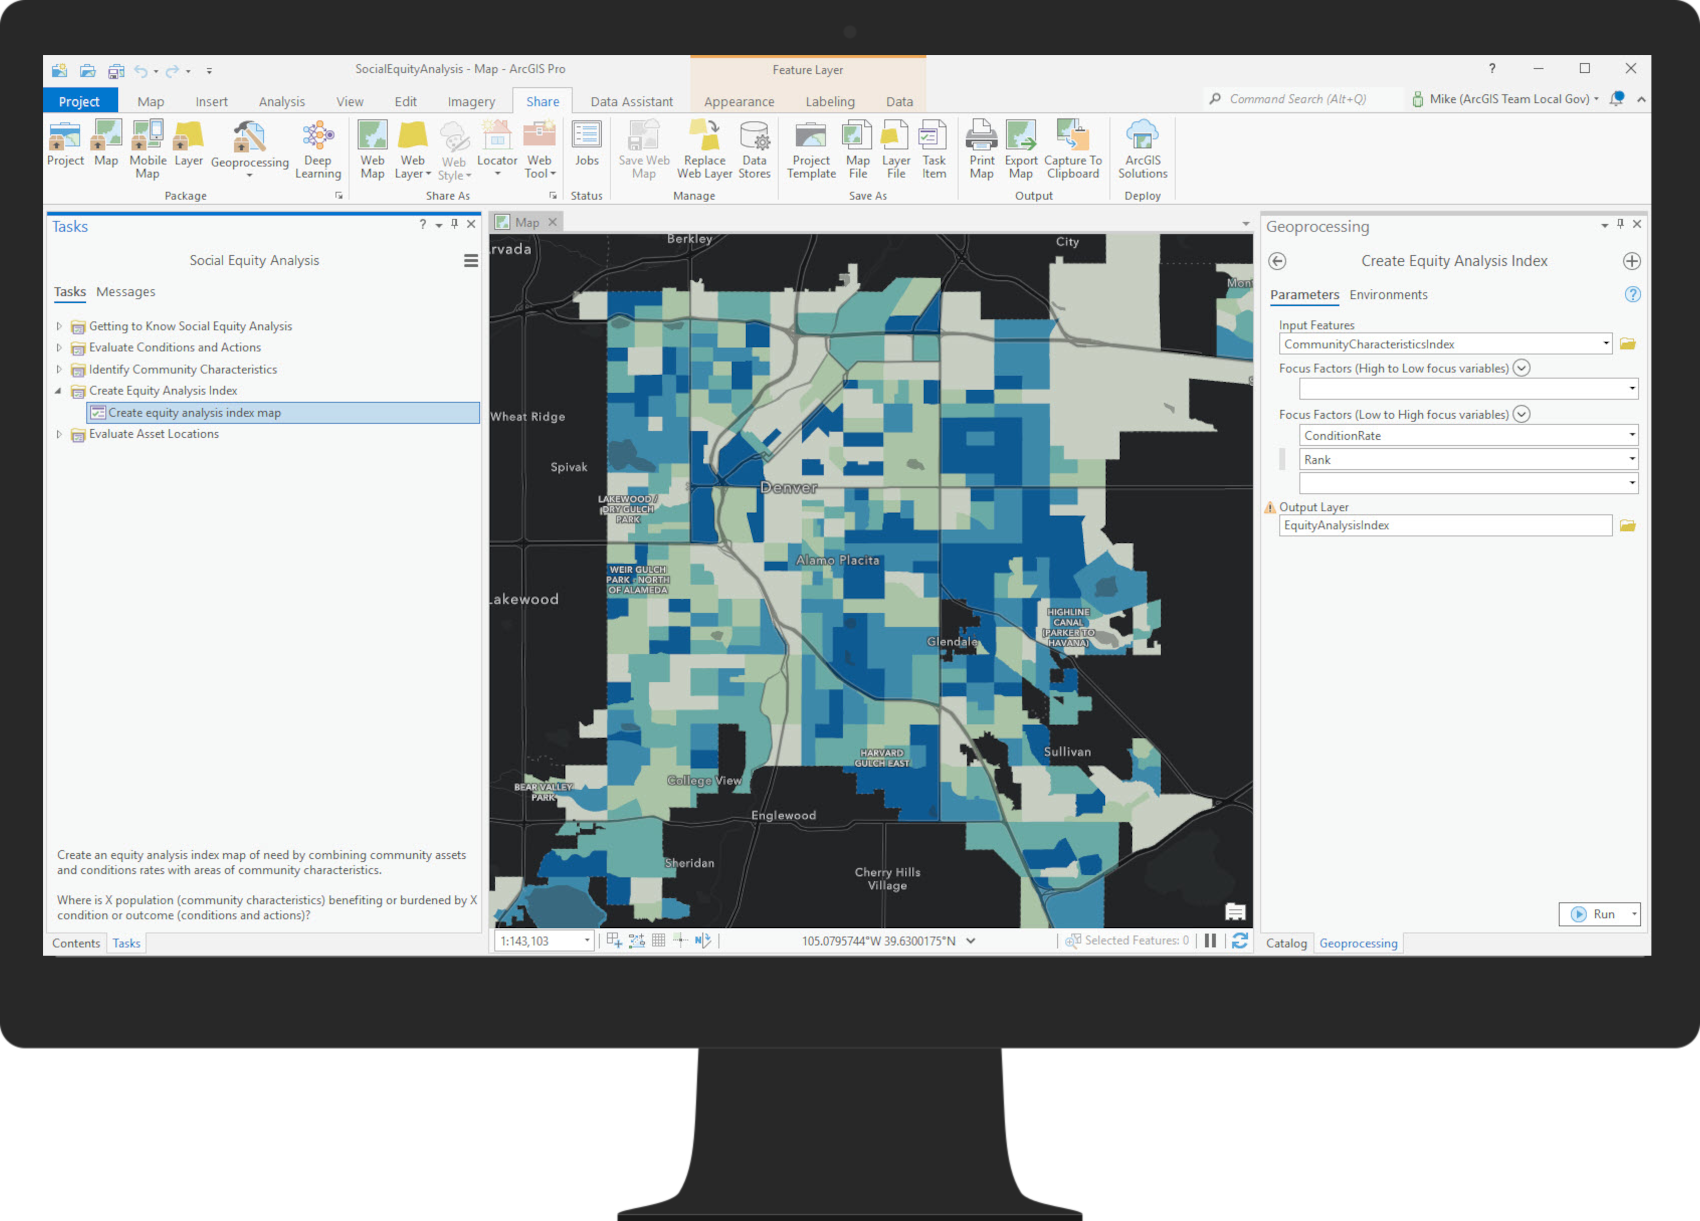
The resulting equity analysis index map can be used to identify where the highest need exists for the specified community condition and focus community characteristics variables.
Evaluate asset locations
The solution determines how many people are within a specified travel time of existing asset locations. Travel modes and times can be adjusted to reflect local conditions, if necessary, and ultimately used to visually evaluate where gaps in coverage exist.
If existing asset locations are not meeting community needs, the Social Equity Analysis solution can be used to select the best candidate asset locations from a set of potential locations you provide.
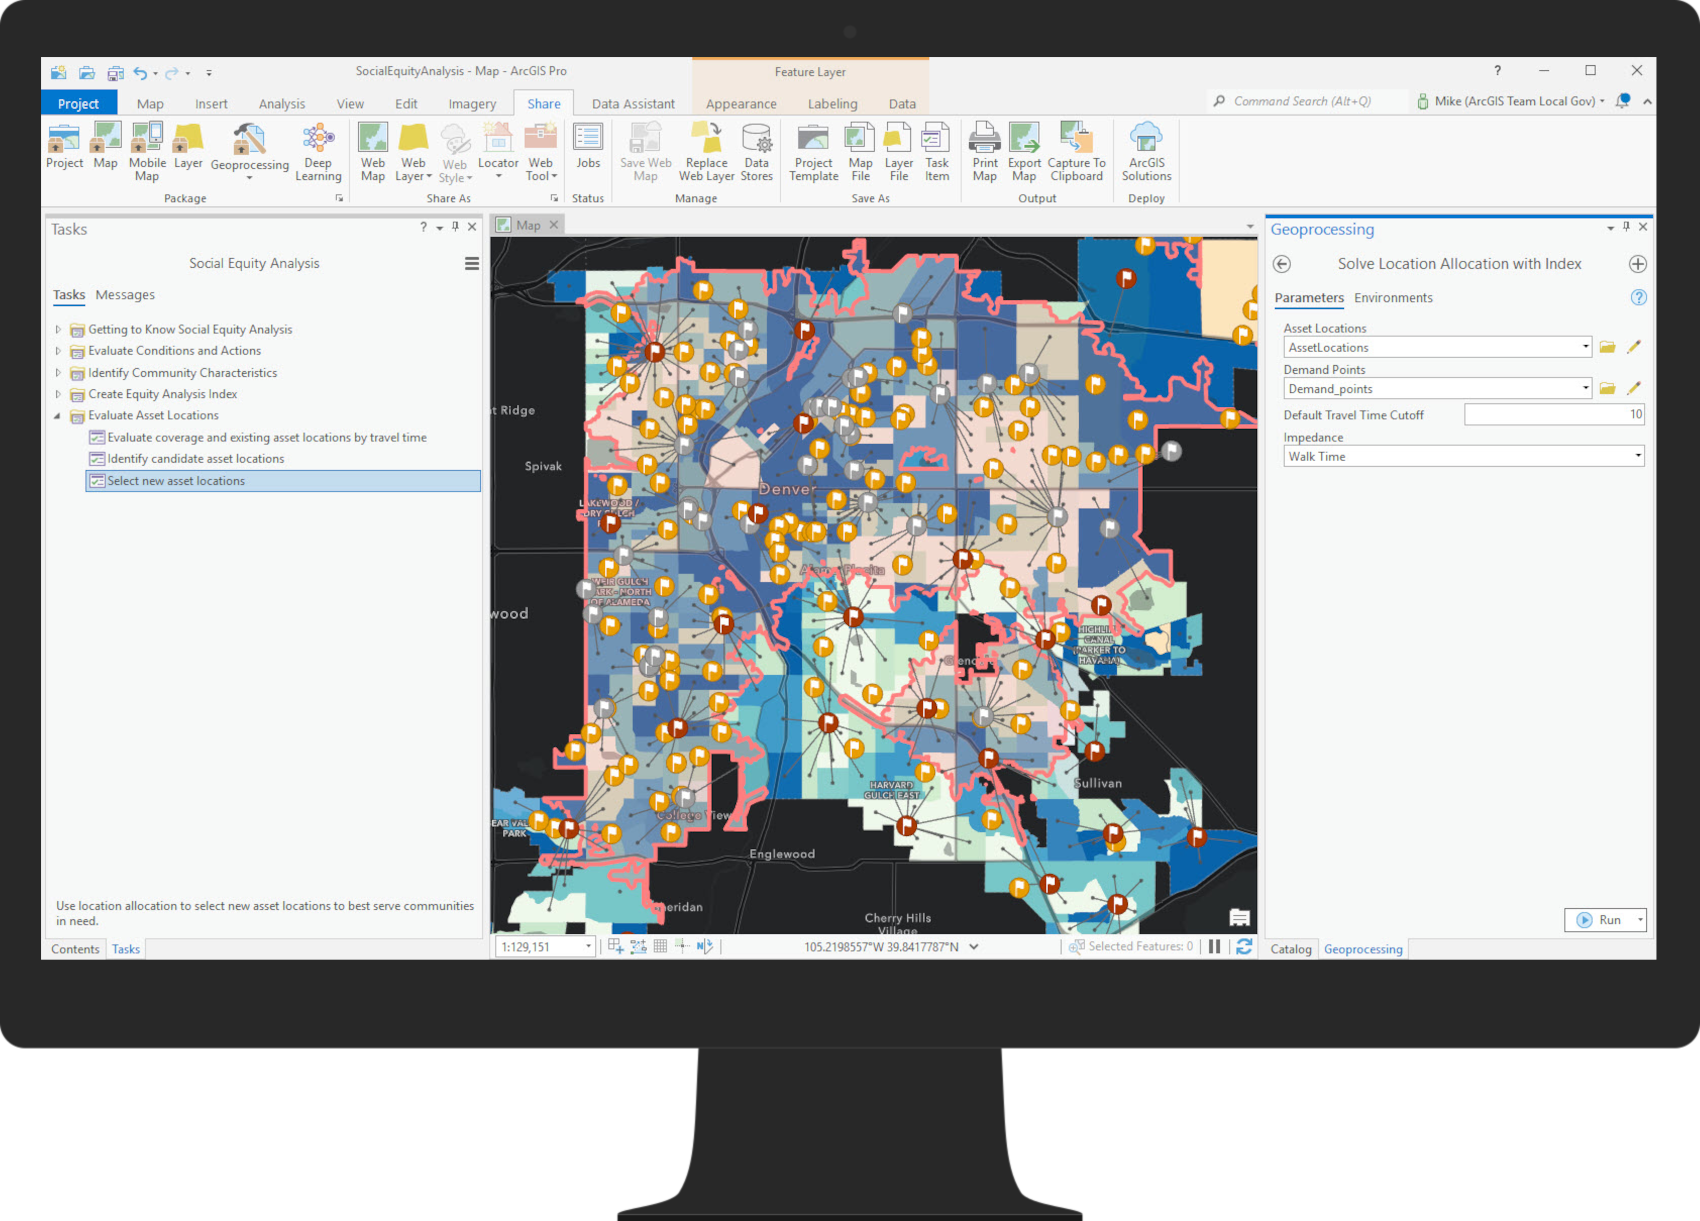
The selection process weights each reporting area as a point of need, so that areas that are in higher need have a location that is closer to them. This ensures that new asset locations will be selected in or near areas that are in need.
Share results with stakeholders
As you refine equity analysis, results can be shared with both internal and external stakeholders. Resulting maps of indexes and chosen asset locations can be shared to your ArcGIS Online or Enterprise organization. The Equity Analysis Index application is designed to share these results so stakeholders understand where equitable, or inequitable, conditions exist.
Additional Resources
Learn more about racial equity solutions and how you can quickly deploy these solutions on the ArcGIS Solution site. For questions and feedback, chat with us on GeoNet or contact Esri Support Services.
Finally, Esri is providing several resources to help organizations address racial inequities. The Racial Equity GIS Hub is the place to access additional resources and to request GIS assistance from Esri.



Article Discussion: