Homelessness is not only a human tragedy but also more dangerous than ever before. A study by Matthew Fowle and Giselle Routhier published in Health Affairs revealed that the death rate for people experiencing homelessness has skyrocketed by 238% between 2011 and 2020. With the number of homeless Americans increasing in many places, it has never been more important to leverage technology for solutions.
In the United States, the Department of Housing and Urban Development (HUD) mandates an annual count of people experiencing homelessness for sheltered counts and every other year for unsheltered counts. This point-in-time (PIT) count identifies those who are unsheltered, sheltered in transitional housing, in emergency shelters, and in safe havens. Local authorities, known as Continuums of Care (CoC), conduct this count with the assistance of local governments, non-profit partners and volunteers, which requires extensive coordination and resources. The results determine federal funding distribution, making an efficient and accurate count essential.
Enter Esri’s Homelessness Point-in-Time Count solution. This tool streamlines the entire process – from recruiting and organizing volunteers, to conducting the count, visualizing results, and automatically generating required reports. Organizations can quickly deploy the solution and start using it with their upcoming Point-in-Time count campaign.
With the next count of unsheltered people experiencing homelessness scheduled for January 2025, now is the perfect time to prepare, especially since some communities missed counts in previous years due to COVID-19. Here’s how the newly updated Homelessness Point-in-Time Count solution can help:
Prepare for the Count
With the increase in homelessness, CoCs face the challenge of canvassing their entire region. Coming up with a plan to ensure full coverage is critical. The solution’s first task is to divide the region into discrete assignment areas where volunteers will conduct their work. Deployment sites are also pinpointed as places where groups of volunteers will report for work.
Enlist Volunteers
Launching a volunteer recruitment campaign is the next step. The Homelessness Point-in Time Count ArcGIS Hub site supports your campaign by informing residents about the count and why it matters. It also provides an easy way for interested individuals to volunteer, create accounts, and specify their preferred assignment areas.

Approve and Assign Volunteers
As residents apply, coordinators can immediately review and evaluate applications, matching volunteers to their preferences and community needs. Approved volunteers automatically receive an email with further instructions and resources.
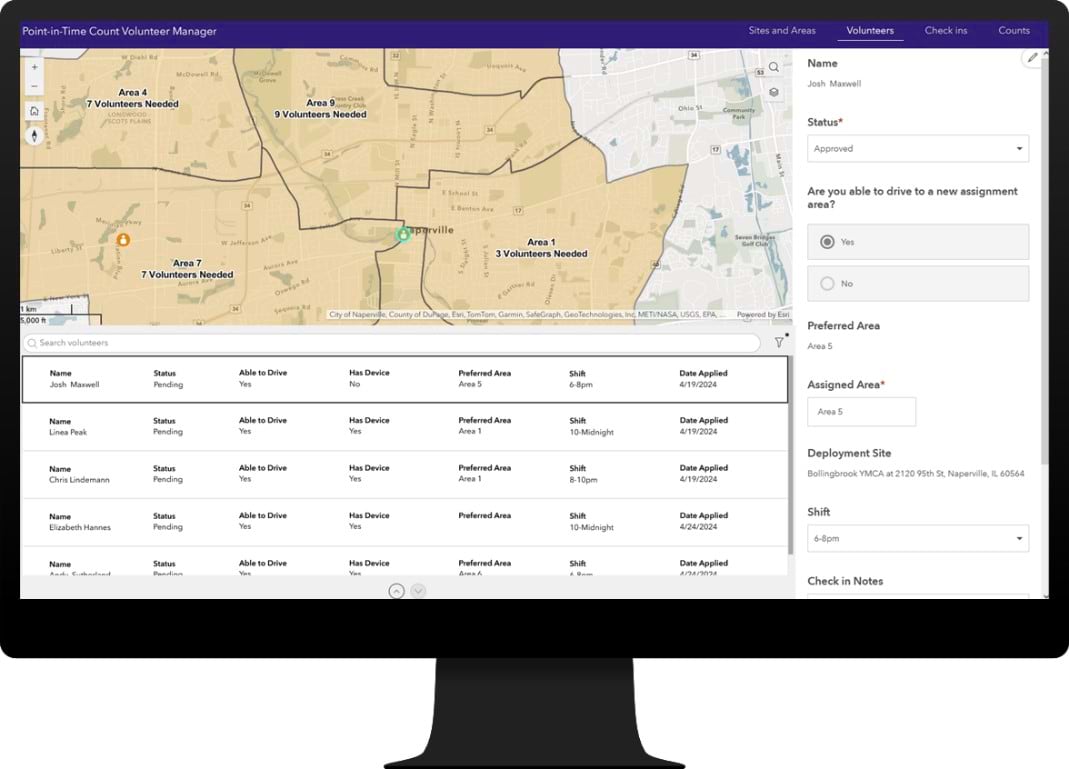
Check Volunteers In and Out
On count night, staff greet volunteers at deployment sites. The Point-in-Time Count Volunteer Check-In app records each volunteer’s arrival and provides last-minute instructions. If volunteers fail to show up, the solution offers tools to reassign volunteers to shorthanded areas or call in CoC staff to supplement the workforce where needed.

Volunteers Conduct the Count
Volunteers log in to ArcGIS Survey123 and use the Point-in-Time Count Survey to capture key information about individuals experiencing homelessness. A Spanish version of the survey is available for non-English speakers. The survey includes all required HUD questions to help CoCs understand an individual’s demographics, their circumstances, and their needs, facilitating better alignment with available services and identifying new service requirements.

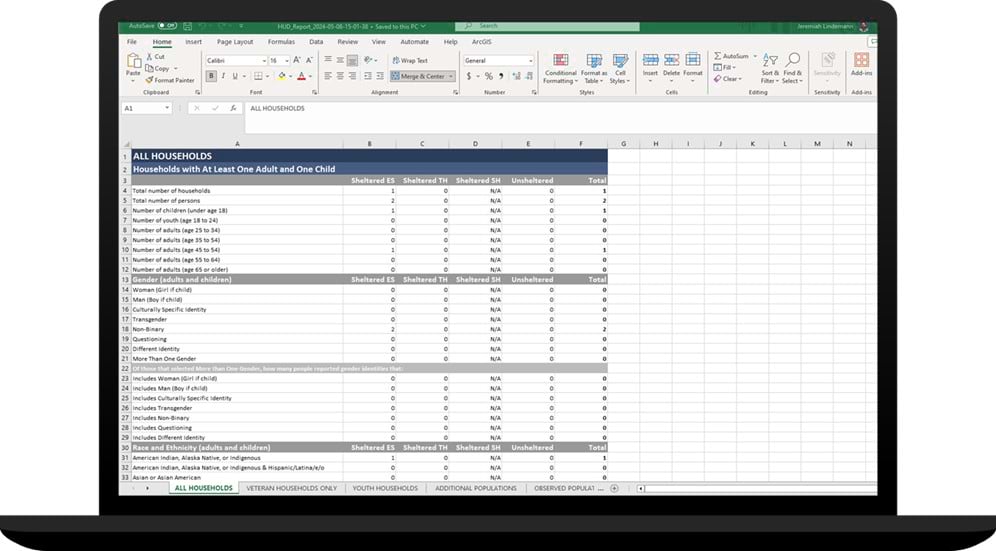
Visualize Results and Generate Report
Once the count is complete, the Point-in-Time Count Dashboard allows directors to visualize where homelessness is occurring and review descriptive metrics. This helps in understanding demographic trends, shelter status, and locating sub-populations like veterans and parenting youths who may need specialized services. The dashboard aids in developing meaningful intervention programs and prioritizing efforts throughout the year.

The final step is sharing the results with HUD, a critical step for receiving federal funding. The solution provides a tool that generates a final report from count data, aligning with federal requirements for submission via HUD’s Data Reporting Exchange.
By using this comprehensive solution, CoCs can ensure a more efficient, accurate, and meaningful Point-in-Time count, ultimately aiding the fight against homelessness.
Learn More
For more information about the Homelessness Point-in-Time Count solution, explore these resources:
- Learn how to deploy, configure, and use the solution
- View a demo video
- Learn about related solutions:
Opioid Epidemic Outreach
Community Health Outreach - Learn more about ArcGIS Solutions


Article Discussion: