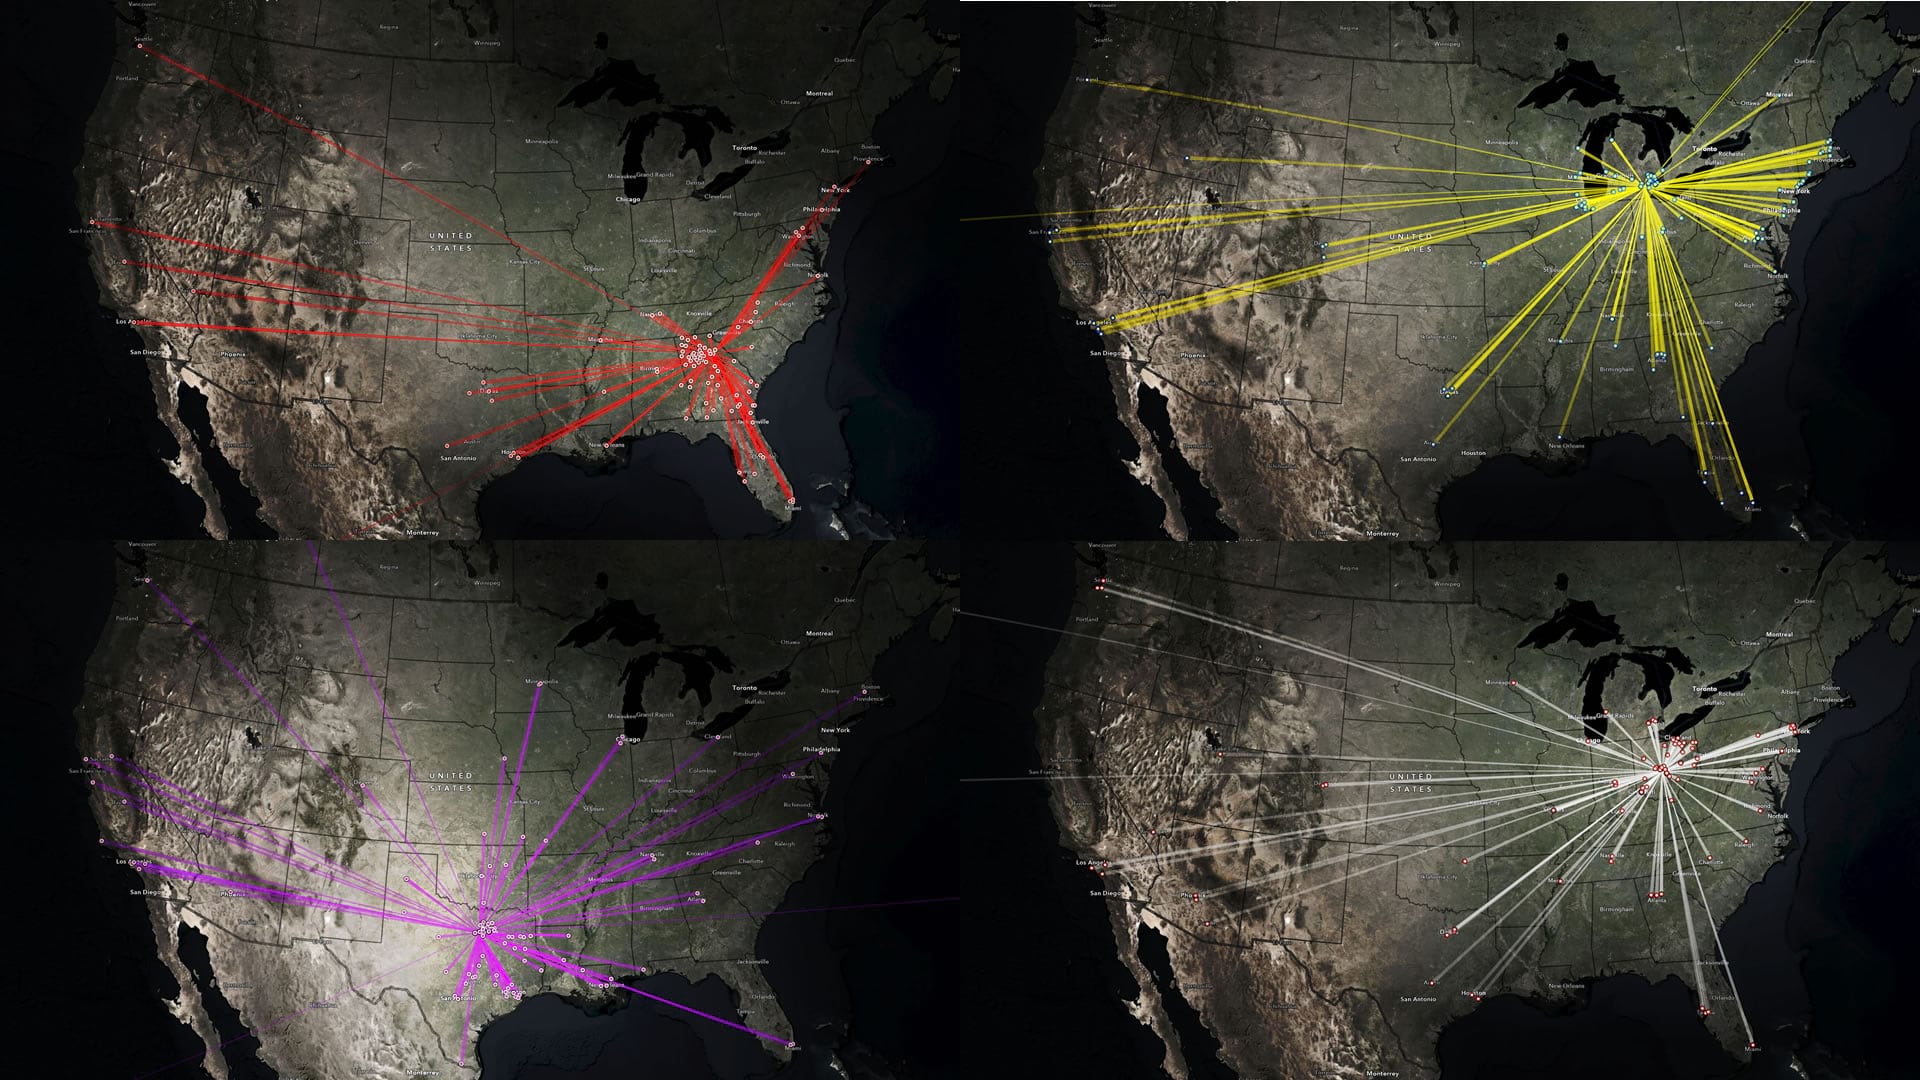
Many (most?) football fans are able to think strategically about formations and blocks and play calling. Though I enjoy watching, I do not have the strategic horsepower to comprehend much of what is happening, beyond than the broad strokes, on a football field. But I can appreciate how much of the competitive maneuvering that determines a college football program’s success was enacted years in advance in the form of recruiting high school athletes.
High school recruiting is a fantastic example of Tobler’s First Law of Geography. Distance matters. Nearby things are more related than further away things. Take a look at the home town locations of the four universities playing in the 2022-23 football playoff…

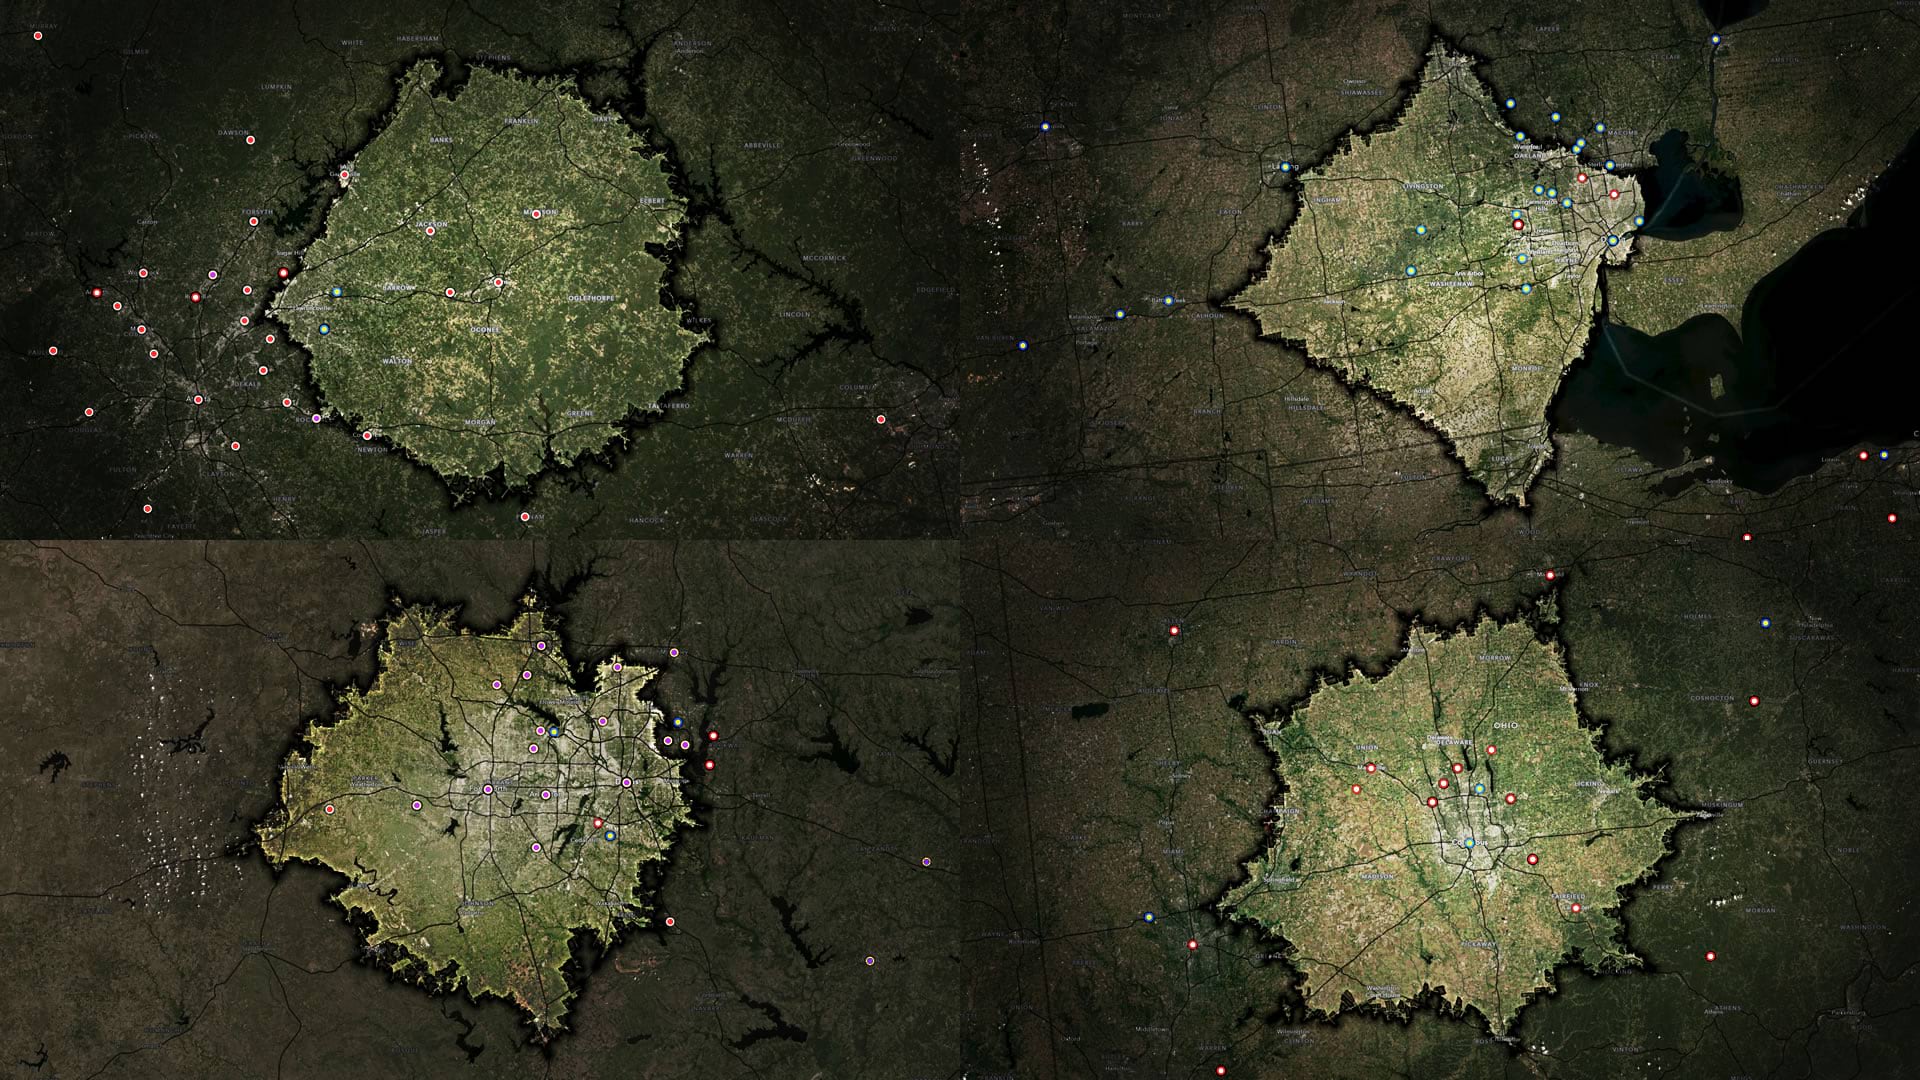
And the one-hour drive time dominated by the local school, with some poaching…

Here is a video where we take a look at some specific numbers and get a spatial-quantitative sense of these recruiting patterns…
If you just want the numbers, here are some summaries…
Median recruit distance by school and class
Overall: 226 miles (509 players)
Fr: 203 (241)
So: 139 (75)
Jr: 266 (95)
Sr: 178 (66)
Gr: 433 (32)
Georgia: 152 miles
Fr: 158 (58)
So: 106 (34)
Jr: 303 (22)
Sr: 120 (13)
Gr: 47 (1)
Michigan: 460 miles
Fr: 546 (65)
So: 337 (6)
Jr: 400 (28)
Sr: 229 (17)
Gr: 549 (20)
TCU: 221 miles
Fr: 165 (50)
So: 305 (19)
Jr: 242 (30)
Sr: 162 (30)
Gr: — (0)
Ohio State: 184 miles
Fr: 169 (68)
So: 105 (16)
Jr: 371 (15)
Sr: 409 (6)
Gr: 396 (11)
Transfer vs non-transfer median distance (and number of players)
4 playoff teams overall
Transfer: 279 miles (58)
Non-transfer: 219 miles (451)
Georgia
Transfer: 94 miles (8)
Non-transfer: 161 miles (12)
Michigan
Transfer: 433 miles (8)
Non-transfer: 461 (128)
TCU
Transfer: 279 miles (36)
Non-transfer: 184 miles (93)
Ohio State
Transfer: 496 miles (6)
Non-transfer: 182 miles (110)
Within-state players (and percent of team)
Georgia: 77 of 128 (60%)
Michigan: 37 of 136 (27%)
TCU: 79 of 129 (61%)
Ohio State: 51 of 116 (44%)
Top out-of-state state (and percent of team)
Georgia: Florida 13 of 128 (10%)
Michigan: Florida 10 of 136 (7%)
TCU: California 9 of 129 (7%)
Ohio State: Texas 7 of 116 (6%)
Top 4 CBSAs (by school)
Dallas Ft Worth CBSA: 51 (Georgia 4, Michigan 5, TCU 38, Ohio State 4)
Atlanta CBSA: 49 (Georgia 36, Michigan 7, TCU 2, Ohio State 4)
Detroit CBSA: 30 (Georgia 0, Michigan 26, TCU 0, Ohio State 4)
Columbus CBSA: 19 (Georgia 0, Michigan 2, TCU 0, Ohio State 17)
1-hour drive times around each school (recruits per school)
Georgia (Georgia 8, Michigan 2, TCU 0, Ohio State 0)
Michigan (Georgia 0, Michigan 20, TCU 0, Ohio State 4)
TCU (Georgia 3, Michigan 3, TCU 31, Ohio State 1)
Ohio State (Georgia 0, Michigan 2, TCU 0, Ohio State 17)
Nerded out yet? If not, here is a video walking though data scraping and formatting, importing and geocoding, distance analysis and querying, and cartography…
This sort of proximity analysis doesn’t depend on football. It can be useful for all sorts of spatial questions, like the location of shipping hubs, the placement of retail centers, office relocations, emergency response positioning, you name it! In the meantime, enjoy the games and have fun whipping up all manner of geographic fun with the amazing tools at your fingertips!
Happy Mapping, John

Article Discussion: