ArcGIS Pro 3.4 brings exciting new enhancements to spatial analysis, expanding our ability to model spatial patterns and assess analysis results uncertainty. This release introduces two new toolsets—Spatial Component Utilities and Assessing Sensitivity—as well as new tools for exploratory spatial analysis with Directional Trend and Bivariate Spatial Association. Let’s dive in!
Introducing Spatial Component Utilities: Unlocking Spatial Patterns with MEMs
Many spatial statistics tools rely on defining a neighborhood structure—essentially, determining which features are neighbors and assigning weights to their relationships. This is captured in a spatial weights matrix (SWM), a fundamental concept in spatial analysis. But what if we could break down spatial relationships into independent components that reveal hidden structures? Enter Moran Eigenvector Maps (MEMs).

MEMs are derived by decomposing a SWM into uncorrelated components, much like how principal component analysis (PCA) refactors variables. These components represent core spatial patterns embedded in the data, offering a powerful way to understand spatial structure. MEMs have extensive applications and the new Spatial Component Utilities toolset introduces four tools that use MEMs behind the scenes:
- Create Spatial Component Explanatory Variables: Generates spatial components that capture spatial patterns within your data, improving prediction models like regression by accounting for spatial dependencies. Learn more about creating and using spatial components in prediction workflows in this blog post.
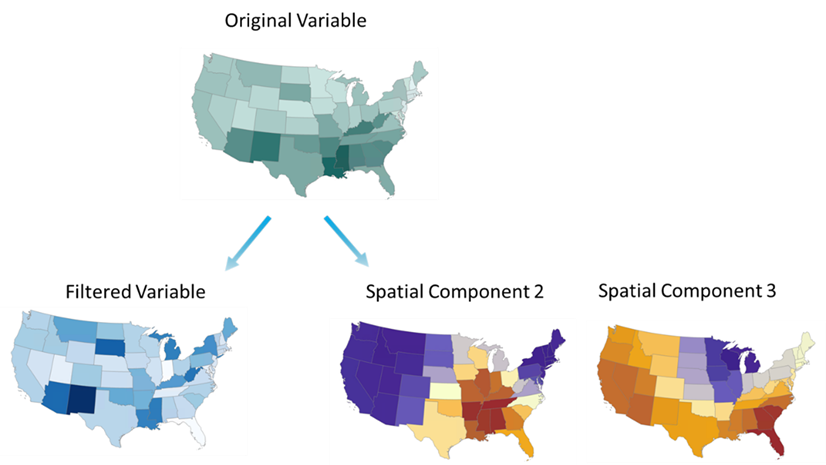
- Filter Spatial Autocorrelation From Field: Removes spatial autocorrelation from a dataset, making it easier to isolate non-spatial relationships in analyses. There are two ways in which it is so powerful: First, it helps us to explore the relationship between two variables while reducing the interference of neighboring influences. Second, it enhances regression and machine learning models by eliminating spatial misspecifications and can make non-spatial models become spatial models. Follow this blog post for some detailed examples.
- Decompose Spatial Structure (Moran Eigenvectors): Decomposes a feature class and neighborhood into a set of spatial components. The components represent potential spatial patterns among the features, such as clusters or trends.
- Compare Neighborhood Conceptualizations: Helps determine the best neighborhood definition for your data by comparing different SWMs and identifying the one that best represents spatial patterns.
Assessing Sensitivity: Bringing Uncertainty to the Forefront
Uncertainty is everywhere in spatial analysis—from how we collect data to how we define neighborhoods, choose model parameters, and interpret results. In ArcGIS Pro 3.4, we have added the first of many tools in the Assessing Sensitivity toolset to help assess uncertainty in analytical results.
Assess Sensitivity to Attribute Uncertainty
This tool evaluates how sensitive an analysis result is to variations in the input data. By simulating different versions of an attribute (using margin of error, confidence bounds, or a percentage of variation), you can assess the stability of your results and build more robust analyses. Learn more about this tool with examples in this blog post.
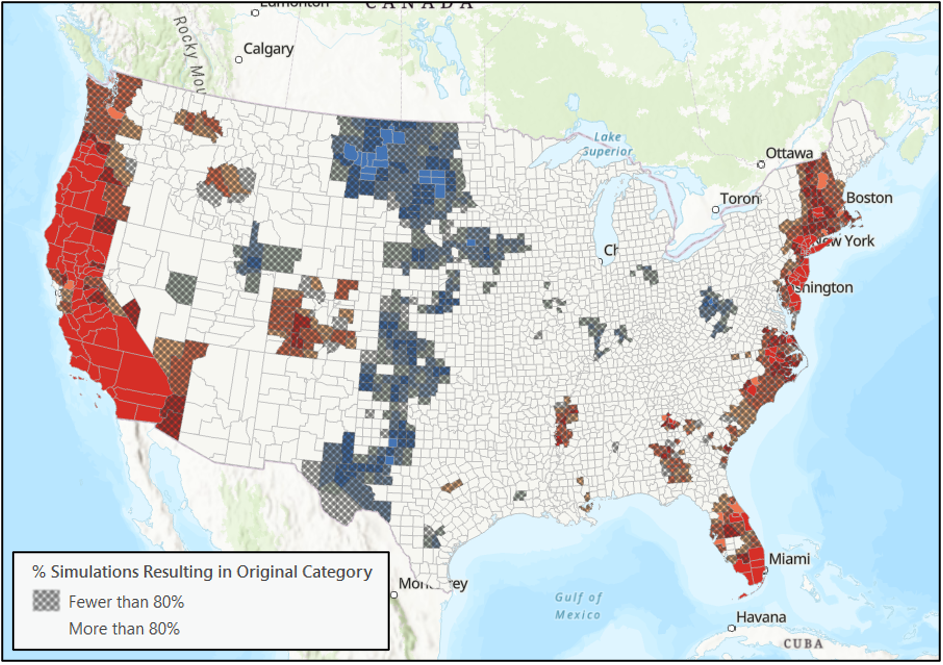
Why does this matter? Acknowledging uncertainty leads to more reliable, transparent, and ethical decision-making. By making uncertainty explicit, we enhance the reproducibility of spatial analyses and build greater trust in spatial data science.
This is the first tool in the toolset and in the future we will add more tools to address different types of analytical uncertainties.
Bivariate Spatial Association (Lee’s L)
This new tool calculates the spatial association between two continuous variables using the Lee’s L statistic. Unlike traditional correlation, Lee’s L accounts for both correlation and copatterning (spatial clustering similarity). Values range from -1 (strong negative association) to 1 (strong positive association), with 0 indicating no spatial association. The tool also provides local Lee’s L statistics, helping identify areas where spatial association is stronger or weaker than the global trend. This is useful for understanding localized relationships and detecting spatial patterns that traditional correlation methods might miss.
Directional Trend
This new tool creates a scatter plot to visualize trends in data values along a particular direction. Some use cases include:
- Understanding how public sentiment on immigration shifts as you move north from the U.S. southern border.
- Examining how precipitation levels change with distance from a coastline.
- Identifying trends in data before performing geostatistical interpolation (kriging).

We encourage you to try out these new tools in ArcGIS Pro 3.4 for your analysis questions and workflows.


Article Discussion: