Poles of inaccessibility are the locations furthest from the coast in land masses or the ocean. In this context, the word pole is not used in the geometric sense, like the Earth’s North and South Poles, which are fixed points on the planet’s axis of rotation. Instead, it refers to places that are extremely remote or hard to reach, drawing from the idea of the poles as faraway and isolated locations. More than just a geographical curiosity, they can be helpful in disaster response (identifying the most remote location in the response area), biodiversity studies (identifying pristine study sites largely unaltered by human activity), and adventure tourism. While a simple concept, the location of a pole of inaccessibility (PIA) is heavily influenced by which coastline is used and the distance calculation method.
This blog outlines a workflow that calculates the accurate distance from the coast to each location on land considering the curvature of the Earth, the additional distance added by the ups and downs of the Earth’s surface, and the difficulty of traveling up or down steep slopes. Once accurate distances have been calculated, the location with the maximum distance is selected as the PIA.
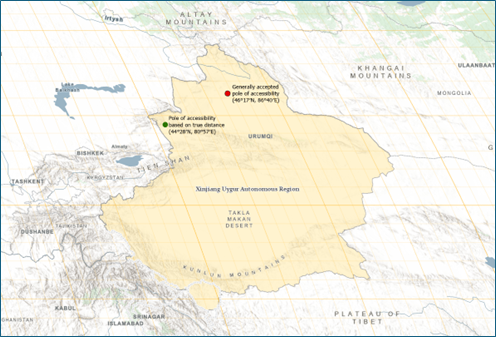
We calculated the land PIA using ArcGIS Pro 3.4 and the Distance Accumulation tool, available with the Spatial Analyst license. Using GIS methods, the land PIA shifted approximately 425 kilometers southwest from its generally accepted location in China’s Xinjiang region.
How can you explore?
- Follow the guided workflow below to create a PIA for Puerto Rico (all data available in ArcGIS Online)
- Calculate the PIA for each continent.
- Calculate the PIA for your favorite national park or wilderness area.
Guided Workflow
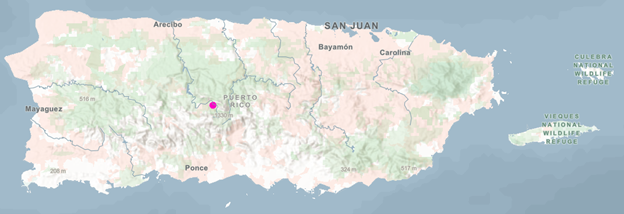
For this workflow, we’ll focus on a smaller area of the world, Puerto Rico.
- Add DEM for Puerto Rico
- In ArcGIS Pro, choose Add Data | From Path … Copy and paste the following text into the Path:
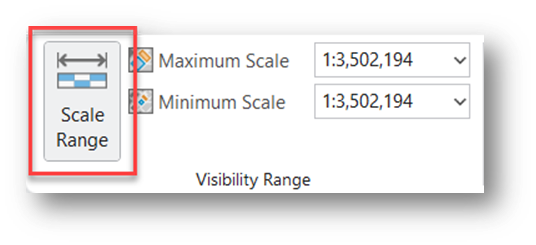
https://www.arcgis.com/home/item.html?id=e26f3f9ce93b44febddf48aa983adcdf - To see the DEM, you will need to turn off Scale Range in the Visibility Range group on the Image Service Layer tab.
- In ArcGIS Pro, choose Add Data | From Path … Copy and paste the following text into the Path:
- Add coastline for Puerto Rico. We’re using a crude coastline for demonstration purposes.
- In ArcGIS Pro, choose Add Data | From Path … Copy and paste the following text into the Path:
https://www.arcgis.com/home/item.html?id=2dac84c02b934723b6ef309e27899657
- In ArcGIS Pro, choose Add Data | From Path … Copy and paste the following text into the Path:
- Run the Distance Accumulation tool.
- Input Raster or Feature Sources:
pr_crude_coastline
- Output Distance Accumulation Raster:
pr_distance
- Input Surface Raster (this raster provides the tool with the information to calculate the ‘extra’ distance generated by moving up and down elevation):
land_srtm30plus_PR.tif - Distance Method (this tells the tool to calculate distances on the spheroid accounting for the curvature of the Earth. This is not as important for a smaller study area like Puerto Rico, but it can make a big difference in global analyses):
Geodesic - Cost Relative to Vertical Movement | Input Vertical Raster (the tool uses this raster to calculate slope and include it in the accessibility cost):
land_srtm30plus_PR - Vertical Factor:
Bidirectional hiking time(this option most closely models human (or energy-based) movement over terrain. It penalizes uphill movement more than downhill, and it’s asymmetric, which is important because uphill travel is much harder than downhill.)
- Input Raster or Feature Sources:
- Run the Get Raster Properties tool. We need to find the largest (most inaccessible) distance.
- Input Raster:
pr_distance - Property type:
Maximum cell value - Open the messages for the tool by clicking View Details and selecting the Parameters tab. Copy the value of the maximum distance (be sure to capture all the significant digits).
- Input Raster:
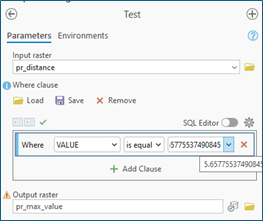
- Run the Test tool. This will identify the cell with the maximum distance (inaccessibility) value.
- Input raster:
pr_distance - Where clause:
VALUE is equal to <<the maximum value identified by the Get Raster Properties tool>> - Output raster:
pr_max_value
- Input raster:
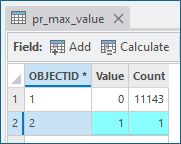
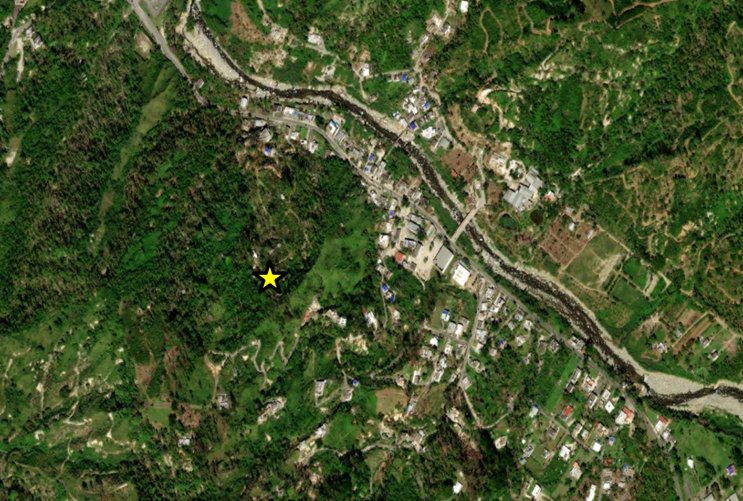
- Open the attribute table of pr_max_value. It will contain two rows. Select the row with the Value of 1 (it should also have a count of 1). This row represents the pixel with the highest accumulated distance and is the most inaccessible cell in Puerto Rico.
- Run the Raster to Point tool.
- Input raster:
pr_max_value - Field:
Value - Output point feature:
pr_pia
- Input raster:
Looks like we can visit.
Additional Reading
- Garcia-Castellanos, D., & Lombardo, U. (2007). Poles of inaccessibility: A calculation algorithm for the remotest places on earth. Scottish Geographical Journal, 123(3), 227-233.


Article Discussion: