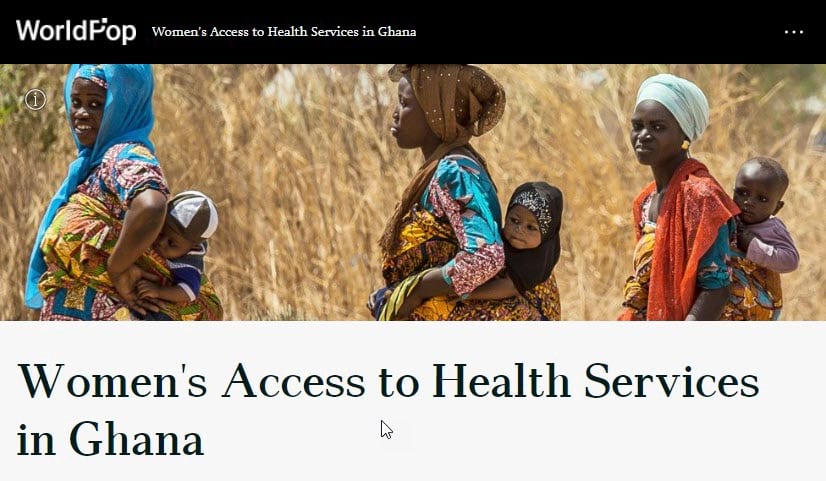
Here in Part 4 we share a storymap by Dorothea Woods at WorldPop. Dorothea used the WorldPop Population Cohorts 2000-2020 1km layer to better understand women’s access to health services in Ghana. She used ArcGIS Pro to access the multidimensional raster slices representing age and sex cohorts. She analyzed those with road and hospital location data to learn where access may be challenging. Last, she summarized the results at district, region, and national levels, and shared them in ArcGIS Online.

The workflow Dorothea describes in this story map includes many of the tasks described in detail in parts 1, 2, and 3 of this blog series. In part 5, we share two fast-drawing cartographic layers we designed facilitate integrating the footprint of population and urban density population into base maps.

Article Discussion: