A new geoprocessing tool, Extract Rails From Point Cloud, is now available in ArcGIS Pro 3.4.
Mobile lidar scanners mounted on rail vehicles deliver high measurement rates, producing dense, accurate, and detailed data. This makes mobile lidar an ideal solution for mapping rail corridors, including tracks, switches, crossings, and other critical assets, as well as nearby vegetation that could impact rail safety.
The 3D point clouds generated from this data can be used for various purposes, such as mapping, inspection, and clearance analysis. Point clouds can play an important role in identifying potential hazards, detecting track distortions, and locating areas requiring maintenance.
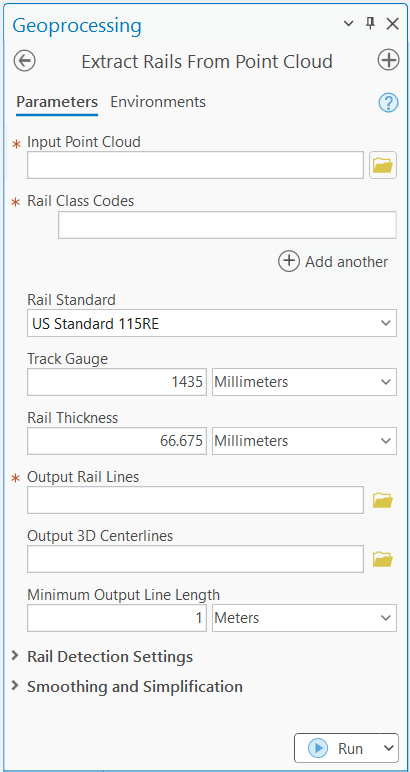
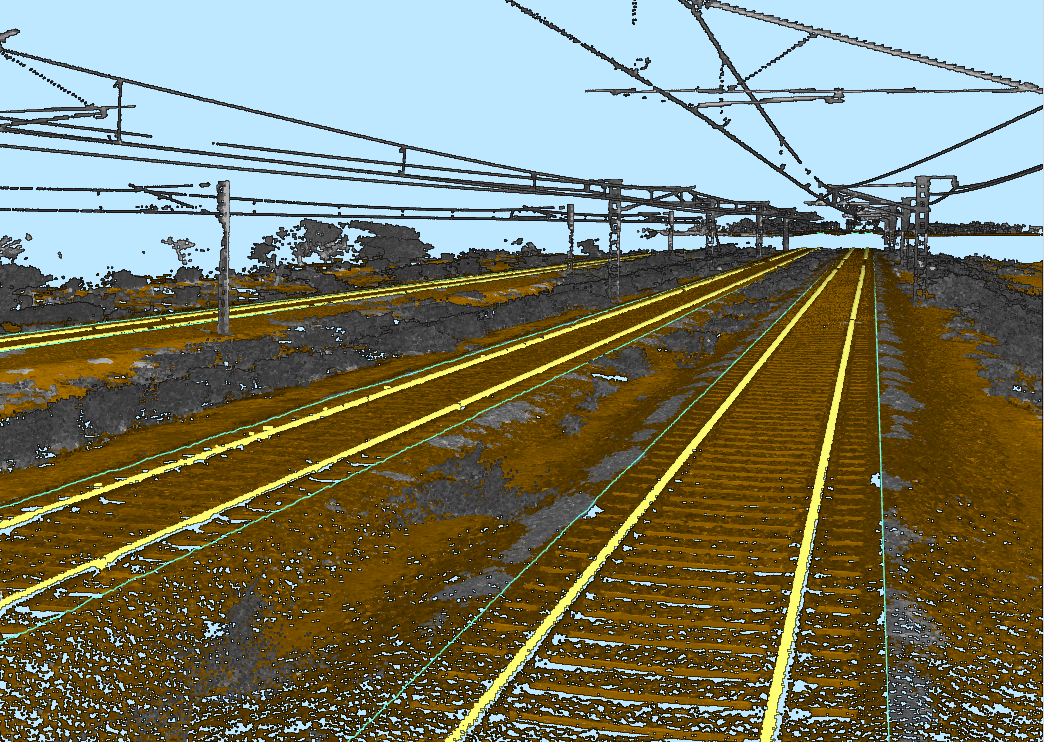
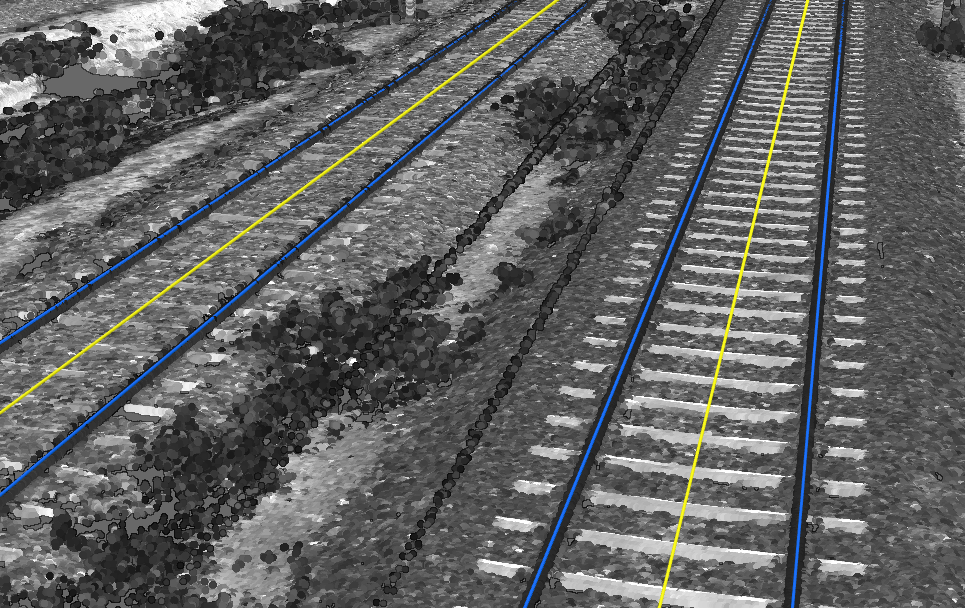
The Extract Rails From Point Cloud tool extracts 3D top of rails and centerlines from classified rail points. The 3D rails are important for accurately mapping rail tracks. Meanwhile, the 3D centerlines serve as a fundamental reference for Positive Train Control (PTC) systems. PTC systems use centerlines to monitor and control train movements, enhancing safety and preventing accidents such as collisions or derailments.
The tool is located in the 3D Analyst toolbox under 3D Features toolset > Extraction toolset.

The rail points must be pre-classified to use the tool for extracting rails and centerlines.
Since the rail lies within a specific height range above the ballast, rail points can be identified based on their height relative to the ballast. So, one way to classify them is by using the Classify LAS Ground tool to classify the ballast points, then apply the Classify LAS By Height tool to classify the rail points. To reduce the risk of misclassifying other objects as rails, it is recommended that you apply boundaries around the rail tracks when using the Classify LAS By Height tool. This approach ensures more accurate rail point classification.

Once the rail points are classified, use the Extract Rails From Point Cloud tool to extract rails and centerlines.
The tool uses a pretrained deep learning model to generate rail polylines from the classified rail points. Therefore, use of the tool requires installation of the deep learning libraries. For faster processing, an NVIDIA graphics card is recommended, though the tool will also work with just the CPU.
To achieve the expected results, two key parameters must be correctly set: Track Gauge and Rail Thickness. The track gauge refers to the distance between the inner sides of the rails. Rail thickness indicates the width of the rail’s top portion.
The tool provides predefined standard options to select from. The default is set to the most common U.S. standard. If your rail specifications are not listed in the dropdown menu, choose the Custom option and manually enter the values.
In most cases, the default settings will yield satisfactory results. For more precise control, the tool also includes two categories of parameters that allow for fine-tuning. These settings help enhance the quality of the extracted data, producing more accurate and smoother 3D polylines.

Can rails be detected in aerial lidar data?
Mobile lidar data collected along a rail corridor with a classification for rails seems like a simple process for rail detection. Is there any support for detecting rails in aerial lidar data that does not have a “rail” classification in the point cloud?
To use the Extract Rails from Point Cloud tool, rails must first be classified in the point clouds. However, rail classification in airborne lidar is more challenging than in mobile lidar due to its lower density and accuracy. Currently, we don’t have a tool that can detect rails in airborne lidar without pre-classified rail points.