Floods are the most frequent type of natural disaster; meanwhile half of the world population suffer from water scarcity for at least one month per year. Water is a dynamic, ever-changing resource, and knowing how much water (too little or too much) is in a stream today or next week is valuable information. We’re all familiar with seeing weather forecasts on the news or check weather on our phone. Now you can include streamflow in your daily routine of understanding your local environment. ArcGIS now provides 10-day streamflow forecasts for 7 million stream reaches around the world in a new Living Atlas layer and ArcGIS Online Instant App.
This initiative provides global situational awareness for water. It is used by local to national governments and other organizations to improve global water sustainability and to mitigate water-related risks, such as the flooding in Brazil last month. It is also useful in irrigation planning for agriculture, hydroelectric dam management, transportation logistics and commerce for cargo barges and ferries, and recreation planning for tour boats, paddle sports, and fishing.

The latest Living Atlas updates and ArcGIS Online release (June 2024) include a new map service of global streamflow forecasts and a new Instant App to leverage this layer for your area of interest in a custom web application. This work is the latest update to an ongoing collaboration between Esri, Brigham Young University (BYU), Group on Earth Observation Global Water Sustainability (GEOGLOWS), European Centre for Medium-Range Weather Forecasts (ECMWF), US National Oceanic and Atmospheric Administration (NOAA), NASA SERVIR, US National Geospatial-Intelligence Association (NGA), Amazon Web Services (AWS), Aquaveo, World Bank, World Meteorological Organization (WMO), and others.
Global Streamflow Forecast Service
The GEOGLOWS / ECMWF streamflow forecast service uses modeling from the European Center for Medium Range Weather Forecasting (ECMWF), and a combination of GIS and hydrologic analysis developed by BYU, NGA, and Esri to transform the ECMWF gridded runoff forecast into a vector web service.

Forecasting 7 Million Global Stream Reaches
The new GEOGLOWS 2.0 model is expanded to 7 million stream reaches globally, up from roughly 1 million previously. The forecast utilizes the ECWMF Integrated Forecast System medium range ensemble – a 10-day forecast at 3 hour intervals using a 9 kilometer grid with 51 ensemble members. It uses a new stream network derived from the United States National Geospatial-Intelligence Agency (NGA) TDX Hydro data product. TDX Hydro contains over 17 million stream reaches derived from a 12 meter resolution Airbus DEM, hydro-conditioned by NGA. For use in the GEOGLOWS project, the team at Brigham Young University (BYU) performed additional processing to remove smaller streams, included additional attributes and more. Details on BYU processing of TDX Hydro for this project can be found on the GEOGLOWS data page.

Is that a lot of water?
Thick lines in the map represent more water in the river. The colors are assigned based on likelihood of high flow, or how frequently that amount of water might occur. In hydrology this is referred to as the “return period” and is used to describe the probability the flow will be greater than a particular value in a given year. You can think of it as the average time between events, but it doesn’t imply it will be exactly that number of years before a flow of that size happens again. It is a statistical measurement, based on historical simulated flow since 1940.
The colors are loosely interpreted as likelihood of flooding. Blue is normal or below normal flow. Yellow represents streamflow which is more water than the 2-year return period or 50% probability of occurrence in any given year. A common guideline in many landscapes is a 2-year return period corresponds to a “bankfull” river, meaning the river channel or bed is full of water, but is not flooding. Orange, red, and purple represent increasingly high flows with increasing likelihood of flood and deeper water. At what high flow value flooding occurs, and the degree of risk or damage is determined by local conditions – at what flow are crops, roads, or buildings inundated and to what depth. More details on the relationship between return periods and floods is available from NOAA. Additionally the colors are tested and suitable for color blind users.

Forecast Details and Stream Names
Clicking on a stream reach will open a popup for that section of stream and show the forecast for the time currently set in the time slider, and the total upstream area of the location. The name of the stream appears as the title of the popup where available.
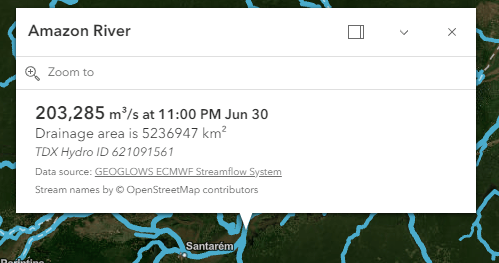
If the names of your favorite streams are not showing in the popup, you can help yourself and the rest of the community by providing their names. Through Esri’s collaboration with OpenStreetMap we host a live update version of the OSM database, so if you open an OSM editor and add new stream names, they should appear in the popups of your map within about 15 minutes.
Using the service
Since you can’t see 7 million streams all at once, the map is built from a collection of maps revealing more streams of increasing detail as you zoom in.
The map layer is time-aware and initially draws at the first time step for the forecast, which should be less than a day earlier than your current real-world time. The forecast data can be viewed sequentially or played as an animation using the time slider by Enabling Time Animation. For additional details on the GEOGLOWS / ECMWF streamflow forecast service visit this recent blog post on the service.
Streamflow Instant App
To get the most value out of a streamflow forecast its useful to be able to explore it not only in space but also time. To make this quick and easy for everyone we’ve developed a new Streamflow Instant App which combines the streamflow map service above, and a new interactive graph showing the streamflow forecast through time (hydrograph). This app is now available in beta release with more capabilities coming later this year.

The graph uses the same 10-day forecast at 3-hour intervals described above. The mean value of the forecast is shown in blue, and a probability range in grey. The range is shown is the range of 25% to 75% values of the 51 ensemble members. The return period colors and values from the streamflow service are also shown as the corresponding background color of the graph.
Configure and Publish your own Streamflow App
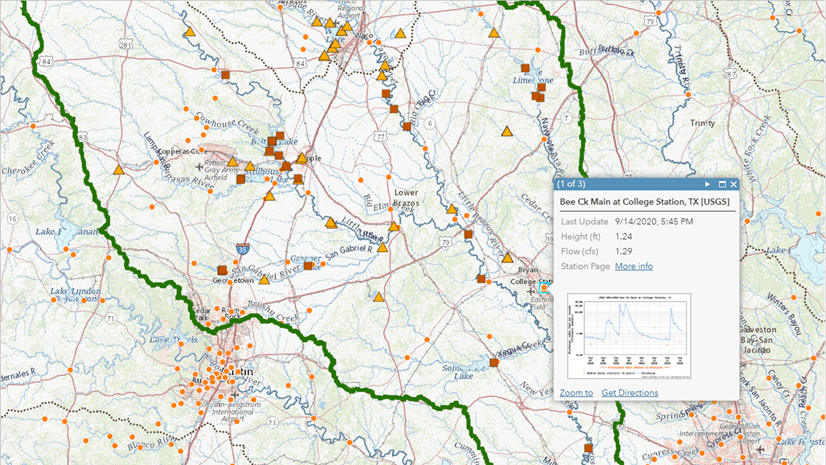
An Instant App is a web application template waiting for your map and your configurations. The first step in using the Streamflow Instant App is to login to ArcGIS Online and create a map. Common layers to include in streamflow apps include stream gages, local municipal boundaries, building footprints, agricultural boundaries, and facilities of particular interest during a flood such as hospitals, drinking water and sewage treatment facilities, power facilities, gas stations, chemical facilities, etc. Do not add the streamflow layer to your map, that happens automatically, along with the graph.
Once you have the map you like, click on Create App on the bottom left in Map Viewer, choose Instant Apps, then choose the Streamflow Viewer. Choose the configuration options you want including a title, preview the app, then publish it. Don’t worry about one widget or another, you can go back and change them after you’ve seen it and played with it a bit.
Detailed instructions on building your first Streamflow Viewer Instant App including how to which streams draw in your app, are available in the Instant Apps community blog.
Streamflow Viewer Examples
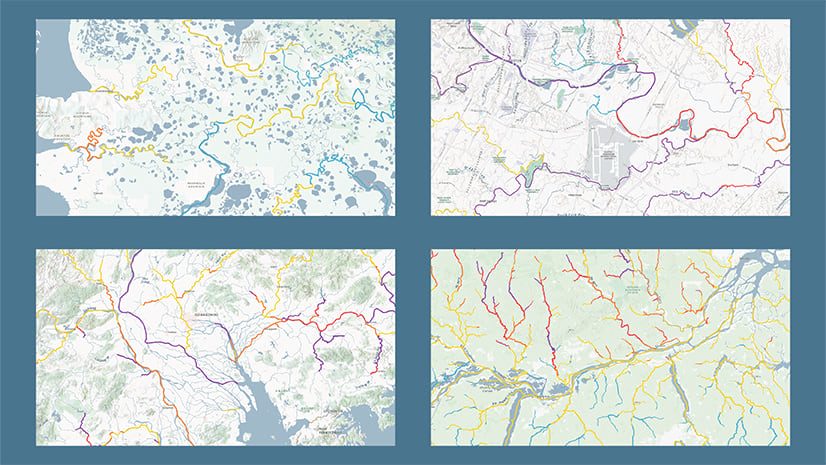
Below are a few live examples showing configurations the Streamflow Viewer Instant App with the streamflow forecast map service. Click the image to open the app, and be inspired to build your own.
The International Centre for Integrated Mountain Development (ICIMOD) is a regional center serving eight member countries of the Hindu Kush Himalaya and use GEOGLOWS for flood awareness and to inform their work on transboundary flows between countries.

Africa GeoPortal is an open mapping community for citizens and organizations working in or for Africa initiatives. Anyone working on Africa initiatives can sign up for am Africa GeoPortal account, which includes a no-cost ArcGIS Online account allowing them to share data with the community, perform analysis, and build their own maps and apps, including their own Streamflow Viewer app.

The Central Asia and Caucasus GeoPortal is Esri’s latest regional geoportal. Like Africa and other GeoPortals it provides ArcGIS Online capabilities including the ability to create a custom Streamflow Viewer apps. Awareness of drought and flood risk are both very important to this region. The view below shows the forecast for the Syr Darya river flowing into the Aral Sea.

Upcoming features
The Streamflow Instant App is now in beta release with significant new capabilities coming for the final release in October.
- Include US National Water Model Forecast as a configuration choice alternative to the global GEOGLOWS forecast.
- GEOGLOWS improved forecast accuracy with bias correction from local stream gages.
- Filtering by country and watershed in the app configuration dialog instead of through URL parameters.
- Historic flow from 1940 to present.
Understanding the Science
Additional information on the streamflow forecast modeling can be found in Hales et al (2021), and the GEOGLOWS Publications page.

Article Discussion: