When someone asks me for help improving their map, my advice is almost always to simplify. A simpler map is easier to design and easier to read. When it comes to visual communication, less is more. Try using fewer layers, fewer colors, and fewer words.
Two places where simplification is especially impactful are pop-ups and symbols.

Pop-ups
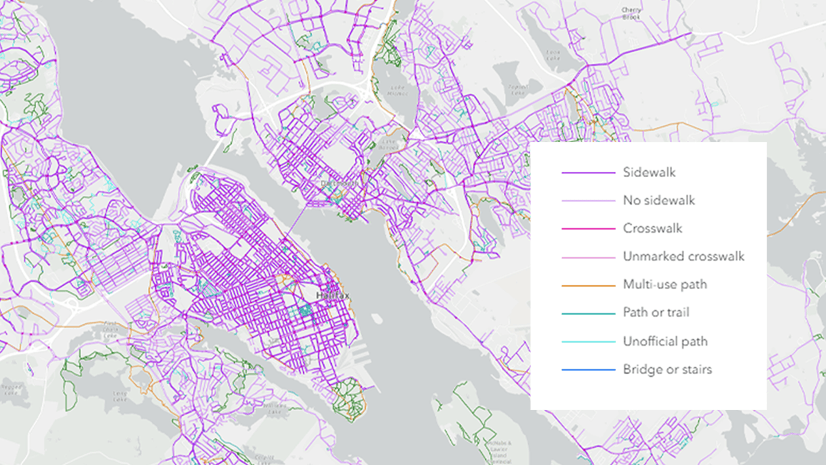
The video below shows how you can improve pop-ups in ArcGIS Online by removing fields that aren’t needed and configuring the names and formatting of those fields that are left.
Making a better map doesn’t always mean complex and time-consuming cartographic tricks—the biggest improvements are often found in small and simple steps, like tidying a pop-up.
The data shown in this video is Parks and Active Travelways from Halifax Open Data. It also features an altered version (fields added and removed) of Public Washrooms, also from Halifax Open Data.
Symbols
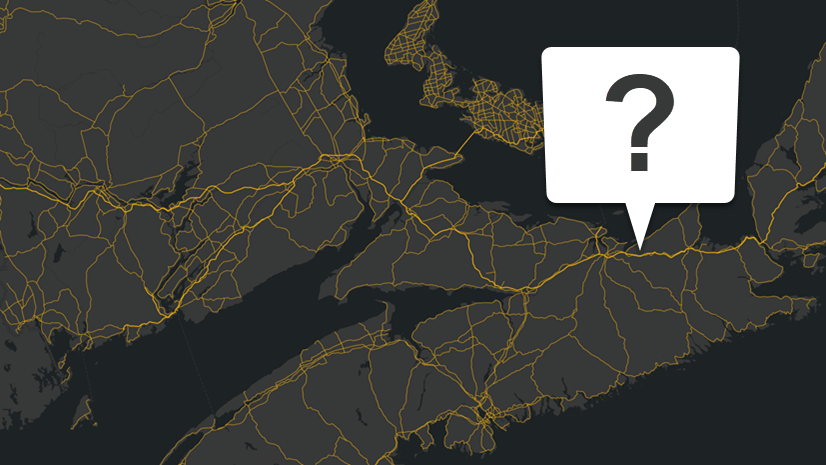
The video below shows how to simplify symbols in ArcGIS Pro. If you remove extra colors, outlines, and shapes from your symbols, you can reduce the visual clutter on your map. The result will be a streamlined design that is easier to read and understand.
The data shown in this video is Bus Stops and Transit Bus Routes from Halifax Open Data.
You may feel hesitant to take my advice regarding symbols. Perhaps you’re thinking of all your favorite detailed and complex maps. While complex maps can be very beautiful, they are also very difficult to design. When I do make a complex map, I’m even more vigorous in my pursuit of simplicity: I’m only able to include so much information because each layer and element is designed to be as simple as possible. Take a second look at your favorite maps: how complex are the symbols, really?
Here are a few examples to consider:
- Protected Areas Database of the United States (PAD-US) – IUCN Protected Area Categories by the United States Geological Survey is a complex and detailed map. But zoom in to look at its symbols. The polygons have solid fills and no outlines. The roads, rivers, and state outlines are also simple. The cities don’t have symbols art all—just labels.
- Hurricane Aware has complex symbology, with multiple elements that need to be decoded. But there are rarely more than two hurricane tracks on the map at a time, and there are no other thematic layers. This means that the complex symbols have room to breathe.
- When all aspects of the map are simplified, the effects can be striking, as in this map of White Stork Migration Routes by Jack Sapoch of Lighthouse Reports.
So if you’re not sure how to improve your map, try to simplify it!


Article Discussion: