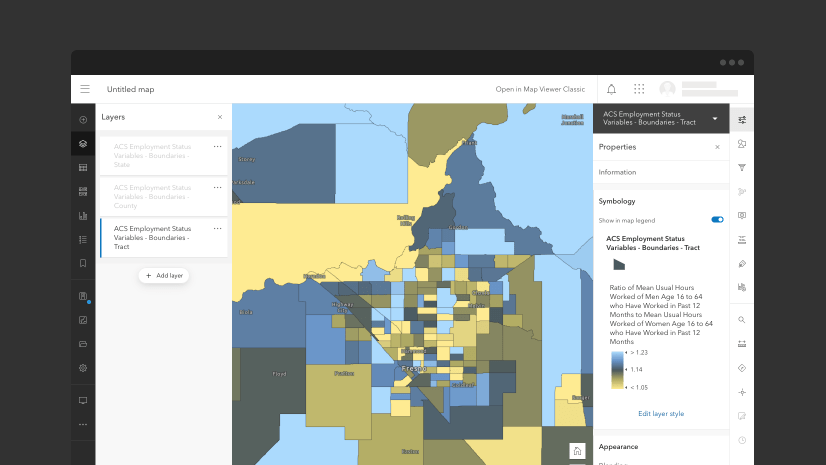
The new Map Viewer, formerly known as Map Viewer Beta, is available for general use. This next generation map making tool provides new ways to visualize data and build compelling web maps. New capabilities were also added in our latest update.
The original Map Viewer is now called Map Viewer Classic and remains the primary viewer for a limited time. Administrators or individual users can make the new Map Viewer the primary viewer through their organization or user settings. Map Viewer Classic will be available until the new Map Viewer reaches functional parity.
Let’s explore what’s new in Map Viewer including sketch layers, interface improvements, charts, and the create app experience. We’ll also share some helpful resources including a functionality guide for the two map viewers.
Sketch layers
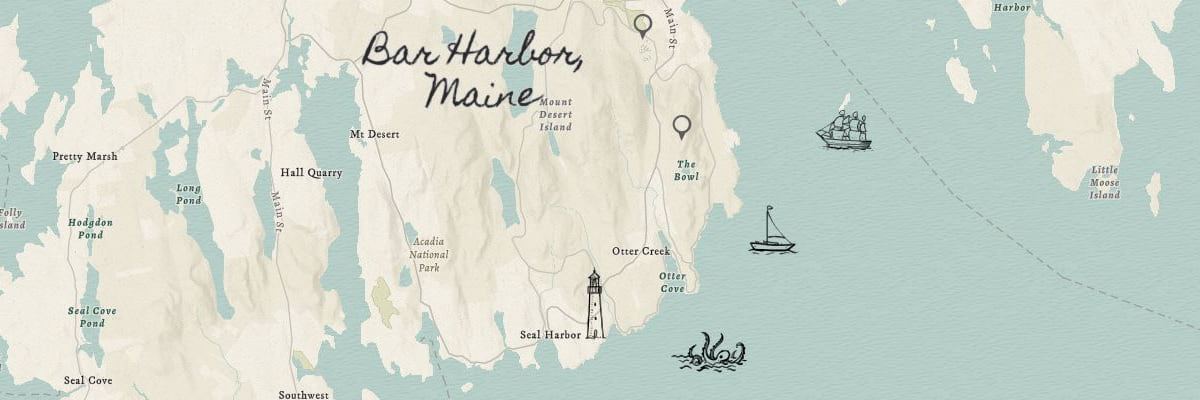
Draw features and place stamps anywhere on your map using sketch layers, a new type of feature collection saved with the map. This is a quick and powerful way to add detailed annotations directly to your map. Add stamps (symbols), lines, polygons, rectangles, circles, and text to your map. Choose from almost 1,000 new stamps, ranging from basic pins to trees, buildings, and animals. You can also add descriptive information that appears in pop-ups when the features in your sketch layer are clicked.
Learn more about using sketch layers
Interface improvements
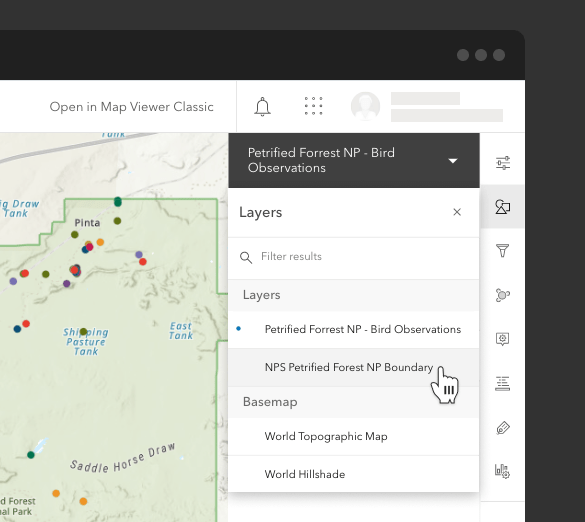
While developing the new Map Viewer, we’ve received a lot of helpful feedback from our users and used it to improve the interface. For example, when styling multiple layers and configuring pop-ups, you’ll immediately notice how quickly you can switch between your layers. You can also expand your map display by hiding the interface elements and using full-screen mode.
Learn more about Map Viewer interface improvements
Charts
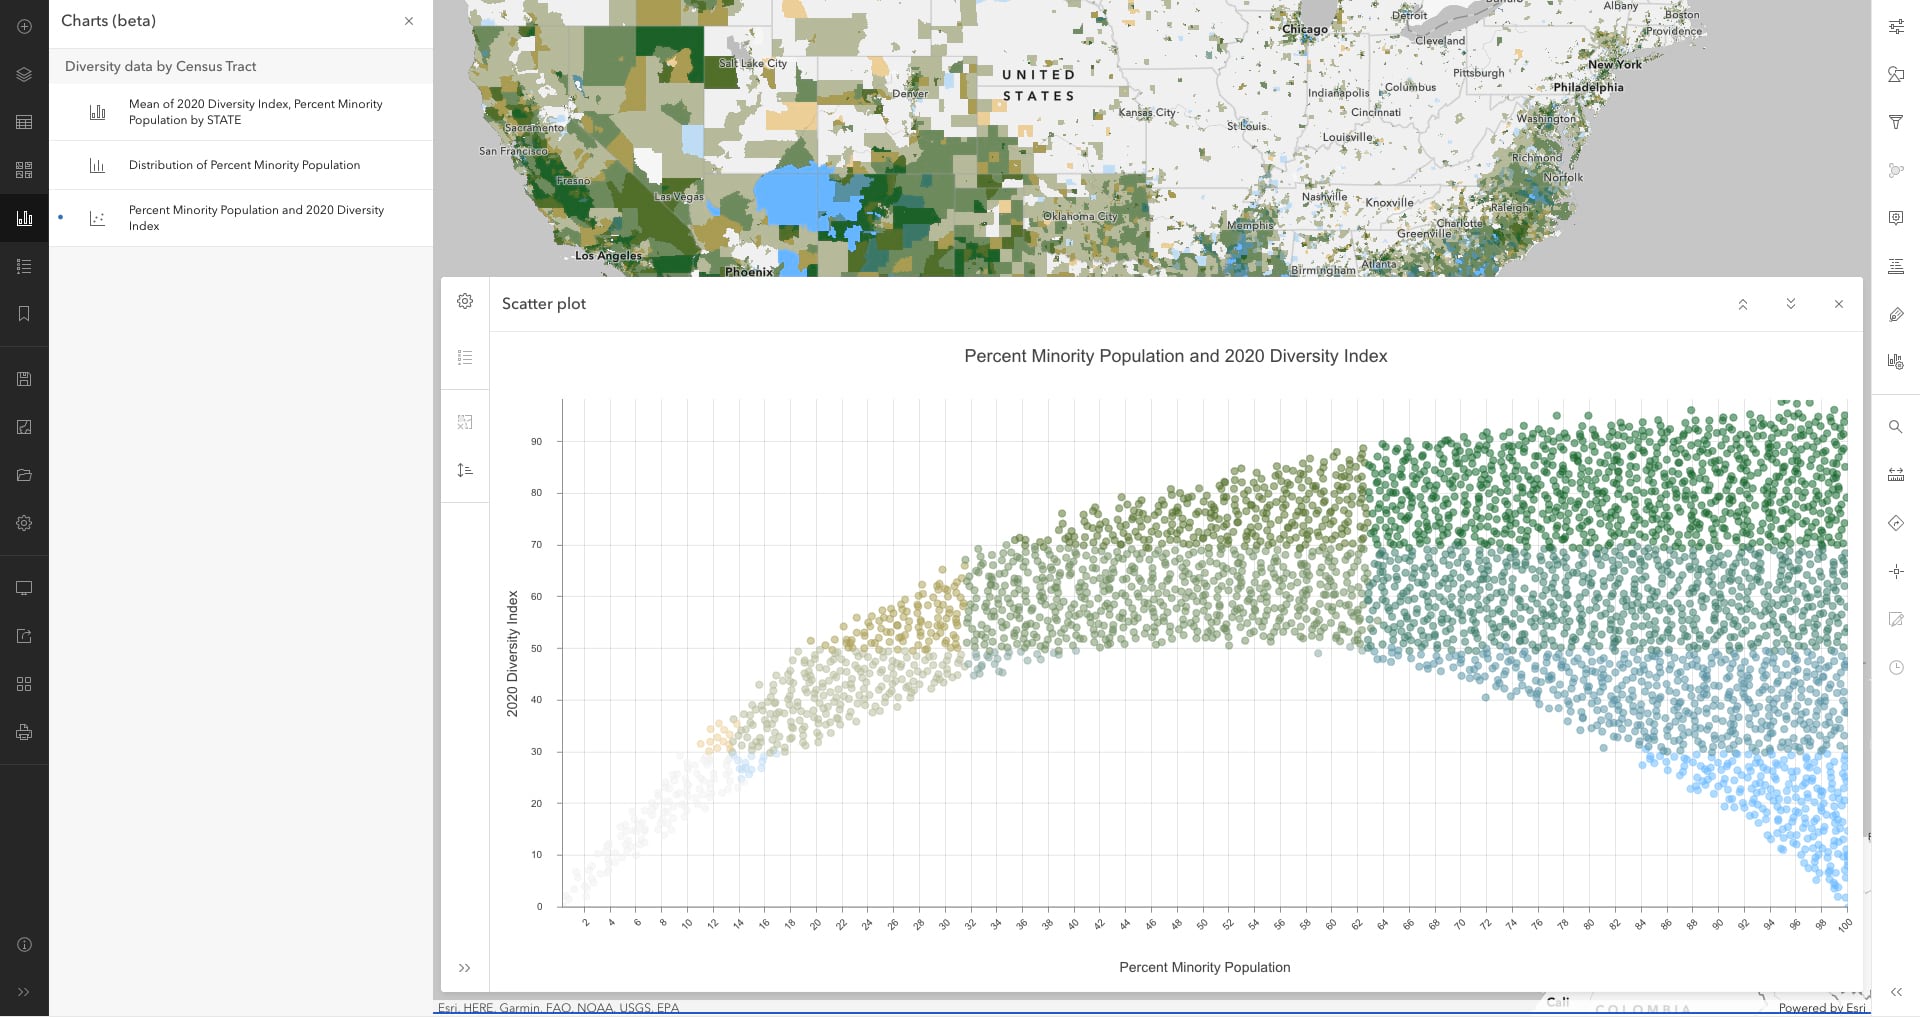
Charts are now available to help you uncover patterns, trends, and relationships in your data. Pairing you map with a chart can help you tell a more complete story with your data. Three types of charts are currently available: bar charts, histograms, and scatter plots. After you create your chart, you can make dynamic selections between your charts and maps: Selecting one or more features in your chart will select the same features in your map. Charts are currently in beta.
Learn more about charts in the new Map Viewer
Create apps from your map
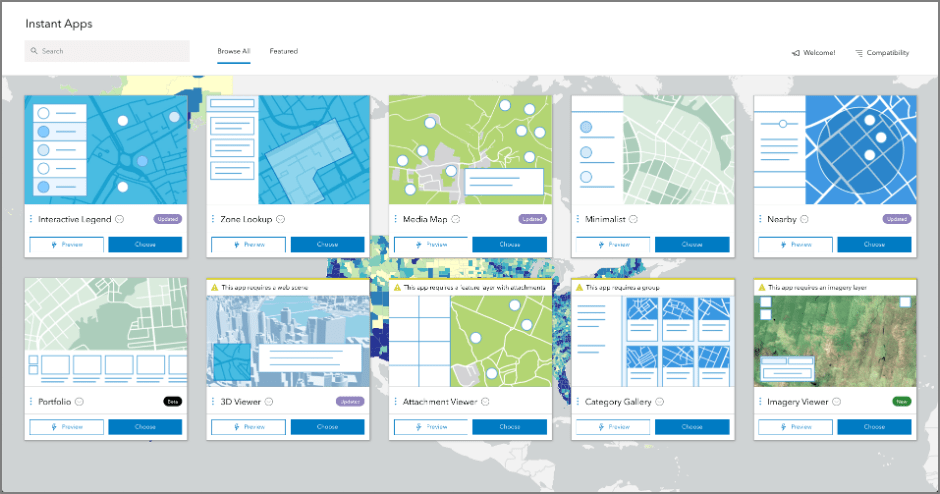
Directly create ArcGIS Instant Apps, ArcGIS Dashboards, or ArcGIS StoryMaps from the new Map Viewer. The Instant App gallery, a collection of focused apps, each with a specific purpose, is launched directly from the create app button. In the gallery, you will be guided to select the best app for your map and data. The configuration experiences provide speed and ease as well as deep capabilities when needed. Using the express setup, you can choose and configure an Instant App in under 5 minutes. The full setup is available if you want to configure additional capabilities.
Learn more about ArcGIS Instant Apps
The new ArcGIS Dashboards, now out of beta, is also directly accessible from the create app button. Be sure to take advantage of its latest capabilities including creating advanced formatting using ArcGIS Arcade in list and indicator elements, using data expressions to unlock new insights in your data, enabling selection-based display to render dashboard elements only when a selection is made elsewhere on the dashboard, and leveraging the capabilities of the new Map Viewer including dot density and multi-element pop-ups.
Learn more about the new ArcGIS Dashboards
Functionality guide
Both the new Map Viewer and Map Viewer Classic are available for production use by all customers. Because they are built using different versions of the ArcGIS API for JavaScript, and some workflows are not yet available in the new Map Viewer, we created a functionality guide. This will help you understand when you need to use a specific map viewer to complete your workflow.
Explore the functionality guide
Additional layer support
You can now add, search, and style imagery layers in the new Map Viewer. This allows you to work with your imagery layers and incorporate more of the ready-to-use ArcGIS Living Atlas of the World content into your maps. Configuring pop-ups and other properties for imagery layers still needs to be done in Map Viewer Classic.
Join the conversation
The ArcGIS Online Esri Community (formerly known as GeoNet) provides a forum for questions, discussions and feedback. The ArcGIS Online team closely monitors this space to understand how you are using the map viewers, what you like, and where you see opportunities for improvement. With the release out of beta, the Map Viewer Beta place will be closed, and the content will be relocated to the ArcGIS Online place. Use your ArcGIS account with Esri access enabled to participate in the community.



Commenting is no longer enabled for this article