This post was originally published on July 25, 2013, and has been updated. The last previous update was July 10, 2024.
An important, but sometimes overlooked, part of authoring good web maps is configuring pop-ups for layers. A good pop-up can turn a list of raw data into more meaningful information and provide an informative experience for viewers of your map.
Pop-ups are created by configuring and adding content elements. The elements are; Fields list, Chart, Image, Text, and Arcade. Arcade can also be used to create expressions that can be used in text elements. You can add multiple elements of any type and arrange them in any order, orienting them vertically, horizontally, or both.
For an overview, see Pop-ups: the essentials. This blog tutorial provides an overview of using pop-up text elements, covering the essentials to enable you to use them effectively.
Prior to adding content elements, it’s a good idea to configure layer fields and the pop-up title. See the following for more information:
Configure fields (in Pop-ups: the essentials)
Pop-up title (in Pop-ups: the essentials)
Quick links
Use the links below to jump to sections of interest.
Configure text elements
- Text from one field
- Formatted text with fields and links
- Text element using HTML
- Text element using Arcade
Pop-up text element examples map
You can view the examples outlined in this blog article using the pop-up text element examples map. Once you open the map, Sign In to save the map to your Content. You can also follow along without signing in.
Each pop-up configuration is presented in a unique layer within a group layer, with the layer name indicating how the pop-up has been configured.
Open the layer pane from the Contents (dark) toolbar, then open the group layer.
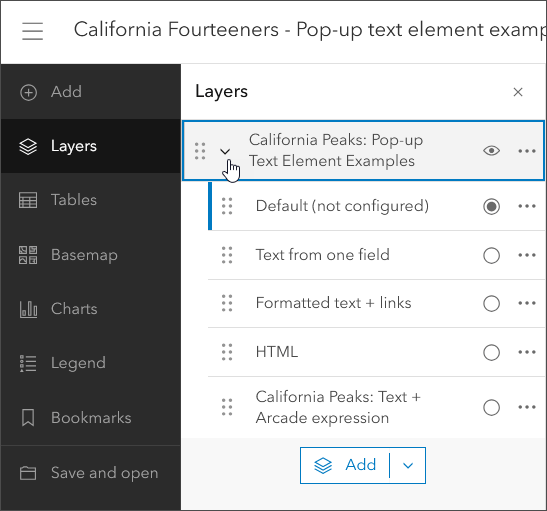
To view the pop-up, toggle the visibility for the desired layer.
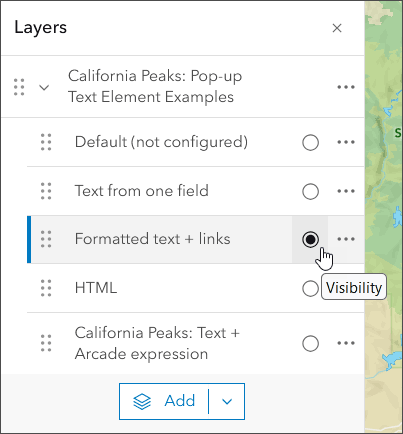
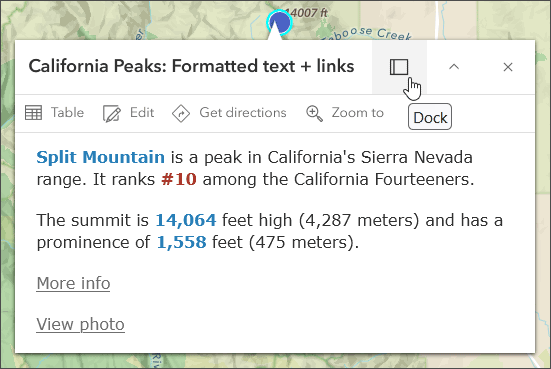
Click a feature in the map to view the configured pop-up.
Tip: Click the Dock button to dock the pop-up and view more of its content.
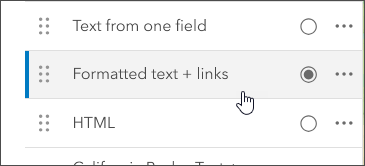
To see how the pop-up was configured, ensure the layer is selected (a blue highlight bar appears on the left).
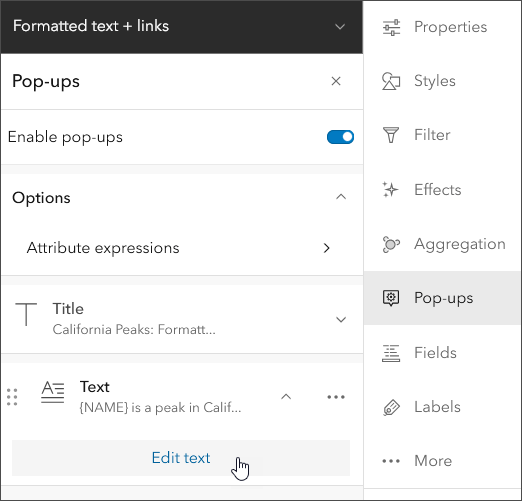
Click Pop-ups in the Settings (light) toolbar. Click the arrow to expand the element, then click Edit text to open the text element editor to see how it has been configured.
Add a text element
Click Add content to display a list of elements. Then choose Text.
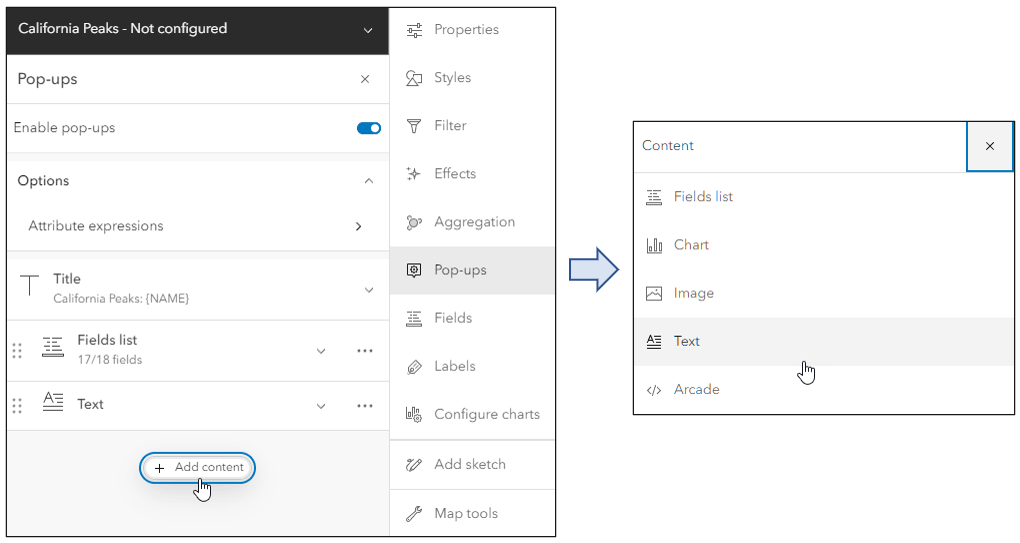
When you add a text element, the text editor opens. Using the the editor you can type “{” or use the Field list tool to select a field or expression, enter plain text, add links, use HTML, and use formatting tools to format the text. Hover over any button to learn more.

Configure the text element
Follow the steps below to configure the text element in different ways. See the pop-up text element examples map to view the example layers and select and toggle their visibility to examine how they have been configured.
Text from one field
In some cases, an attribute field may contain descriptive text that you can add directly to your Text element. Type “{” to display a list of fields or click the Fields list tool, then select the field with the description.
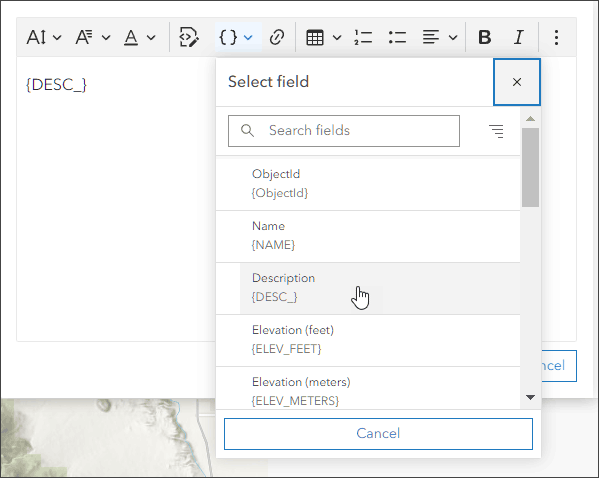
When finished, click OK. The layer pop-up shown below uses the contents of the {DESC_} field to add a description for the feature.

Formatted text with fields and links
Begin entering plain text and fields as desired. You can change the typography and choose foreground and background colors to emphasize specific information.
To add a link, select the text you want to use as the link, then click the Link button. Enter the full URL (e.g., https://www.esri.com). Note that only https links are supported.
To add a link that is in a field, the field must be added manually using curly braces ({field}).
Tip: you can first add the field then copy and delete it. Enter the link text, click the Link button, then paste the copied field into the link input.

Text element using HTML
Click the Source button in the editor to enter HTML. When finished, click the Source button again to view the results, then click OK. See Supported HTML for a list of supported HTML tags and attributes you can use.
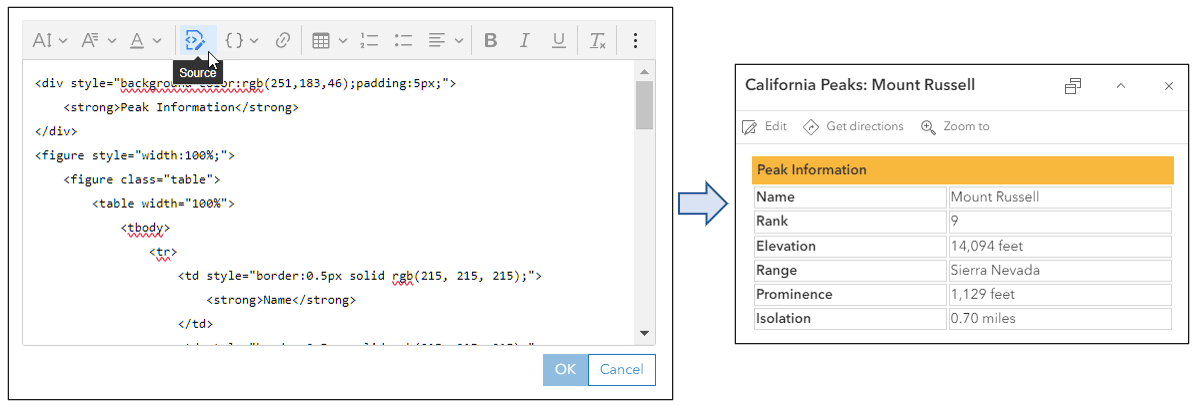
Using the HTML shown below, the pop-up was configured to display a table listing information about each peak using several other fields. You can also use the Insert table tool to help design the table, though it will likely need to be finished and finalized by editing the HTML directly.
<div style="background-color:rgb(251,183,46);padding:5px;">
    <strong>Peak Information</strong>
</div>
<figure class="table">
    <table width="100%">
        <tbody>
            <tr>
                <td style="border:0.5px solid rgb(215, 215, 215);">
                    <strong>Name</strong>
                </td>
                <td style="border:0.5px solid rgb(215, 215, 215);">
                    {NAME}
                </td>
            </tr>
            <tr>
                <td style="border:0.5px solid rgb(215, 215, 215);">
                    <strong>Rank</strong>
                </td>
                <td style="border:0.5px solid rgb(215, 215, 215);">
                    {RANK}
                </td>
            </tr>
            <tr>
                <td style="border:0.5px solid rgb(215, 215, 215);">
                    <strong>Elevation</strong>
                </td>
                <td style="border:0.5px solid rgb(215, 215, 215);">
                    {ELEV_FEET} feet
                </td>
            </tr>
            <tr>
                <td style="border:0.5px solid rgb(215, 215, 215);">
                    <strong>Range</strong>
                </td>
                <td style="border:0.5px solid rgb(215, 215, 215);">
                    {RANGE}
                </td>
            </tr>
            <tr>
                <td style="border:0.5px solid rgb(215, 215, 215);">
                    <strong>Prominence</strong>
                </td>
                <td style="border:0.5px solid rgb(215, 215, 215);">
                    {PROM_FEET} feet
                </td>
            </tr>
            <tr>
                <td style="border:0.5px solid rgb(215, 215, 215);">
                    <strong>Isolation</strong>
                </td>
                <td style="border:0.5px solid rgb(215, 215, 215);">
                    {ISOL_miles} miles
                </td>
            </tr>
        </tbody>
    </table>
</figure>
Text element using Arcade
Arcade is an expression language that is supported across ArcGIS. It can be used to perform calculations, manipulate text, and evaluate logical statements.
In pop-ups, Arcade is used in two ways; to create expressions in text elements that can be evaluated like fields, or as separate elements that return a block of content.
This pop-up example uses a single expression ({expression/expr0}) to return a string describing the ranking of the prominence.
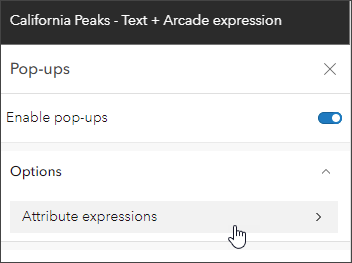
To create an Arcade expression, open Options in the Pop-up pane and click Attribute expressions.
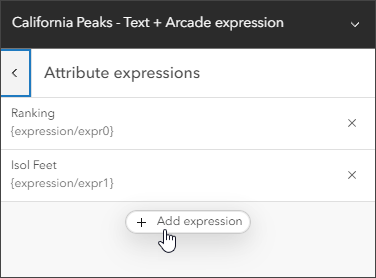
If there are existing expressions, a list of them will be displayed. Click the expression to open in the Arcade editor. To add a new expression, click Add expression.
This opens the Arcade editor. Enter the desired Arcade. Click Run to verify that it works.
Tip: change the title to make the expression easier to find and understand. When finished click Done.
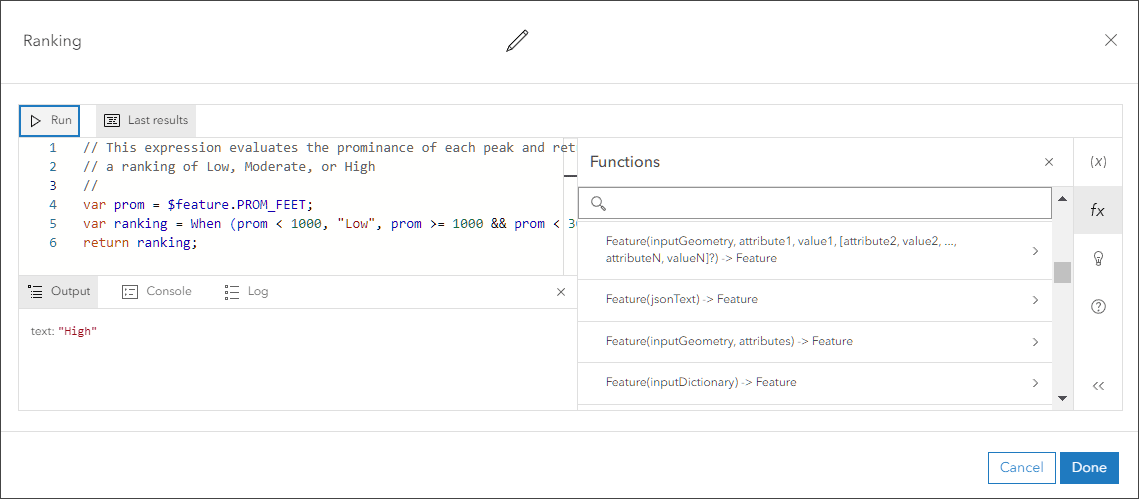
The Arcade shown below uses the integer value of prominence in feet to return a string which indicates the relative prominence ranking. For more information and to see more Arcade examples, see Pop-ups: Arcade essentials.
// This expression evaluates the prominance of each peak and returns
// a ranking of Low, Moderate, or High
var prom = $feature.PROM_FEET;
var ranking = When (prom < 1000, "Low", prom >= 1000 && prom < 3000, "Moderate",
       prom >= 3000, "High", "N/A")
return ranking;
More information
Using text elements, you can apply a variety of techniques and style options to craft compelling and interesting pop-ups. Open California Peaks – Pop-up text element examples to view a variety of pop-up configurations, including those covered in this post.
For more information see the following:
- Pop-ups: the essentials (Blog)
- Configure pop-ups (Help)
- Getting Started | ArcGIS Arcade (Documentation)


Commenting is not enabled for this article.