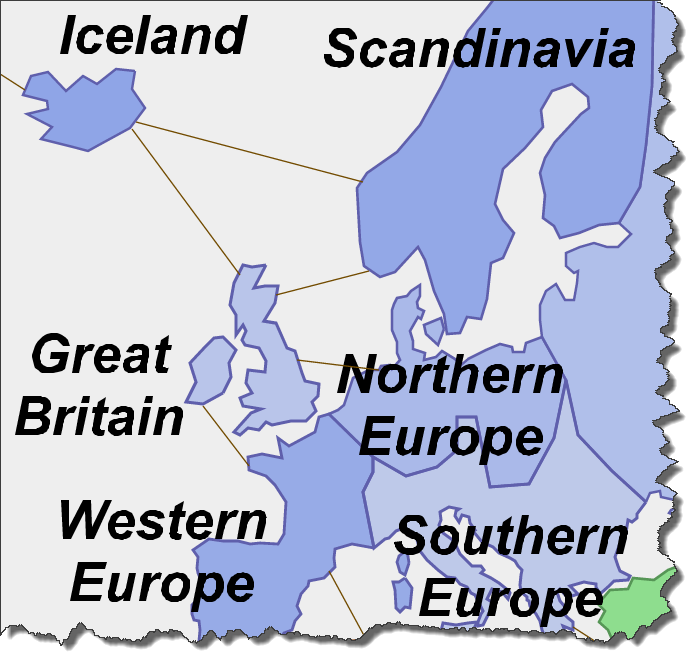
Labeling is important for most, if not all, maps so people can interpret and describe patterns they see and to relate them to places. In online web maps, labels are usually only seen as part of the basemap (and un-editable) or as part of the textual information in a pop-up (and un-seen until opened). But how do you add labels to features in ArcGIS.com Map Viewer so they appear as part of the map? In part one of this two-part blog entry we describe how you can make your own label operational overlays using the Feature Outline Mask tool on annotation feature classes in ArcMap to convert labels to feature geometry. When these are converted to shapefiles they can be added to web maps you make on ArcGIS.com without having to create and publish map services using ArcGIS Server. Part two of the blog entry will take the approach a stage further by showing you how to add symbols and other graphics to your map as feature geometry.
To demonstrate the technique, we’ll use a world map designed in a similar style to RISK, the board game originally produced in France in 1957 (figure 1). This map provides a good case study because it:
- is composed entirely of continuous polygons which obscures the basemap and labels (and which acts as the basemap itself); and
- contains boundaries that are not coincident with any obvious geography so it requires unique labels.
As figure 1 shows, the pseudo-political geography of the map is hard to describe without labels. You could add them as pop-ups but they require the map reader to have to work harder than necessary to discover basic information that the map should display by default. It could also be argued that the map looks bare or incomplete without labels but since they do not relate to real-world geography it’s unlikely that any published basemap service labels will be useful.
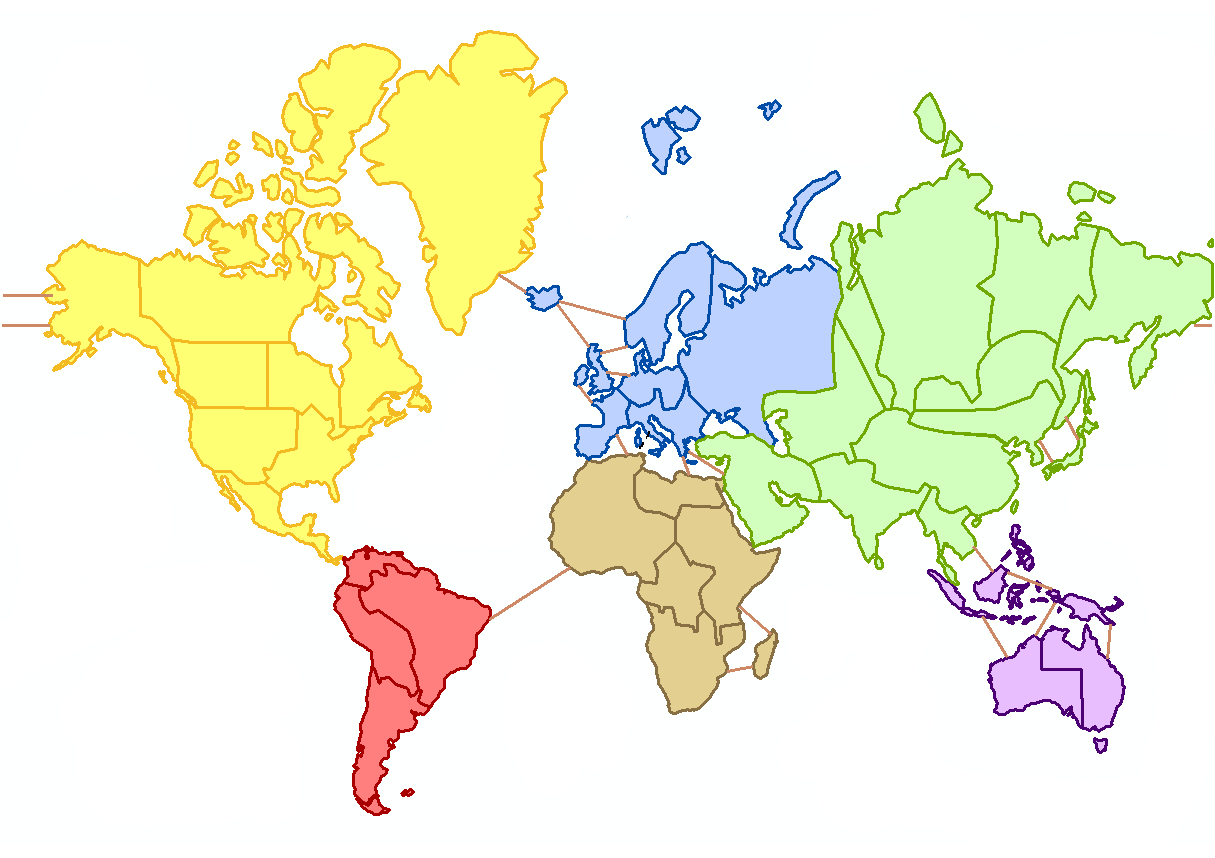
Figure 1. World map in the style of the RISK board game.
1. Setting the projection in ArcMap
The starting point for creating operational overlay data for your web map will most likely be ArcMap, in which the map in figure1 was created (the connectors you can see are part of the map’s design for the game). Because the operational overlays will be published on ArcGIS.com you first need to ensure that the map is set up in ArcMap using the Web Mercator Auxiliary Sphere projection. The map projection is set in the Layer Properties (figure 2) and will ensure that subsequent processing steps will create graphics that display correctly when they are eventually added to your ArcGIS.com web map.
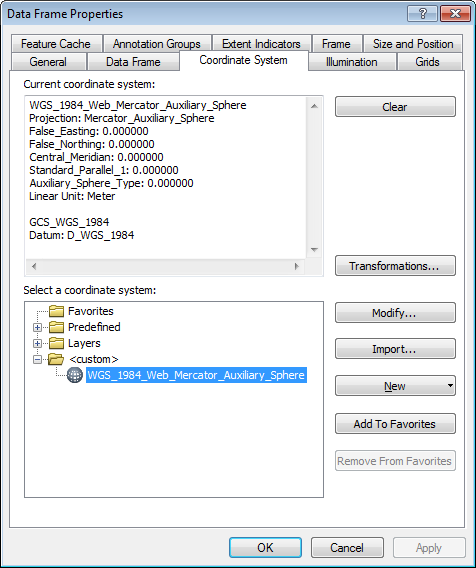
Figure 2. Web Mercator Auxiliary Sphere selected in ArcMap Data Frame Properties.
2. Adding map labels in ArcMap
In ArcMap data view, you can now label features as you would normally do to alter the font, size and position (read Essential Labeling Concepts for more details on labeling maps in ArcMap). Design your labels so that they function at an appropriate reference scale which fixes the size of text and symbols to draw at the desired height and width at that scale. The labels for the RISK map need to be seen when the map is viewed as a whole so a reference scale of 1:125,000,000 was used (figure 2), they were based on feature attributes, and added to the map using the Label Manager. (read About Displaying Labels for more information).
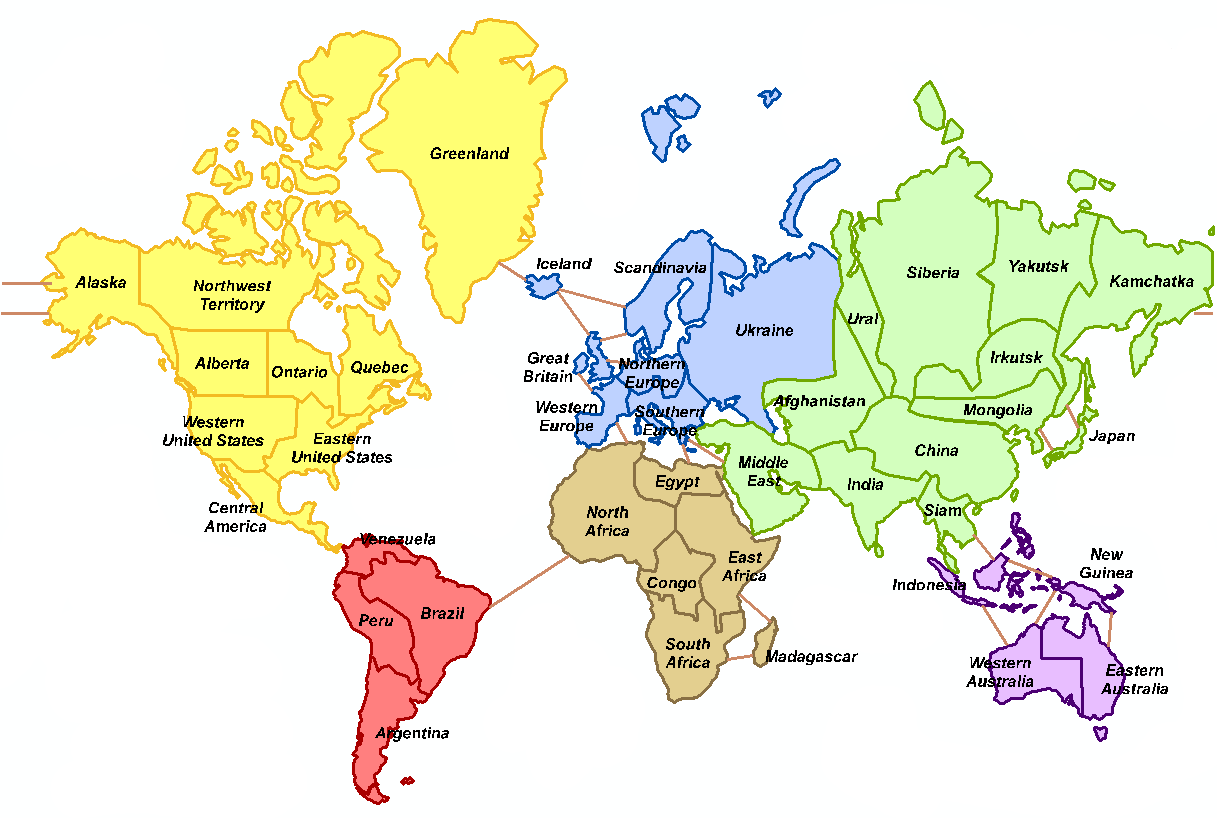
Figure 3. RISK map with labels in ArcMap.
3. Converting labels to annotation
Once you have your labels designed appropriately, right click the layer in the Table of Contents and select Convert Labels to Annotation. In the subsequent dialog box, store your annotation in a database and select an appropriate feature class name. The annotation feature class will then be added to your Table of Contents.
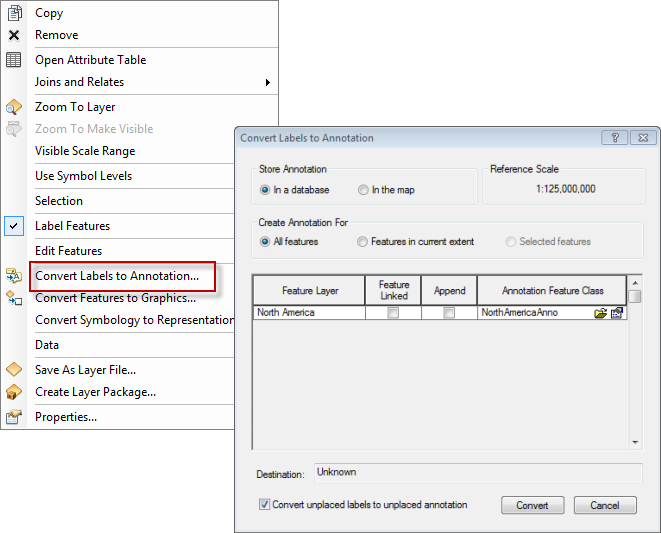
Figure 4. Convert labels to an Annotation Feature Class.
4. Converting annotation to feature geometry
Your labels are now stored as an annotation feature class but for the web map they need to be stored as feature geometry. For this, you use the Feature Outline Masks tool to convert the geometry of the label outlines to polygons in a new polygon feature class. First, locate and run the Feature Outline Masks tool in System Toolboxes > Cartography Tools > Masking Tools (figure 5). Select your annotation feature class as your Input Layer and define an Output Feature Class. The only two parameters that will need changing are the Margin and Mask Kind. Set the Mask to zero and the Mask Kind to EXACT. Ordinarily the tool is used to create mask polygons at a specified distance and shape around features but defining these parameters in this way creates polygons exactly the same shape as the input layer, creating a replica of your labels as polygons. Click OK and once the tool has finished the polygon feature class of your labels will be added to ArcMap.
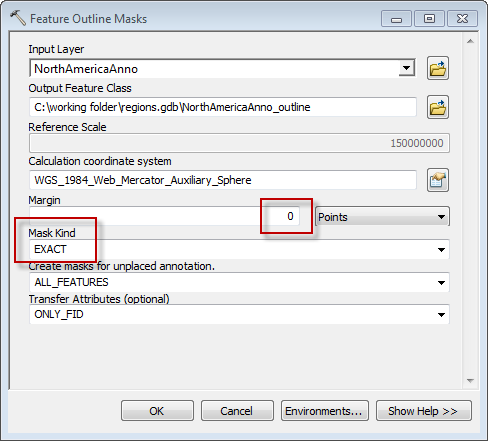
Figure 5. Setting parameters using the Feature Outline Masks tool.
5. Converting your polygon feature class to a shapefile
Your new polygon feature class will appear geometrically the same as the input annotation feature class. You have one final step to perform in ArcMap before you can add the labels to your web map because you cannot add data held in a geodatabase to ArcGIS.com. This final step converts your polygon feature class into a shapefile format which can be added to an ArcGIS.com web map.
Right-click the polygon feature class in your Table of Contents > Data > Export Data and save your shapefile with a suitable filename.
6. Adding your labels shapefile to ArcGIS.com
You can now add your labels shapefile to your ArcGIS.com web map using the Add button (figure 6).
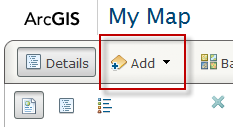
Figure 6. Use the Add button in ArcGIS.com to add shapefiles.
Figure 7 shows the labels shapefile added to the RISK map in ArcGIS.com.
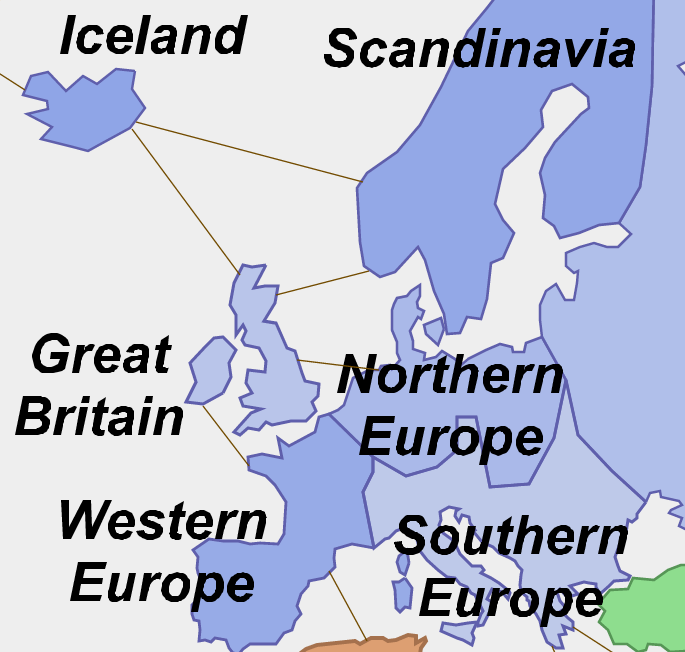
Figure 7. Labels shapefile added to the ArcGIS.com web map
Arranging the labels layer so it is above the other data will position labels on the top of the other content in your web map. As you zoom and pan across the map, the labels behave like any other geographic feature and scale and move accordingly. You can turn the labels on and off in the Contents tab and you can also specify a pop-up to be linked to the label if you wish. Figure 8 shows the finished map which can be viewed as a web map at ArcGIS.com (best viewed in Chrome or Firefox). Because the labels have been added as an additional operational overlay it overcomes the problem of continuous polygons obscuring basemap detail. The labels allow us to interpret an otherwise unknown geography, having been designed specifically for the map.
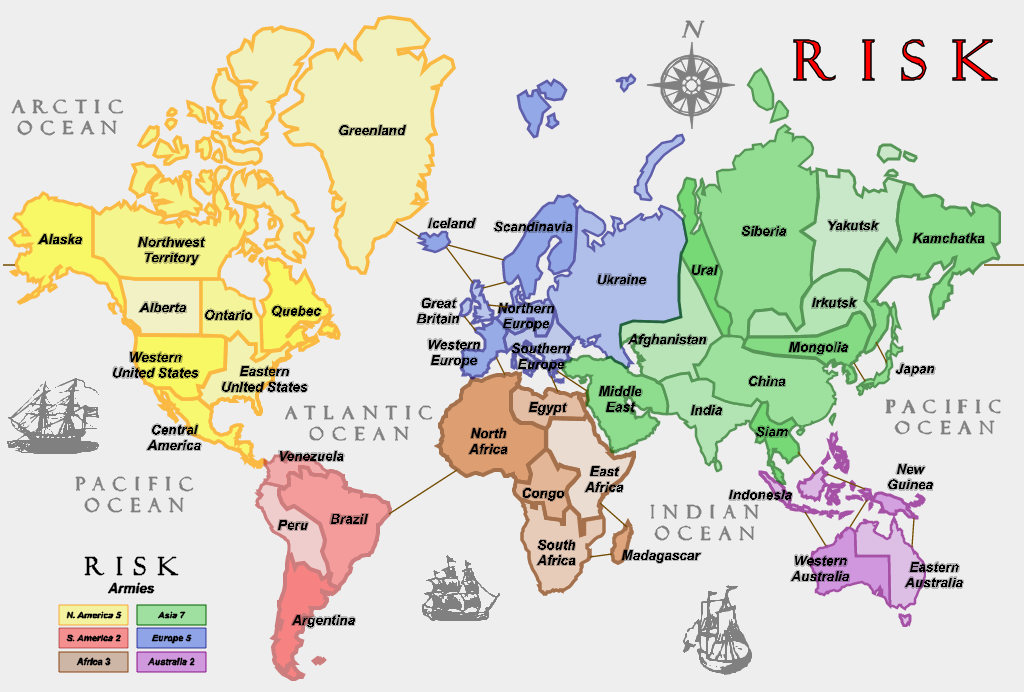
Figure 8. RISK as an ArcGIS.com web map showing the addition of labels as an operational overlay.
This blog entry has shown you how to migrate labels created in ArcMap into ArcGIS.com using the Feature Outline Masks tool to create a polygon feature class which is then added to your web map as a shapefile. In part two, we explain how you can create a halo effect for labels in ArcGIS.com and how you can add other symbols and graphics to your web map.
Thanks to Craig Williams, ArcMap Product Lead, for help in writing the blog entry

Commenting is not enabled for this article.