With the latest update of ArcGIS Online, we’ve made several functional enhancements to the attribute table. One of these improvements is the ability to calculate values for fields in your hosted layers and tables directly within Map Viewer!
In this blog you’ll learn how we’ve improved on the previous field calculation experience (still available in the Data tab and Map Viewer Classic) to bring you a new, rich, and comprehensive interface to perform your calculations.
Accessing calculate field
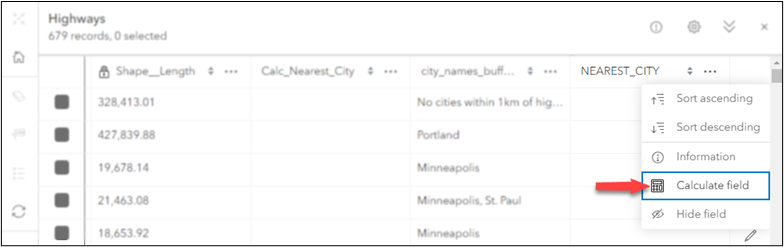
If you’ve used calculate field before, the steps to access the workflow in Map Viewer should be familiar. The option to calculate field values is available for layer owners and administrators via the field options menu in the attribute table.
After selecting the field to calculate, you’ll be presented with a choice of two languages to author your expression: Arcade or SQL. Currently, only Arcade is supported in this new experience, but support for SQL is planned for a future release.
What’s new?
Immediately, you should notice that this new workflow is much more conducive to data exploration, validation, and interaction. Some key improvements we’ve made to the field calculation experience include:
- Incorporation of the Arcade editor and its associated functionality (Intellisense, code auto-completion, in-editor help documentation, syntax highlighting).
- Greater insight into your layer schema and current attribute values to aid in authoring a successful expression.
- An improved experience for handling and viewing errors if your calculation fails.
- The ability to download your Arcade expression as a text file (.txt) after running your calculation to facilitate reuse.
The field calculation workflow provides two distinct methods to view your dataset: a test feature table and a map view. In addition to exploring your data, the map and table can also be used to test your expression result on individual features prior to running the final calculation.
By default, both the map and test feature table will display. However, depending on your data (or personal preference) you may want to display the test feature table or map exclusively. Use the buttons in the top right corner to switch between the different views. The Map button will display only the map view, the Table button will display only the test feature table, and the Map and table button will display both simultaneously.
Exploring the new experience
As we’ve mentioned above, there are many powerful features now available in Map Viewer’s calculation experience. Let’s review how to leverage this new functionality when calculating values for your fields.
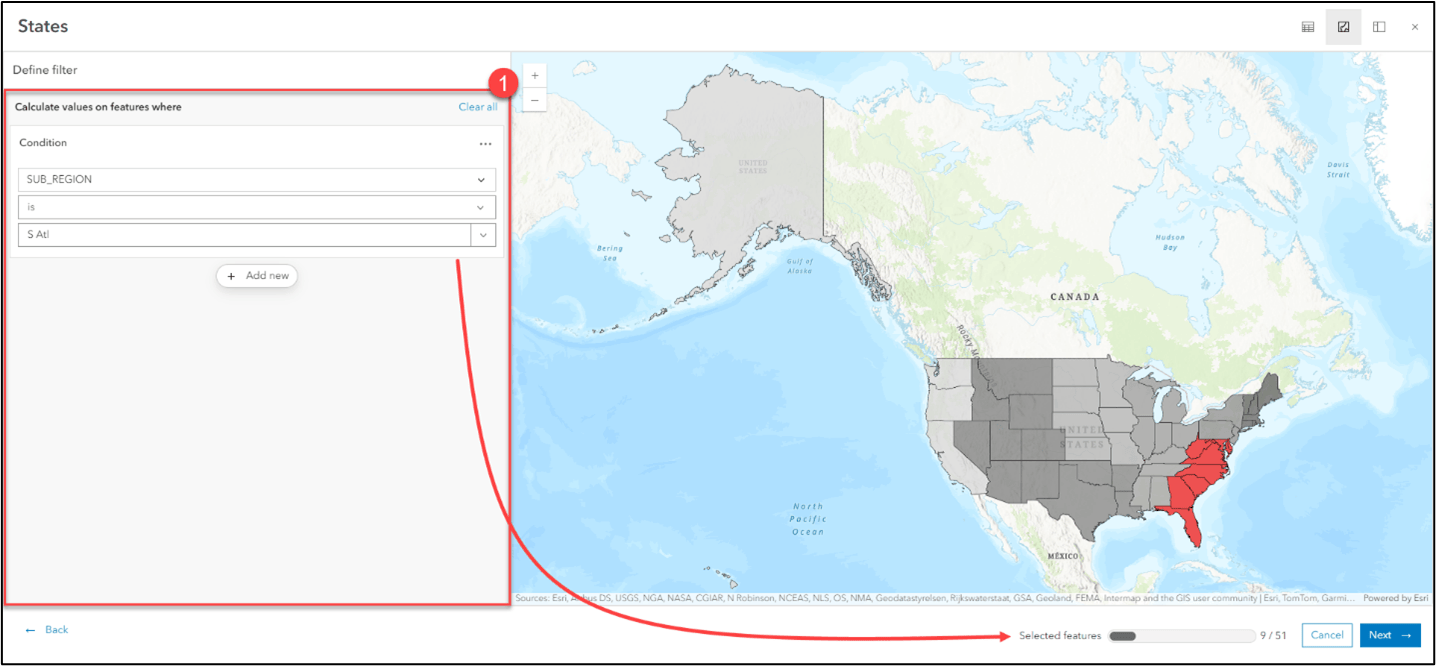
(1) Calculation filter
This optional filter determines what feature(s) in your layer will receive the calculated value. If no filter is set, the calculation will apply to all features in your layer. The number of features in the layer that will receive the calculated value is indicated by the selected features count located on the bottom of the window.
(2) Test feature table
The test feature table displays a subset of features, up to 40, from your dataset. It provides context on how to build your expression and gives insight into the calculation results. If you’ve set a calculation filter, only features that meet the filter criteria will be displayed here. There are two views available for this table: Test features and Preview values.
- By default, the table will be open to the Test features view. In this view you’re able to see all fields and respective attribute values for the included test features.
- The Preview values view is used to preview the calculated value for the test features based on the expression you’ve authored. It will also alert you to any errors found in the test features prior to running the calculation on the full dataset. You’ll need to ensure that no errors are present in your test features before you can run your calculation on the entire dataset.
(3) Test feature filter
Unlike the calculation filter, the test feature filter does not affect what features receive the calculated value. Rather, this filter is available to give you greater control over what test features do (or don’t) display in the table. For example, if you know what the expected calculated value of a specific test feature should be, you can compare that with what’s returned in the Preview values view. This is particularly helpful for validating your calculation.
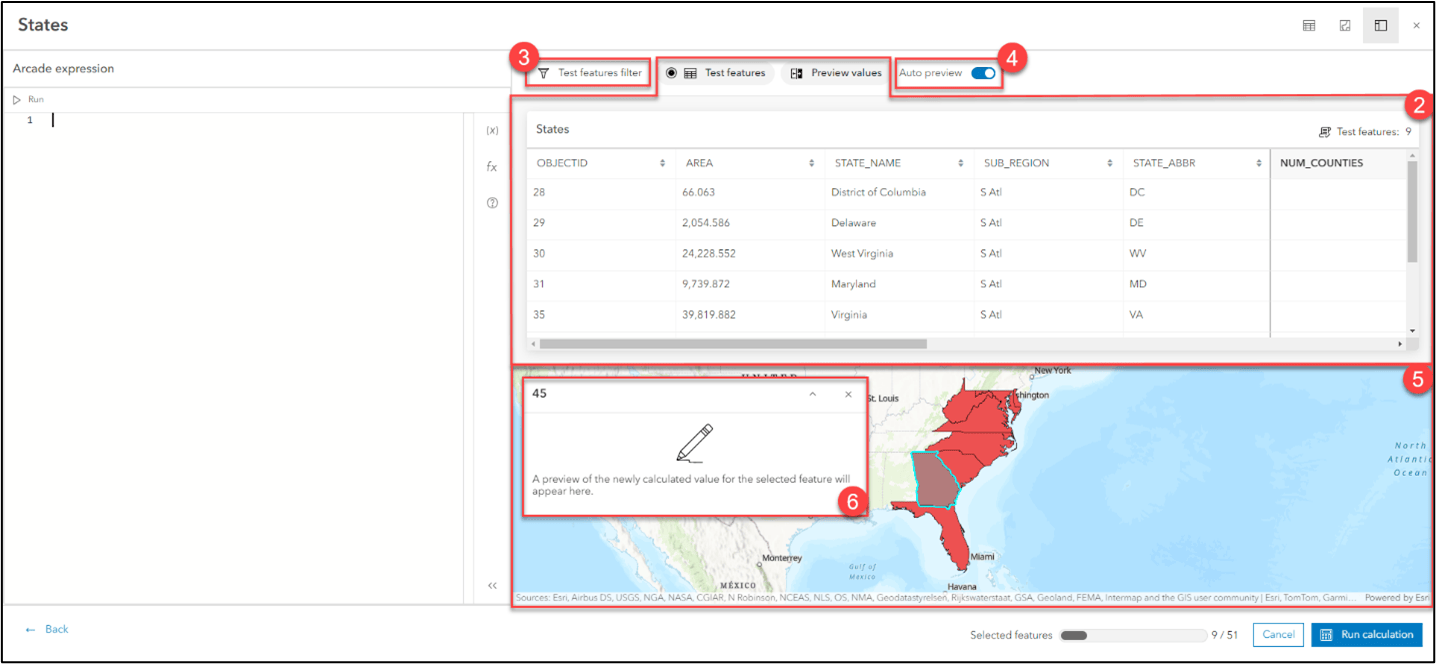
(4) Auto preview toggle
When the auto preview toggle is enabled, both the test feature table (specifically the Calculated column in the Preview values view) and the preview pop-up in the map will automatically update with the anticipated value for your feature(s) as you write your expression.
If your expression leverages functions from the data access bundle, the auto preview toggle will be turned off and disabled for performance reasons. However, you can still check the expected calculation result for individual features in the Preview values view by selecting the ‘Run calculation’ button. Likewise, selecting features in the map view will always display the expected calculated result based on the current expression.
(5) Map view
Allows you to spot check features and their expected calculation result by selecting a feature on the map to view a custom pop-up. If you have set a calculation filter, only features that meet that criteria will be displayed.
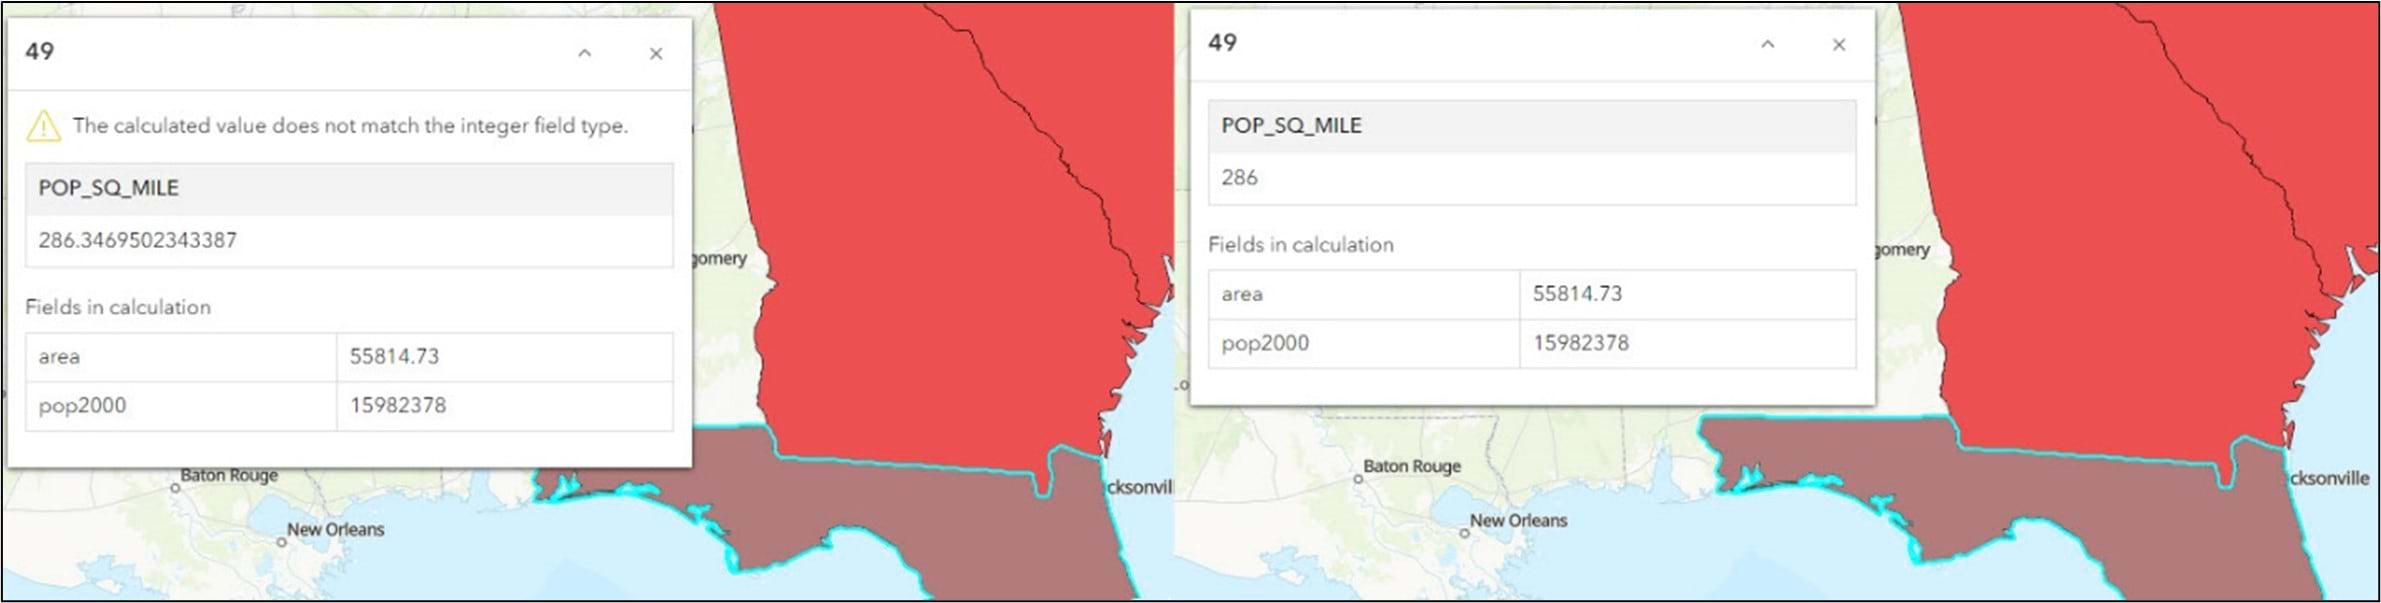
(6) Preview pop-up
The preview pop-up is purely used to preview calculation results for the selected feature. In addition to the expected result, any fields used in the calculation will be included along with their respective values. If there is an issue with the calculation, this will display on the top of the pop-up with an icon and error message.
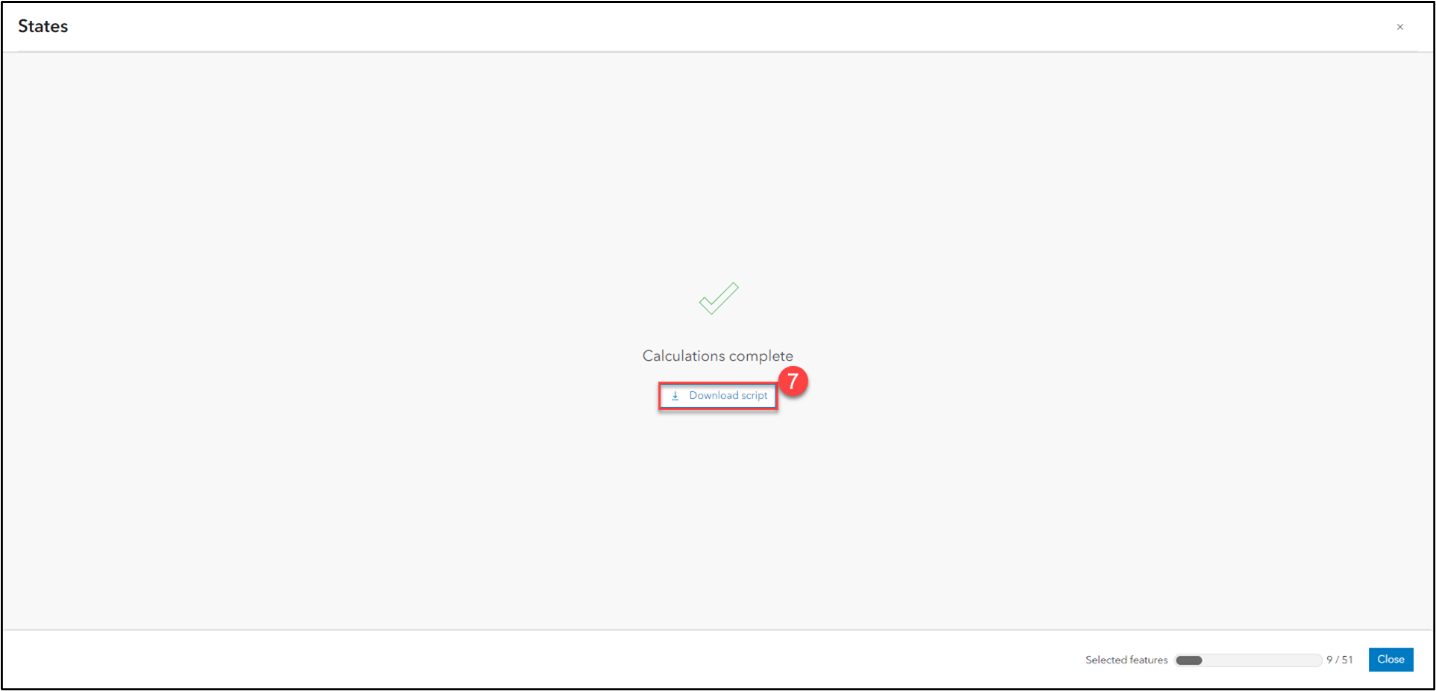
(7) Download script
After running a successful calculation, you’ll be presented with an option to Download script. Clicking this button will download a text file containing your calculation expression to your computer. This helps you easily save your expressions for future reuse.
What’s next?
We are excited about the new field calculation experience, and we hope you are too. In future ArcGIS Online updates, you can look forward to leveraging this experience in the Data tab of the item details page as well as support for SQL. Also, keep an eye out for another field calculation blog where we will dive deeper into the powerful calculation validation functionality.


Article Discussion: