We had the pleasure of meeting with Katie Grillo, a GIS Web Technology Specialist for the City of Cambridge, Massachusetts, to discuss the value that ArcGIS Data Pipelines has added to the city’s data management workflows. ArcGIS Data Pipelines is a data integration tool in ArcGIS Online, offering a fast and efficient way to ingest, prepare, and maintain data. It provides an intuitive drag-and-drop interface that minimizes the need for coding skills, thereby reducing the time required to produce outputs. Additionally, Data Pipelines supports automation through task scheduling functionality, helping organizations to ensure that information in ArcGIS Online remains up to date.
In this blog, we’ll learn from Katie how ArcGIS Data Pipelines has helped the City of Cambridge more efficiently integrate and prepare datasets for use in their ArcGIS Online organization. We believe that the insights from our discussion will be beneficial for other local government organizations who are looking to enhance their data management workflows. Keep reading to learn about the operational benefits and efficiencies gained by using ArcGIS Data Pipelines.
1. How would you explain ArcGIS Data Pipelines to a colleague or friend who also uses ArcGIS Online?
Data Pipelines is a new tool that allows us to pull a variety of data formats from within ArcGIS Online or from third-party sources. After you have connected to a data source, you can manage the fields, update attributes, and then publish or overwrite feature layers in your ArcGIS Online organization. This is a great tool to help automate manual workflows and schedule data updates.
2. What initially sparked your interest in ArcGIS Data Pipelines?
Data Pipelines has helped us solve numerous data management problems we were facing as an organization. It came recommended to me by a friend at Esri who knew some of the struggles we were having with data integration. This tool immediately solved our problem!
3. What types of input data sources are you using in your data pipelines today?
We are primarily working with existing feature layers or pulling data from third party sites, such as our Socrata Open Data Portal. This allows us to convert traditional spreadsheets into interactive mapping solutions while still maintaining a connection to the original data source.
Previously, we would need to upload a static copy of the data to ArcGIS Online and do manual overwrites when necessary. Now, we can connect to the data source in a data pipeline and schedule updates to run based on the needs of the project.
Our GIS Team also manages hundreds of authoritative data layers in our organization. ArcGIS Data Pipelines make it easy to pull in existing feature layers, transform them as necessary, and then overwrite another version of the data.
4. How has implementing ArcGIS Data Pipelines enhanced your [department’s] productivity or operational efficiency?
Data Pipelines has been very useful for us to automate data maintenance and update workflows within our ArcGIS Online organization.
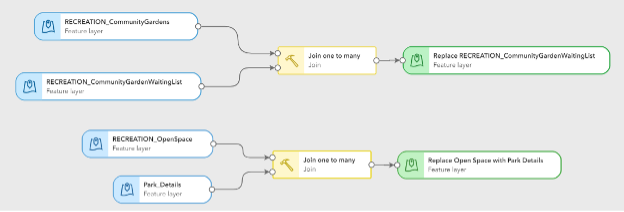
We had been struggling with joining tabular data to some of our authoritative ArcGIS Online feature layers. Before Data Pipelines, we were doing these joins in ArcGIS Pro and then overwriting the web feature layers. Now we can do everything within the ArcGIS Online environment. This seems like such a simple, straightforward workflow, but when you are repeating the process with dozens of layers and joins, it takes a lot of time. Having all these workflows in a single pipeline makes it so much easier and efficient for us to maintain all the individual files in one place.

5. For what types of tasks or projects do you find Data Pipelines to be most valuable?
Data Pipelines has been most valuable for repetitive tasks. A workflow that used to involve numerous clicks and swapping between pages and sources can now be set up once, and then scheduled to run as needed. With so many projects and users to support, any tool that helps save time is extremely valuable.
6. Can you share an example of a specific challenge that Data Pipelines helped you to solve or overcome?
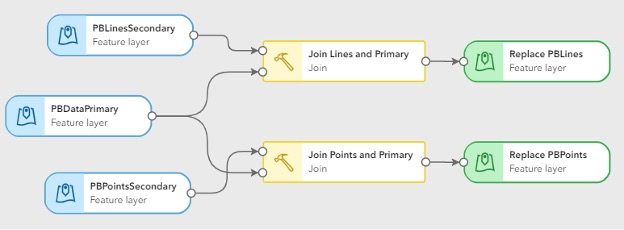
The City of Cambridge has a program called Participatory Budgeting (PB) where the public gets to decide how some city dollars should be spent in their community. The GIS team was tasked with mapping the winning projects across all PB Cycles. This project data includes both points and lines. Some of the projects have one location, while others might have dozens of locations around the city. We store all the project details in a spreadsheet but need to join that to the spatial project’s datasets (point and lines) so they can be visible in a public-facing dashboard. There are a lot of manual steps to ensure everything is synced up properly. Now, we can use Data Pipelines to update the public data layers with just one click or no click at all if we have it running on a schedule!

7. What was the learning curve like when adopting Data Pipelines?
Data Pipelines is relatively simple to work with. The interface is similar to ModelBuilder in the sense that you pull in different components and then adjust settings on each part without a need to write any code. For me, it was helpful to explore and play around as I was getting started.
8. What recommendations would you give to other cities considering the adoption of Data Pipelines?
Try it out! This tool has been beneficial to us even with the simplest workflows. Doing simple workflows, like data joins, is a good way to practice. One thing to be mindful of is the credit usage. Be sure to close windows and click the Disconnect all button on the connection details dialog box when you are done working in the editor.
9. What three words would you use to describe ArcGIS Data Pipelines?
Dynamic, useful, fun!


Katie Grillo is a passionate GIS professional striving to create meaningful impact through mapping, storytelling, and community engagement. She has spent the last decade working as the GIS Web Technology Specialist for the City of Cambridge, MA. Katie helps to educate and empower city staff using ArcGIS tools and solutions. She supports crowdsourcing efforts and various ArcGIS Online applications, specializing in ArcGIS Story Maps, Dashboards, Experience Builder, and 3D Web Scenes.
In addition to her role in the Cambridge IT Department, Katie is also an Instructor at the University of Richmond, VA. She is heavily involved in the GIS Community in the Northeast, joining the Northeast ArcGIS User Group (NEARC) Board of Directors in 2018 and serving as Chair from 2020-2022. In early 2023 she founded the Women in GIS Northeast Chapter with the goal of creating more space for women in GIS to connect and thrive.

Get Started Today
We encourage you to leverage the insights from the blog and utilize the additional resources provided below to start exploring some of the powerful data integration capabilities that are offered by ArcGIS Data Pipelines.


Commenting is not enabled for this article.