ArcGIS Online enables you to connect people, locations, and data using interactive maps. Using ArcGIS Online, you can work with smart, data-driven styles and intuitive analysis tools that deliver location intelligence.
You can use ArcGIS Online as a standalone solution for your mapping and analysis needs. Or, because it’s an integral part of the ArcGIS system, you can use ArcGIS Online to extend the capabilities of ArcGIS Desktop, or ArcGIS Enterprise, or build custom apps using ArcGIS Web APIs and SDKs. ArcGIS Online also provides access to the ArcGIS Living Atlas of the World, a vast collection of curated, authoritative, ready-to-use content from Esri and the global GIS user community.
Don’t have an ArcGIS account? See Create an ArcGIS Account.
March 2020 release
ArcGIS Online is updated regularly, and this latest release adds many useful new features and enhancements. The March 2020 update includes 3D visualization enhancements, a redesigned user profile experience, and other improvements and new functionality.
Other products are released on independent timelines but are part of the online ecosystem. This article summarizes those developments that have occurred since the December 2019 ArcGIS Online release. For additional details see the What’s new help topic, view all posts related to this release, or view specific product blogs.
Featured this release
3D visualization
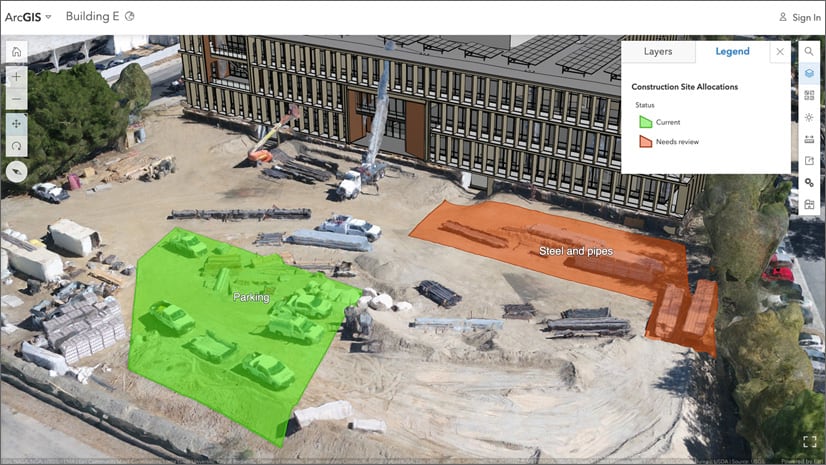
You can drape feature layers onto integrated mesh scene layers for better 3D visualization. This enables you to gather a recent 3D snapshot of an area of interest with Drone2Map for ArcGIS or SiteScan as an integrated mesh scene layer and easily mark locations with points, lines and polygons, as shown in the construction scene below. Set the elevation mode to On the ground for feature layers.
You can now label 3D object scene layers based on an attribute, such as the building name or address.
The Building explorer tool has improved filtering options for building scene layers. Using a new filter you can choose which construction phase to show. For example, you can choose a specific construction phase to display all the components created during the phase and before. The Building explorer tool also has improved visualization when the level picker is used; the bottom levels now appear semitransparent for added visual context.

Profile page
The user profile and settings experience has been redesigned, allowing you to showcase yourself and your content through the refreshed user profile page. A separate user settings page makes it easier to view your licenses, credits, and manage various account settings at once. If you are licensed with ArcGIS Pro, now you can easily download it from licenses of the user settings page. For more information, see Refreshed user profile page.

HTTPS readiness
Some organizations activated before September 2018 still allow ArcGIS Online to communicate using HTTP access to content, such as web layers and images. As of December, 2020, HTTP support will be discontinued and references to HTTP URLs will no longer work in ArcGIS Online.
As part of the March 2020 update, ArcGIS Online notifies users about the upcoming change when references to HTTP content are submitted.

It is recommended that organizations verify their security settings as soon as possible and make the necessary changes to content and workflows before December, 2020. For more information about considerations when making this change, see the Important Updates for the ArcGIS Platform and HTTPS Only Enforcement Support article.

ArcGIS Online Security Advisor
ArcGIS Online Security Advisor provides a full run-down of your organization’s security settings at the click of button, eliminating the need to review settings one-by-one administratively. Security Advisor also delivers recommendations based on your current settings.
Built by the Esri Software Security and Privacy team, you can launch the app from the ArcGIS Trust Center, where you will find other useful information, alerts, and announcements.
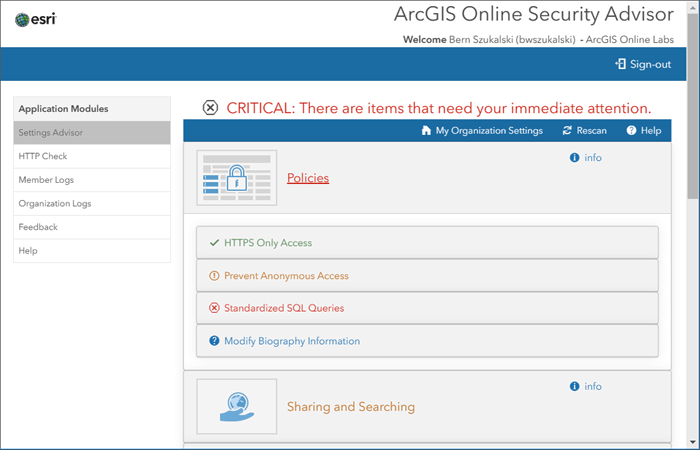
Enhancements in this update include:
- Any member can use the HTTP Check module.
- For web map item types that are identified as having HTTP links, the HTTP Check will provide a link back to ArcGIS Online where users may update the layers to HTTPS.
For more information see ArcGIS Online Security Advisor, or visit Esri Software Security and Privacy on GeoNet.
Other enhancements
Map Viewer Beta
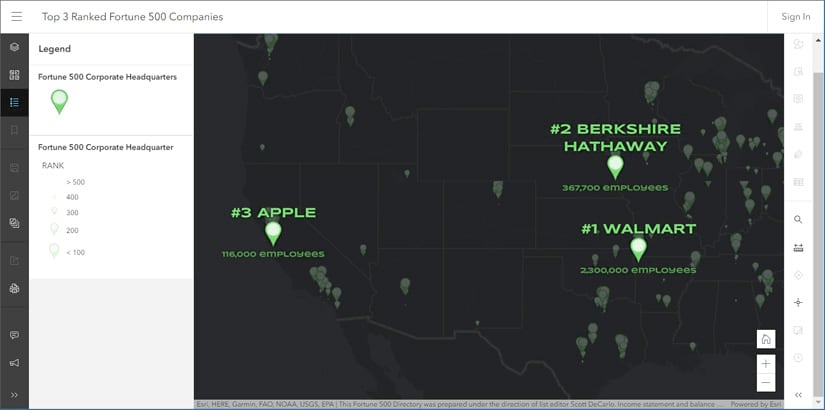
Several enhancements have been added to Map Viewer Beta since the last ArcGIS Online update. Highlights include enhanced label authoring with support for multiline labeling, scale-dependent labels, and rotation. To learn more, see New labels in Map Viewer Beta.

Sharing and collaboration
You can now use filters to help you find specific groups with which to share your content. For example, choose the Special Groups > Shared Update filter to display only shared update groups, or find other types of groups such as administrative or featured item groups. You can also filter by owner or group creation date.
You can also embed videos in item page and group page descriptions. This allows you to provide additional information, context, and instructions about your items or groups.

Configurable apps
Configurable apps are template applications that you can configure easily, without any coding. They help you publish apps quickly for a variety of users and workflows. Configurable apps are the fastest and easiest way to go from a map to a shareable app.
This release introduces a new Minimalist (beta) configurable app. Minimalist (beta) is built using the 4x version of the ArcGIS API for JavaScript. The app offers an updated user interface and support for newer functionality such as multi-component popups and dot density rendering. Also included is a revamped app configuration that provides a more efficient and streamlined configuration experience. For more information, see What’s New in Configurable Apps (March 2020).

Data management
When purchasing an ArcGIS Online organizational subscription, you can now choose the region—United States or Europe—where your geospatial data will be stored. The option to choose a regional data hosting location is available for subscriptions purchased after the March 2020 update of ArcGIS Online.
For organizations activated before this date, all geospatial content and user information is stored in the United States. The regional data hosting location is displayed for new and existing organizations on the Overview tab of the organization page. See What is regional data hosting to learn more.
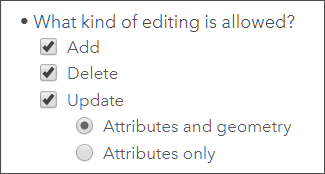
Streamlined Edit settings on hosted feature layers and hosted feature layer views allow you to control the types of edits others can make to your layer, including allowing or disallowing edits to feature geometries.
The size limit for files uploaded to ArcGIS Online has increased from 200 to 500 gigabytes.
You can replace the contents of a scene layer you published from a scene layer package. This allows you to maintain the existing scene layer’s item ID and URL, which means the scenes and apps that contain the scene layer will have access to the updated content without you republishing the layer.
A new feature layer template is available for collecting tabular data, such as sales data.

Accounts and administration
In addition to Facebook and Google, a new social login option is available in ArcGIS Online. Developers and other GitHub users can sign in or sign up using their GitHub account credentials. See Sign in with a social login for more information.
When you set the language for your organization, you can now specify a number and date format for three additional languages—French, German, and Italian. Individual organization members and those with public accounts can also change the number and date format through their profile page. For example, if the language is set to French, you can display dates and numbers using the formats defined in the Common Locale Data Repository (CLDR) for France and Switzerland.

ArcGIS Notebooks (beta)
ArcGIS Online organizations can create notebooks using the new beta version of ArcGIS Notebooks. ArcGIS Notebooks integrate Jupyter, the popular open source Python notebook format, directly within ArcGIS Online. Notebooks are an efficient, modern environment that combines code, on-the-fly visualizations, analysis tools, and maps. They are also very useful for automating administrative tasks, such as managing users and content.
ArcGIS Notebooks has been optimized to allow the easy addition of data and analysis tools as code snippets. In addition to the standard analysis tools of ArcGIS Online, Notebooks deliver options to work with the ArcGIS Python libraries, and open source Python libraries.
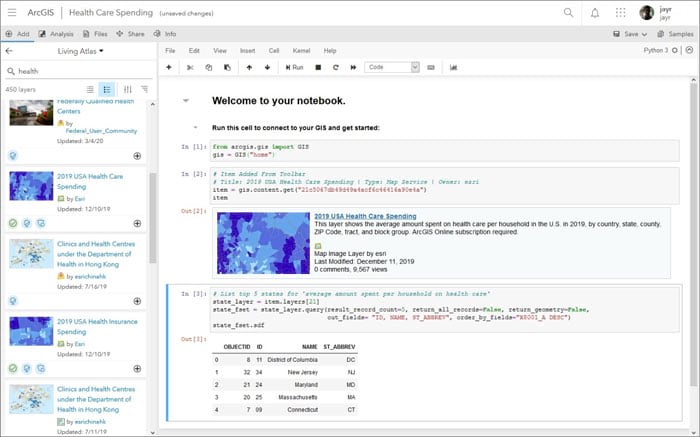
Notebooks are now available in ArcGIS Online via a public beta. During the beta, normal credit rates apply for running analysis, accessing premium content, and storage.
Administrators will see Notebooks as an option in the top navigation pane and can begin using them immediately. Organizational members will require additional privileges before they will be able to start working with ArcGIS Notebooks.
For more information about ArcGIS Notebooks Beta, see ArcGIS Notebooks Beta – Online on GeoNet or ArcGIS Notebooks public beta is here.

ArcGIS Companion
ArcGIS Companion makes it easy to use ArcGIS from your mobile device to explore content, view groups, edit your profile, and more.
The latest release includes support for the new Storyteller user type and support for Enterprise 10.8. For more information, see ArcGIS Companion on GeoNet or What’s new in ArcGIS Companion 3.1.
ArcGIS Living Atlas
ArcGIS Living Atlas of the World is the foremost collection of geographic information from around the globe. It includes curated maps, apps, and data layers from Esri and the global GIS user community that support your work. Visit the ArcGIS Living Atlas of the World website where you can browse content, view the blog, and learn how you can contribute. Here’s what’s new, been recently released, or is coming soon.

COVID-19 has focused the world’s attention and one of the authoritative sources to monitor its progression is with the Coronavirus COVID-19 Dashboard by Johns Hopkins University. Using Living Atlas of the World live feeds methodology, and built using ArcGIS Dashboards, it delivers the latest information from around the globe.

National Urban Change Indicator
The National Urban Change Indicator (NUCI), developed in collaboration with Maxar Technologies, provides a 30-year history of persistent land cover changes for the conterminous United States. For more information, see 30 Years of Human-Related Change.

New OpenStreetMap (OSM) layers
New OpenStreetMap layers are now hosted in ArcGIS Online and available in the Living Atlas. These feature layers allow you to access the latest OpenStreetMap data (e.g. buildings, highways, and amenities), created and edited by OpenStreetMap contributors, for visualization and analysis. The initial set of layers (now in beta release) are available for North America, with additional layers and regions to be added soon.

Demographics
The American Community Survey (ACS) is an ongoing survey by the U.S. Census Bureau. It compiles information such as ancestry, citizenship, educational attainment, income, language proficiency, migration, disability, employment, and housing characteristics.
Last December 78 Living Atlas layers containing American Community Survey (ACS) data were updated within 48 hours of Census releasing the 2014-2018 values. These layers are grouped by topic, such as health insurance, internet access, and living arrangements, and can be found in the American Community Survey (ACS) group.
Additional highlight layers have been added including:
- ACS Population and Housing Basics (centroids and boundaries)
- ACS Context for Child Well-Being (centroids and boundaries)
- ACS Context for Senior Well-Being (centroids and boundaries)
- ACS Context for Emergency Response (centroids and boundaries)
For more information, see Industry-specific ACS layer now in ArcGIS Online.

Basemaps
Esri vector basemaps continue to be updated regularly with data from commercial, open, and community sources. Ukrainian and Dutch are added, bringing the total to 20 localized language basemaps.
Places such as restaurants, stores, businesses, and other points of interest, are now included in Esri vector basemaps. These include several million places in the United States using SafeGraph Places as the source.
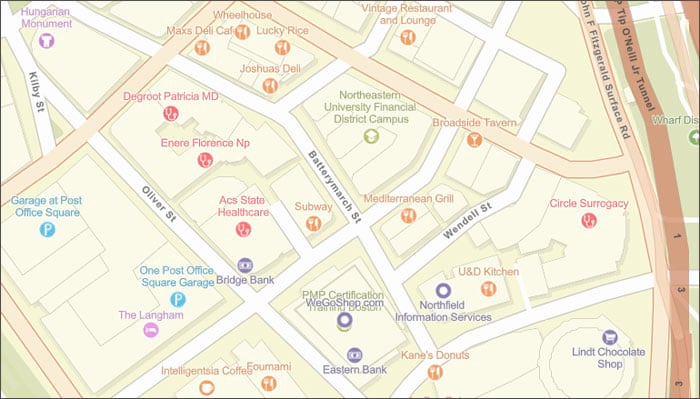
The Places layer will be available in many of the styles available for the Esri Vector Basemaps and has first been added to beta styles of Streets and Imagery Hybrid maps. For more information, see New places in Esri vector basemaps.
OpenStreetMap (OSM) vector basemaps continue to be updated regularly and are available in a variety of styles. A new OSM light gray canvas style is also now available, and is designed to match Esri’s Light Gray Canvas using thinned content from the full OSM data.

The World Imagery basemap has been updated with imagery from Maxar, including 1-meter Vivid imagery across 30 countries, 50-centimeter Vivid imagery across Alaska, and 30-centimeter Metro imagery for more than 450 cities around the world.
The USA NAIP imagery service will be updated with NAIP 2018 60 centimeter imagery, with updates expected to be completed in early April. These updates are also included in the following layers:

Environment
Earthquake live feed layers have been improved and are now available publicly, no subscription is required for access. The updated content offers faster performance, a simplified layer structure, and is time-enabled. For more information, see Live earthquake mapping for everyone.
The Map of Biodiversity Importance (MoBI) data collection is a series of layers from NatureServe that identify areas of high importance for protecting species from extinction in the contiguous United States.
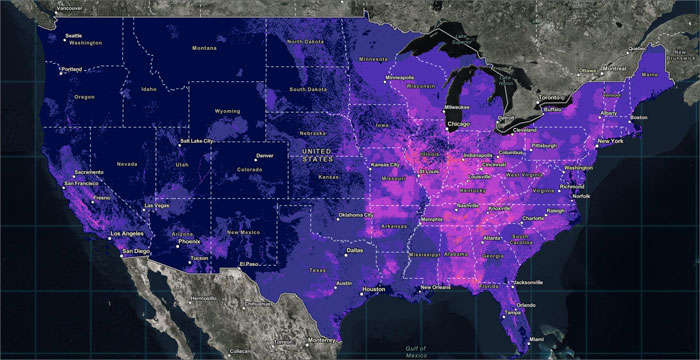
The layers use outputs from habitat suitability models for 2,216 of the most imperiled species in the lower 48 United States, and combine those outputs with information on range size and degree of protection to create a series of layers to inform conservation efforts. View the layers at the Living Atlas website. For more information, see Map of Biodiversity Importance now available.
Risk of Tree Mortality Due to Insects and Disease is now available. The layer identifies lands in three classes: areas with risk of tree mortality from insects and disease between 2013 and 2027, areas with lower tree mortality risk, and areas that were formerly at risk but are no longer at risk due to disturbance (human or natural) between 2012 and 2018.
The Global Solar Atlas provides relevant information of solar power potential for energy generation. The goal of the atlas is to publish solar resource and photovoltaic power potential data. Newly published layers include the following:
- Global Solar Atlas
- Direct and Diffuse Irradiations
- Horizontal and Tilted Irradiations
- PV Electricity Output
USA Soils layers and maps have been updated using October 2019 data from USDA NRCS. The updates include 26 items and the SSURGO downloader app.
USA Wetlands layers have been updated using October, 2019, data from the USFWS.
The Global Water Model has been updated for islands, North America, and Western Asia.
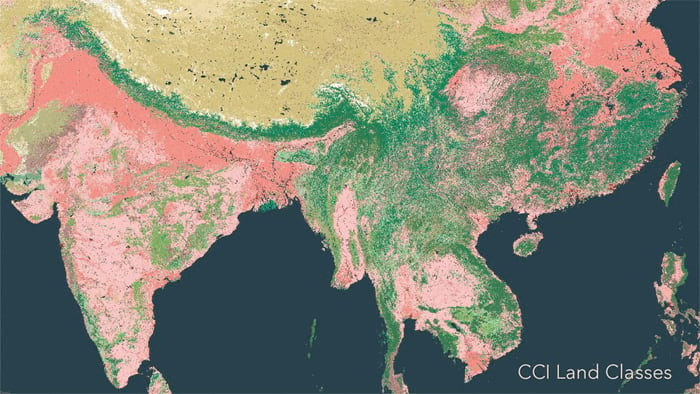
European Space Agency (ESA) Climate Change Initiative (CCI) Land Cover Time Series
This layer is a time series of the annual ESA CCI land cover maps of the world classified into 36 land cover classes. These classes include agriculture, forests, grasslands, urban, and other categories. ESA has produced land cover maps for the years since 1992 and the layer will display as a time series animation, one year per frame. For more information, see Three decades of global land cover change. For more information, see the item description.
World Terrestrial Ecosystems
This map is the first-of-its-kind effort to characterize and map global terrestrial ecosystems at a much finer spatial resolution (250 m) than existing ecoregionalizations, and a much finer thematic resolution than existing global land cover products. The layer uses land cover as input to generate 431 unique terrestrial ecosystems on Earth. See the item description for more details.

Coming soon in April
MODIS
A new version of the MODIS thermal hotspots and fire activity feed will be released using the newer VIIRS sensor with enhanced spatial detail, essential for public safety applications. The feature layer will also include improved temporal capabilities to enhance mapping the spread of an event over time, and will be updated every 15 minutes.
USA Wildfire Activity
This is a hosted feature layer that merges IRWIN and NIFC point and polygon data and will replace the USA Wildfire Activity map layer.

Other additions and improvements
Since December, more than 300 new items have been added to ArcGIS Living Atlas on a wide variety of topics such as COVID-19, plus maps and layers for Netherlands and New Zealand, and feature layers from OpenStreetMap, NatureServe, Esri-Canada, Esri-Indonesia and others. ArcGIS Pro packages and dashboards are among the new content.

Community maps
The Community Maps Editor application has reached a new milestone reaching 120,000 features created in the app to add detail and context to the Esri Vector Basemaps.
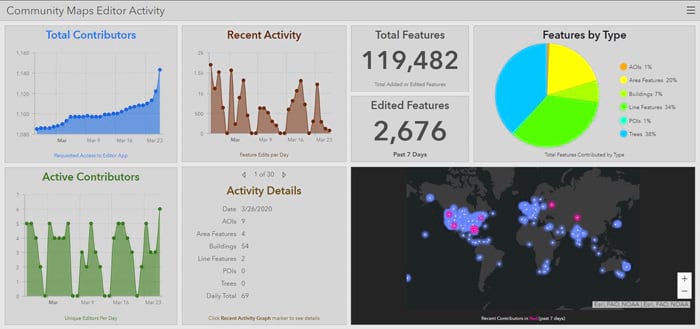
Learn more and contribute today by visiting the Community Maps Program website.

ArcGIS Learn lesson and path
Learn how to jumpstart your GIS workflows with ready-to-use content from Living Atlas. Get started with ArcGIS Living Atlas of The World is a new three-part Learn lesson that will teach you how to browse, find, and use spatial content from the Living Atlas website, ArcGIS Online, and ArcGIS Pro.
Make Powerful Maps Using ArcGIS Living Atlas of the World is a learning path offering hands-on exercises that use Living Atlas maps, apps, and layers to support your work and jump start your GIS workflows.

For more information about ArcGIS Living Atlas, see the following:
ArcGIS StoryMaps
ArcGIS StoryMaps make it easy to create inspiring, immersive stories by combining text, interactive maps, and other multimedia content. Publish and share your story with your organization, or with everyone around the world.
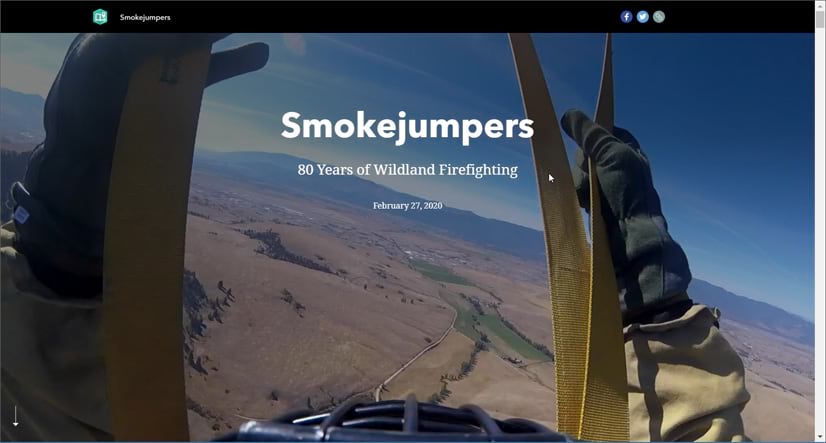
StoryMaps continues to evolve with improvements to enhance your experience when telling stories with maps. The following new features and capabilities have been recently added.
Map actions enable you to enrich your stories with optional map interactions. Map actions are configurable toggle buttons that you can add to any sidecar slide that contains a web map or web scene. When readers click a map action the appearance of the map changes. For more information, see Supercharge your stories with map actions (beta).
Guided Tour is new immersive block that enables you to easily create a guided tour to walk readers through interesting places. You can choose a media-focused or map-focused layout for your tour. Guided tour places can each have multiple images and/or videos. For more information, see Now available in ArcGIS StoryMaps: Guided tour.
Sidecar adds a floating panel layout can be used to create engaging experiences with narrative panels that scroll over full-page immersive media and maps.
A navigation bar can be added to stories to help readers jump to specific sections of a story, and the credits block is a new space at the end of a story for citations, references, and source links.
Stories can now be shared to groups from within the story builder or from the story item page in ArcGIS. Other new features include the ability to hide a slide from the published view of a story, express map annotation styling tools, two new themes, and an update to collections.
For more information about these and other improvements, see What’s new in StoryMaps (January 2020) or visit ArcGIS StoryMaps. Stay tuned for another release next week. For more information see What’s new in StoryMaps (April 2020). Note that the blog article is coming soon and will be posted after the release.
ArcGIS Hub
ArcGIS Hub enables organizations to collaborate with internal and external stakeholders to share informative and engaging content with their communities.
ArcGIS Hub is available at two license levels: Basic and Premium. ArcGIS Hub Basic is included with ArcGIS Online and delivers data sharing and site creation capabilities, while ArcGIS Hub Premium includes additional features and capabilities for working with teams of people, including members of the community.
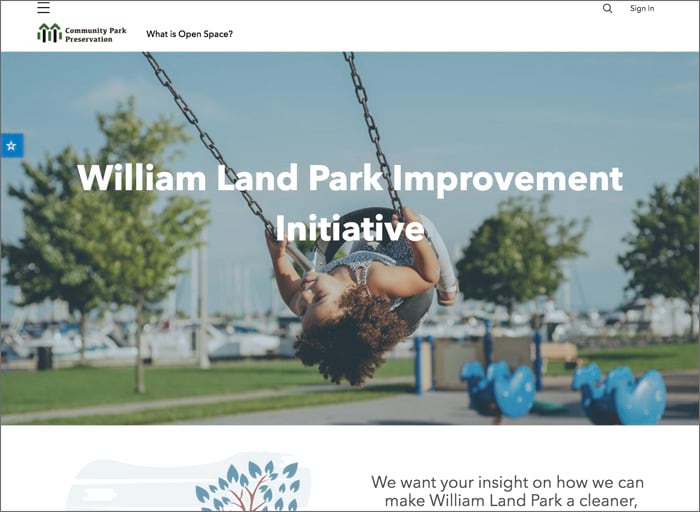
Since the start of the year, the following new features have been released:
- You can now create and add items within ArcGIS Hub to more quickly power your sites and pages with content.
- Integrated support for Survey123 is now available, meaning that you can create surveys and forms for sharing with your teams or the public. The feedback you generate can be managed within hub and shared as metrics and charts on your sites and pages.
- ArcGIS Hub premium customers can now create and manage supporting teams as part of their initiatives, so that they can share content with select groups.
- You can also now automate several key workflows using the recently released Hub Python API. For more information, see Introducing ArcGIS Hub Python API for Sites.
To get started with ArcGIS Hub, try these new learn lessons and sign up for an upcoming webinar. If you’re interested in using the freely accessible Coronavirus Response template, see How to Launch a Coronavirus Response Website Today.
ArcGIS Analytics for IoT
ArcGIS Analytics for IoT brings real-time and big data capabilities to ArcGIS Online, enabling you to access, analyze, and take action on any kind of observation data.
High-velocity event data can be filtered, processed, and sent to multiple destinations, allowing you to connect virtually any type of streaming data and automatically alert personnel when specified conditions occur. You can also design analytic models to process high-volume historical data and gain insights into patterns, trends, and anomalies.
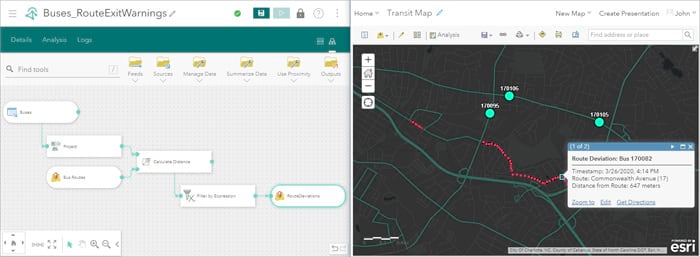
Analytics for IoT uses distributed cloud processing to scale tasks, enabling you to ingest, analyze, and visualize massive velocities and volumes of data. Results be stored as hosted feature layers, written to your own cloud data stores, or disseminated via notifications and messaging systems.
Using Analytics for IoT, you can create:
- Feeds that ingest real-time data from IoT cloud providers and web & messaging systems and can be added to your web maps for immediate situational awareness.
- Real-time analytics that process streaming data as it is received and transform, enrich, and ask questions of incoming information to detect incidents.
- Big data analytics that perform summarization, pattern, and trend analysis on massive volumes of collected data to generate insight.
- Feature and map image layers that support dynamic aggregation so that high volume data can be easily visualized and explored in your favorite ArcGIS apps.
Analytics for IoT was released in February and is licensed as an additional subscription to ArcGIS Online. For additional details, see the product overview, help documentation, or the Analytics for IoT blogs.
ArcGIS Dashboards
ArcGIS Dashboards enables users to convey information by presenting location-based analytics using intuitive and interactive data visualizations on a single screen. Every organization using the ArcGIS platform can take advantage of ArcGIS Dashboards to help make decisions, visualize trends, monitor status in real time, and inform their communities.
Starting with this release, the product has been renamed to ArcGIS Dashboards from the previous Operations Dashboard for ArcGIS. For more information, see Introducing ArcGIS Dashboards.
Best practices for authoring and sharing dashboards that will receive a lot of traffic and viewership are now available. Building highly scalable dashboards ensures that the traffic generated by a dashboard scales effectively in high-demand situations.
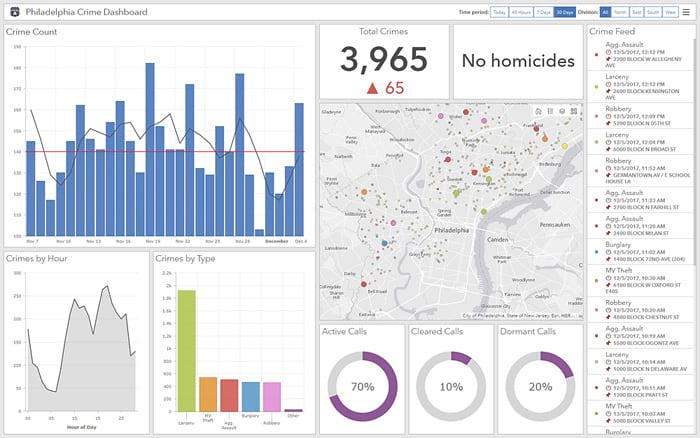
A public beta program for the next version of ArcGIS Dashboards is now live and available for you to try. The beta gives users an opportunity to work with the re-architected product, built on top of the JavaScript API 4.x, which enables several enhancements including improved usability and performance, and support for Arcade in List and Indicator elements. Join us this ArcGIS Dashboards Beta GeoNet space to explore various resources, participate discussions, and provide feedback.
For more information on the beta, see Introducing the ArcGIS Dashboards beta and ArcGIS Dashboards Beta Now Available.
App builders
App builders let you easily create custom apps, no coding required, and you don’t have to be a designer, or even a map expert. App builders have been updated with the following enhancements.

ArcGIS Experience Builder
ArcGIS Experience Builder empowers you to quickly transform your data into compelling web experiences for a variety of audiences, across browsers and all devices, with no coding required. Experience Builder provides complete control over the layout and design elements, supporting both mapcentric and nonmapcentric apps via fixed or scrolling screen, on single or multiple pages. Provided templates and widgets help you get started quickly, and can be extended with your own.
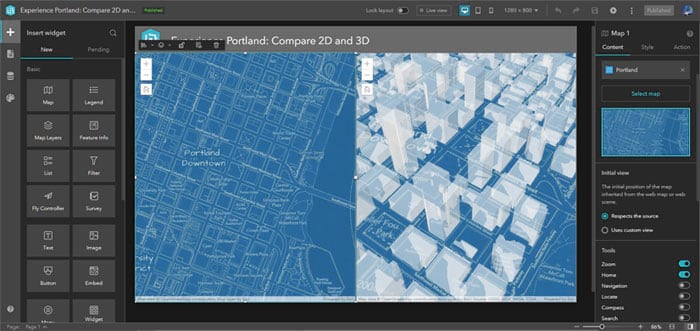
Launch ArcGIS Experience Builder from the app launcher or sign in at the Experience Builder landing page. You can also access Experience Builder from the Create menu on the content page as another way to create apps. For more information, see the Experience Builder blog articles or visit the Experience Builder GeoNet Community.

AppStudio for ArcGIS
AppStudio for ArcGIS lets you turn your maps into beautiful, consumer-friendly mobile apps ready for Android, iOS, Windows, macOS, and Linux. Share your apps with members of your organization using AppStudio Player, or publish them to all popular app stores. With AppStudio, organizations on the ArcGIS platform can now build cross-platform native apps easily.
In the latest release, the ArcGIS Runtime version has been updated to 100.7. AppStudio Player has been improved to make it easier to share apps with members of your organization. A Developer Mode switch has been added to the App Settings page of Player to enable the use of debugging and app development tools. Map Viewer now includes support for offline map areas and Quick Report supports feature layers with restricted editing. New samples are included for finding features in a utility network, creating, editing, and saving KML, and printing your location.
Download AppStudio or to learn more, see Whats new in AppStudio and the AppStudio GeoNet Place.

Web AppBuilder
Web AppBuilder for ArcGIS delivers a way for you to easily create web apps that run on any device, using a gallery of ready-to-use-widgets. You can customize the look of your apps with configurable themes and can host your apps online or on your own server.
Multiple widgets have been improved in Web AppBuilder for ArcGIS. The Data Aggregation widget is out of beta and has added support for multiple target layers and the capability to customize the home screen message. With the Public Notification widget, you can allow users to add and remove selected parcels on a specific addressee layer. The Parcel Drafter widget now supports international foot as a measurement unit. When configuring attribute actions for the Smart Editor widget, you can choose to populate a field based on MGRS coordinates.
For more information, see What’s new in Web AppBuilder for ArcGIS.
Apps for field operations
ArcGIS apps for field operations help you use the power of location to improve coordination and achieve operational efficiencies in field workforce activities.

Explorer for ArcGIS
Take your maps with you everywhere you go with Explorer for ArcGIS, a mobile app for iOS and Android, and now available on Windows 10. Take your GIS with you in the field, work offline, and add shareable notes and markup.
The most recent releases of Explorer brings new offline capabilities and an improved experience across all supported platforms. These improvements include the ability to work with web maps offline, view tracks, and the ability to improve situational awareness with scheduled updates.
For more information, see What’s new in Explorer for ArcGIS (March 2020).

Survey123 for ArcGIS
Survey123 for ArcGIS is a simple and intuitive form-centric data gathering solution that makes creating, sharing, and analyzing surveys possible in just three easy steps.
In version 3.8 a broad range of improvements were made to the Survey123 website. In particular, feature reports now include a preview mode to allow for testing a report template without consuming credits. You can also print reports to PDF. There were no changes to the field app or Survey123 Connect at this time, 3.7 is still the current version for these. Download Survey123 or to learn more, see Whats new in Survey123 and the Survey123 GeoNet Place.

ArcGIS QuickCapture
ArcGIS QuickCapture is the fastest way to collect field observations. With this app, you can quickly record field observations from vehicles, conduct aerial surveys, or assess damage. Data can be sent back to the office for analysis in real time, eliminating time spent manually processing handwritten notes. ArcGIS QuickCapture is integrated with ArcGIS, so new data from the field can be used instantly for better decision-making.
In version 1.4 the mobile app has been updated across all supported platforms and the web designer has been refreshed. The new release helps you easily configure online and offline maps in your QuickCapture projects. The mobile app now supports a side by side display of the map and data capture buttons.
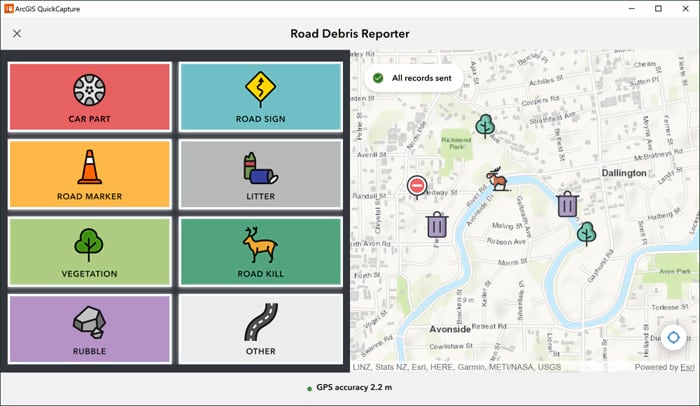
Records are now sent in batches instead of individually, making sending faster. A new Save as option will let you create copies of your projects in case you want to replicate work, test changes in your project without affecting your production project. or create a backup.
Download QuickCapture or to learn more, see Whats new in QuickCapture, view the What’s new in Quick Capture (March 2020) blog article, and visit QuickCapture on GeoNet.

Collector for ArcGIS
Collector for ArcGIS is a mobile data collection app that makes it easy to capture accurate data and return it to the office. Fieldworkers use web maps on mobile devices to capture and edit data. Collector for ArcGIS works even when disconnected from the Internet, and integrates seamlessly into ArcGIS.
Collector for ArcGIS on the Android platform was recently updated after a yearlong beta program with over 15,000 participants.
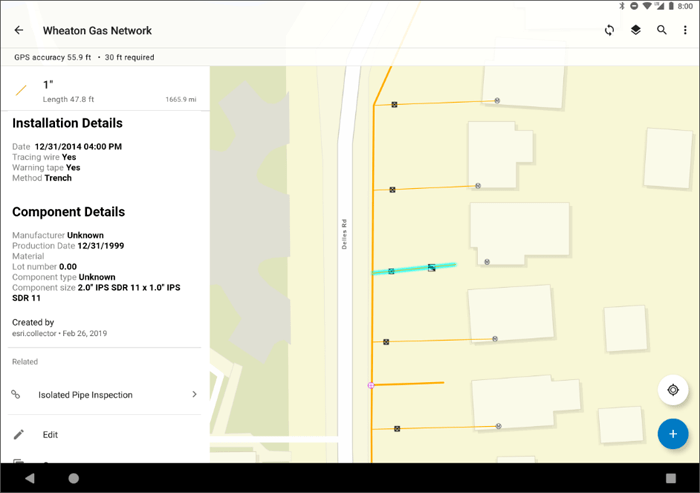
Key features of the release include:
- New mapping capabilities including support for vector basemaps, labeling, and Arcade expressions.
- New offline and sync capabilities, including pre-planned offline areas, support for multiple offline map areas, and more.
- Enhanced user experience to streamline the collection process.
- Miscellaneous enhancements such as compass navigation, universal app links, barcode scanning, MDM configuration settings, and more.
The new version of Collector will run side-by-side with the Classic version of Collector so you can migrate customer workflows without any disruption. For more detailed information on the Android release, see What’s new in Collector for ArcGIS (March 2020).
Collector for ArcGIS on the iOS platform was updated in January. The updates includes the following features:
- Snapping to existing features
- Update form entries for multiple features simultaneously
- Reuse field entries between forms
- Scan a code to sign in
- View local tracks created using Tracker for ArcGIS
For more information, see What’s new in Collector for ArcGIS (January 2020).

Tracker for ArcGIS
Tracker for ArcGIS is a mobile solution that enables organization to capture tracks of field staff, monitor where they are, and analyze where they have been. Tracker includes a mobile app for iOS and Android devices that efficiently runs in the background to capture location tracks. It also includes a Track Viewer web app that administrators can use to view tracks.
Tracker recently updated on both the iOS and Android platforms. A companion watchOS app is now available to pair with iOS devices. Now you can start and stop tracking directly from your Apple Watch. Tracker also now auto-generates a unique ID for each tracking session. This makes it easier to analyze multiple tracks made by one mobile user.
For more information, see What’s new in Tracker for ArcGIS (March 2020) or the What’s new help topic.

Workforce for ArcGIS
Workforce for ArcGIS uses the power of location to coordinate your field workforce. With the mobile app, field workers can carry their maps with them to find and complete assignments. The Workforce web app allows Dispatchers in the office to streamline the managing and assigning of field work.
The next release of Workforce will support offline workflows, meaning your mobile workers can complete assignments in the field whether or not they have an internet connection. This capability is available in the recent Workforce beta release. To test out the next generation of Workforce, join the Workforce for ArcGIS open beta program.
Apps for the office
ArcGIS Apps for the office enable operations managers and analysts to visualize data in a geographic context to gain location-based insights and make decisions that save money and time.
ArcGIS Maps for Power BI
ArcGIS Maps for Power BI helps you unlock the power of location in your business intelligence, from inside Microsoft Power BI. Spatially enable business data, create maps to surface patterns and trends, gain context with organizational content and reference layers, and produce impactful reports.
The March 2020 update provides full support for ArcGIS Enterprise 10.7.1 and higher. You can now add multiple reference layers to your map and organize your map layers using the new Layers list.
For more information, see What’s new in ArcGIS Maps for Power BI or ArcGIS Maps for Microsoft Power BI – March 2020.1 release.
More information
For more information and additional details, see the What’s new help topic or view all posts related to this release.

Commenting is not enabled for this article.