ArcGIS Online helps you understand the world around you by using interactive maps to connect people, locations, and data. You get smart, data-driven styles and intuitive analysis tools that deliver location intelligence. ArcGIS Online gives you the ability to make maps and apps to share your insights with your organization or the world. You can use it as a complete, cloud-based solution or to extend and complement the capabilities of ArcGIS Pro and ArcGIS Enterprise.
Don’t have an ArcGIS account? See Create an ArcGIS Account.
The June 2024 update includes a new recycle bin for deleted items, updated user types, and the launch of ArcGIS Web Editor, along with other enhancements and new functionality throughout ArcGIS Online. Highlights are provided below.
ArcGIS Online is updated three times each year. See the ArcGIS blogs to learn more about previous updates to ArcGIS Online and new functionality and enhancements you may have overlooked.
For more information and additional details about this release, see the What’s new help topic or view all posts related to this release.
Don’t have time to read the blog article? View the video below instead.

Quick links
Use the links below to jump to sections of interest.
- Recycle bin
- Map Viewer
- Analysis in Map Viewer
- Scene Viewer
- ArcGIS Web Editor
- ArcGIS Notebooks
- Content management
- Accounts and administration
Apps and App Builders

Recycle bin
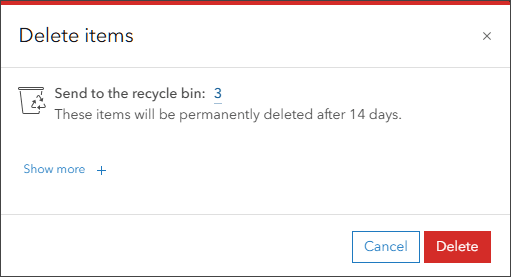
A new setting for organizations allows administrators to control whether supported deleted items are held in a recycle bin for 14 days (336 hours) before being permanently deleted from the organization. The recycle bin gives item owners and administrators a window of time to access and restore items that may have been deleted in error.
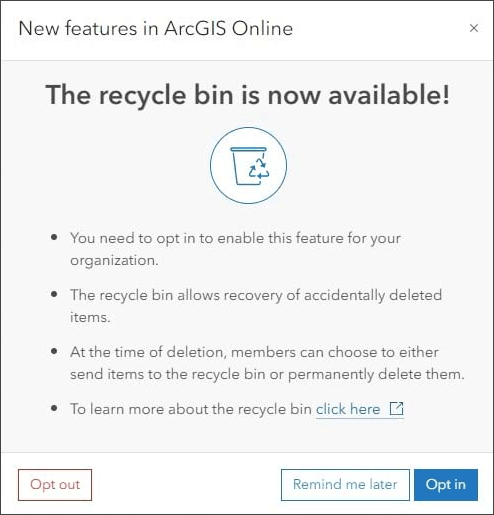
For new organizations, the recycle bin is enabled by default, but administrators can opt out at any time. Existing organizations are prompted to opt in or opt out of the recycle bin at their convenience.
In addition, administrators can use the enhanced item report to keep track of which items are in the recycle bin.
For more information, see the Recycle bin: What you need to know.

Map Viewer
Using Map Viewer, you can author, explore, edit, and share web maps. Administrators and members are encouraged to configure Map Viewer as their primary map viewer to take advantage of new capabilities and enhancements that are delivered with each update.
Here’s an overview of new features and enhancements to Map Viewer delivered in this update.
Labeling enhancements
When customizing labels, you can now adjust the position for labels along lines such as streams, roads, or trails, as shown in the image below.
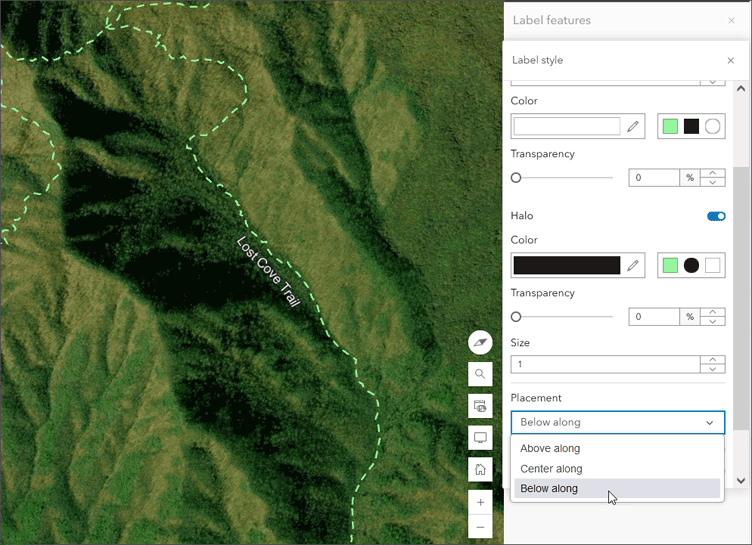
Labels can be placed on the line, or positioned above or below it. You can also set the label background transparency and the background outline color and size.
Field management
When working with a hosted feature layer or table in Map Viewer, you can now add and delete fields using the Fields pane.
For more information, see the Adding & Deleting Fields in Map Viewer.
You can also calculate field values in Map Viewer from the attribute table of a hosted feature layer or hosted table layer. Arcade can be used to create the calculate expression, and filters can be used to apply the calculations to specific subset of features.
For more information, see the Introducing Calculate Field in Map Viewer.
Attribute table enhancements
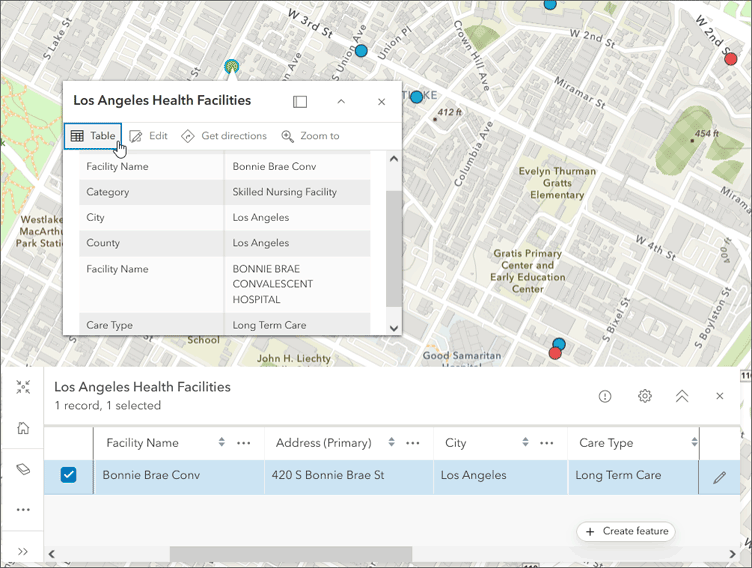
You can now create and edit features directly from the attribute table of a feature layer in Map Viewer. When working with table layers, you can also create and edit records directly from the table.
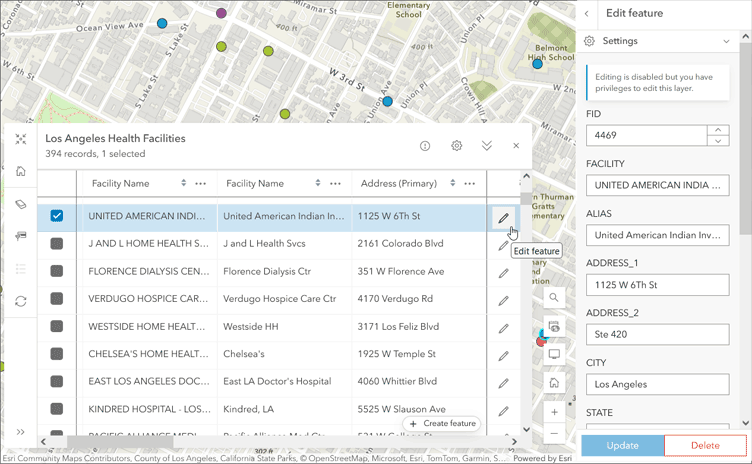
If your feature layer has related records, you can also view the related records in the layer’s attribute table. The table also includes handy breadcrumbs to help you navigate more easily between features and related records.
In addition, a new table button on feature layer pop-ups allows you to display a filtered attribute table view of the selected feature.
Reference size theme
Map Viewer includes a variety of themes you can apply to reveal patterns in the data. Just as a camera may come with different lenses, each for a specific job, themes allow you to experiment with various views of the data.
The new Reference size theme allows you to visualize values in relation to one another using a bounding outline for reference when styling a layer with counts and amounts. You define the reference size shape—circles, squares, diamonds, hexagons (pointy), or hexagons (flat)—and the size range for the inner shape (variable) and outer shape (fixed at the absolute data maximum). You also define the threshold of what is considered high and low within the data range to show values in relation to one another without symbols overlapping.
The following map is an example of the Reference size theme applied to point data that has been aggregated into bins:
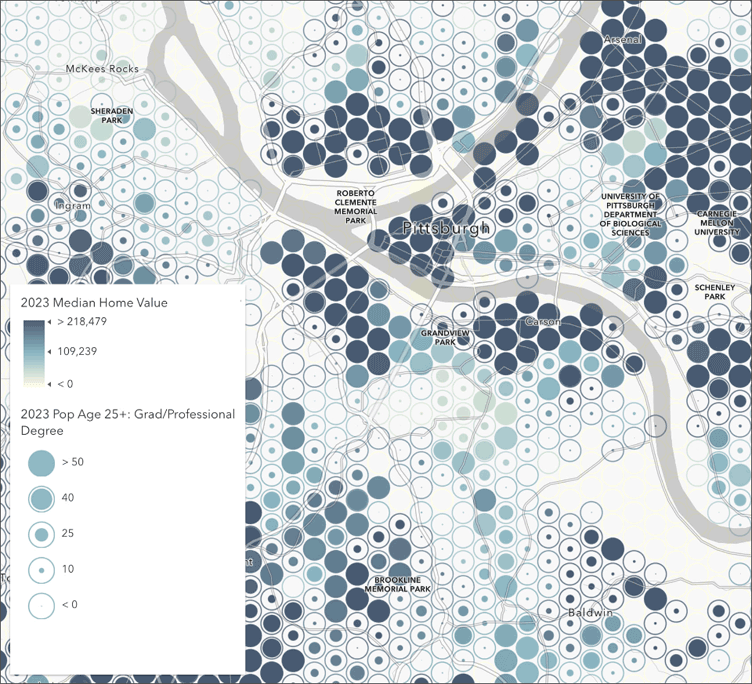
For more information, see Map Viewer Adds Reference Size Maps.
Arcade support for aggregation
Use aggregation when you have a large number of point features and want to symbolize them together. Clustering uses proportionally sized symbols that change dynamically with the map scale. Binning uses defined cells, representing point data as a gridded polygon layer. Both methods allow you to see patterns in the data that are difficult to visualize when a layer contains large numbers of points that overlap and cover each other.
In this update, you can now author a custom Arcade expression when adding a field to determine how the layer’s data is clustered or binned.
Imagery display
When displaying an imagery layer in Map Viewer, you can now update the resampling type.
Map Viewer also includes improved support for multidimensional imagery layers. You can now configure multidimensional imagery layers with multiple non-time dimensions. In addition, a new dimension slider can be used to animate all slices along each non-time dimension at once.
Time field filters
You can now create and apply filters to time fields, including the Date (date and time), Time Only, and Timestamp Offset fields.
Other enhancements
Other enhancements to Map Viewer in this release include the following:
- Box plots in a series now support mean lines when the series uses a Split by field.
- You can now view and work with catalog layers in Map Viewer. Catalog layers are created in ArcGIS Pro and are designed for browsing and exploring a collection of data. To learn more, see Catalog layers in ArcGIS Online.
- The printing experience in Map Viewer has been enhanced with a new tab view. This update also includes the ability (currently in beta) to print from layout templates published from ArcGIS Pro.

Analysis in Map Viewer
Map Viewer’s spatial analysis tools allow you to quantify patterns and understand relationships in your data. Feature analysis and raster analysis tools and raster functions are available to all members with the appropriate privileges.
With the user type update, please note the following:
- Members having Creator, Professional, or Professional Plus user types can publish hosted imagery layers.
- Existing members who have Creator user types and were also provisioned with ArcGIS Image for ArcGIS Online will need to migrate to Professional user types to retain image analysis capabilities.
- Professional and Professional Plus user types have full access to image analysis capabilities.
For more information, see Navigating updates: ArcGIS Image for ArcGIS Online.
General updates
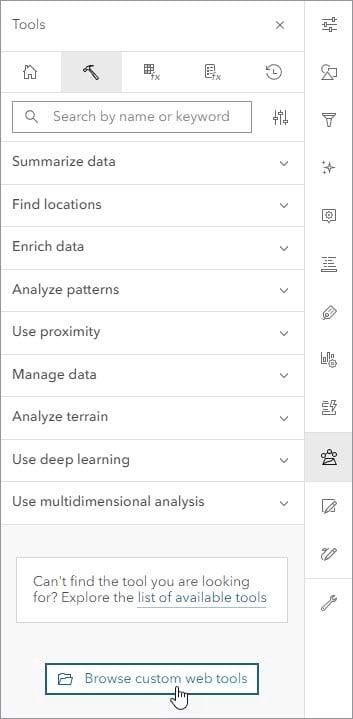
Custom web tools are now available in Map Viewer. Web tools published from Notebooks in ArcGIS Online can be run directly within Map Viewer. Additionally, custom web tools published in ArcGIS Enterprise can be added to ArcGIS Online as geoprocessing service items. These items can also be accessed from the Map Viewer Analysis pane. Custom web tools function like any other analysis tools within the Map Viewer interface, enabling a wider audience to leverage advanced analytic capabilities.
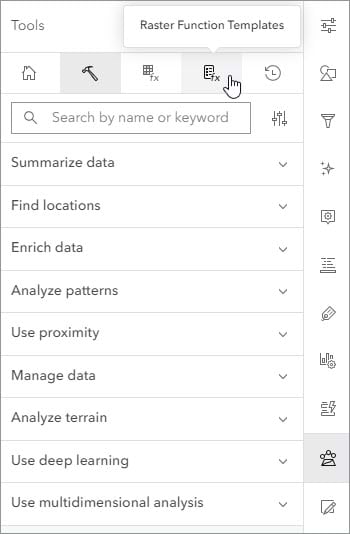
Raster function templates are combinations of raster functions that are used to create a specific visualization or analysis that can be repeated and shared. The Analysis pane in Map Viewer now includes a Raster Function Templates tab to make it easy to create or modify raster function templates.
Updated analysis tools
This update includes enhancements to feature analysis and raster analysis tools, as follows:
Join Features now has the Calculate count only option for the Multiple matching records parameter. The Multiple matching records parameter determines which records or statistics are returned in a one-to-one join.
Enrich Layer now has a Draw input features button that can be used to interactively create an input layer. Drawing input features creates a sketch layer that can be saved in the web map. The Draw input features button was introduced for several other analysis tools in the previous release.
Zonal Statistics has four new options for the Statistics type parameter: Majority count, Majority percentage, Minority count, and Minority percentage.
Zonal Statistics as Table has six new options for the Statistics type parameter: Majority count; Majority percentage; Majority value, count, and percentage; Minority count; Minority percentage; and Minority value, count, and percentage.
Distance Accumulation and Distance Allocation have two new options for the Vertical factor parameter: Hiking time and Bidirectional hiking time. The performance of these tools has also been improved if the Distance method parameter value is Geodesic, or if the Vertical factor or Horizontal factor parameters are set.
For more information, see What’s new in imagery in ArcGIS (June 2024).

Scene Viewer
Scene Viewer is an interactive 3D web mapping and data visualization application for creating, exploring, and saving and sharing web scenes.
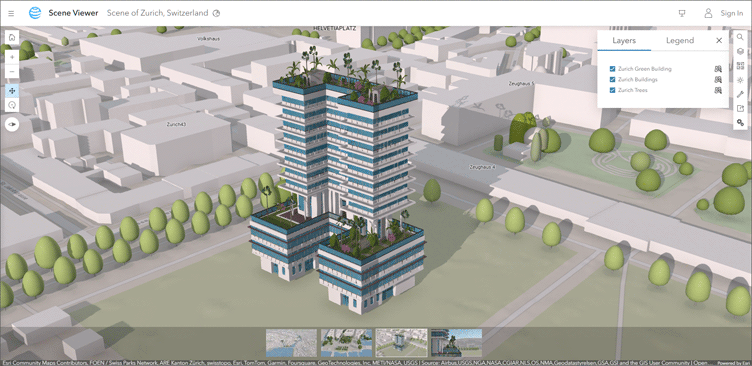
With this update, Scene Viewer has been enhanced with new capabilities and features, including the following:
Time
Explore and visualize time-enabled 2D and 3D layers with the time slider. Move the time slider to control the animation, with options to play, pause, and navigate between time periods. You can also set a visible time period for any individual layer to combine different data sets into one continuous time story. Time settings persist when capturing scene slides.
Catalog and media layer support
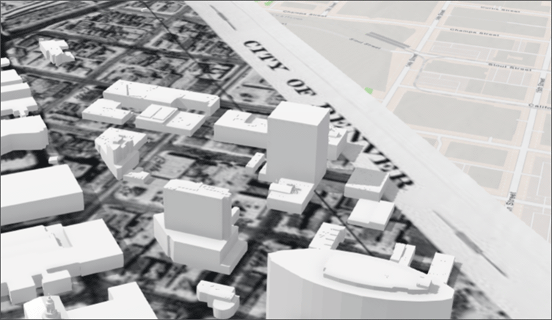
Scene Viewer now supports adding existing catalog layers and media layers. Catalog layers point to different items and services, helping to organize and manage your data. The references, which are catalogued and added as items in a dataset, can be visualized, filtered, and queried dynamically in scenes.
A media layer places and positions an image in a desired geographic location on top of the basemap. For example, you might want to visualize how a town has changed over time by switching between scanned historical maps or images and current town maps.
Enhanced 3D visualization
The ability to customize the elevation mode to more precisely position layers has been introduced. Use attribute values or Arcade expressions to improve placement.
New shading for integrated mesh layers (scene and 3D tiles) has been added, improving the lighting and overall appearance of your 3D content. Labeling for vector tiles has also been improved, making them easier to read.
Other enhancements
- Editing tasks can be done more efficiently by directly entering coordinates.
- You can now create a 3D dashboard directly from Scene Viewer.
- 3D model upload is now out of beta, enabling the integration of 3D models of various formats into the geospatial context
For more information, see the What’s new in Scene Viewer blog article.

ArcGIS Web Editor
ArcGIS Web Editor is a new web-based editing app that provides a focused, efficient editing experience in ArcGIS Online. Web Editor combines tools you’re already familiar with such as snapping, templates, and forms, with new capabilities. Using Web Editor, you can:
- Create and update features
- Edit vertices
- Edit attributes
- Edit related records
- Use editing constraints and snapping
- Copy and paste features
- Move, reshape, split, and merge features
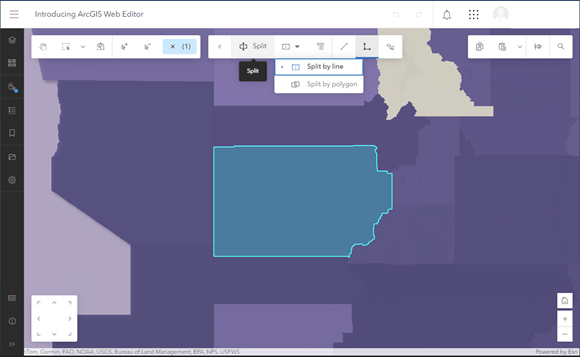
For more information about Web Editor, see ArcGIS Web Editor – Your data maintenance new best friend.

ArcGIS Notebooks
ArcGIS Notebooks provides a Jupyter notebook experience optimized for ArcGIS, allowing users to combine sophisticated spatial algorithms with powerful open-source Python libraries to develop advanced spatial data science models. ArcGIS Notebooks reduce time spent managing dependencies across data science ecosystems and increase cross-team collaboration and transparency.
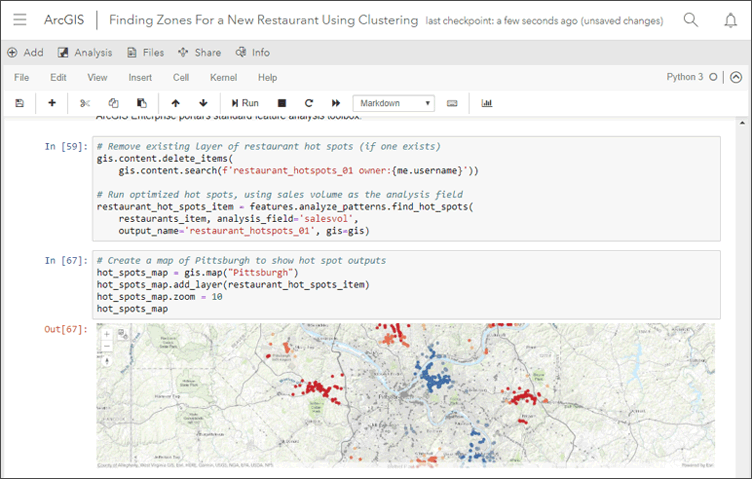
The June update of ArcGIS Notebooks introduces the ability to publish notebooks as web tools in ArcGIS Online. This new feature allows users to set input and output parameters and publish their notebooks so that they can be consumed in web apps, facilitating broader application and integration of the analytical models developed in ArcGIS Notebooks. It is important to note that users must have notebook privileges, as well as any additional privileges required for the notebook to run.
To learn more about the web tool feature in ArcGIS Notebooks, see Notebooks as web tools in ArcGIS Online and What’s New.
In addition, the ArcGIS Notebooks Python libraries have been updated to include new versions of the ArcGIS API for Python, ArcPy, and various open-source Python libraries.

Content management
Improved offline map settings
Web map settings are improved to help you properly configure maps and their contents for offline use. The Check Compatibility window provides messages to help you identify and correct problems that would prevent you from using the map and its layers in offline workflows.
True curve features
Hosted feature layers can now store true curve features. You can control whether these features are editable and, if so, if editing is restricted to only those clients that can edit them without overwriting them with features that aren’t true curves. See Manage hosted feature layer editing for information about these settings.
Date field support
Date only, time only, and timestamp offset field types are now recognized when you publish, add to, or update hosted feature layers from Microsoft Excel, comma-separated values (CSV), and GeoJSON files. See Date and time fields in ArcGIS Online to learn what formats are supported for each. Big integer field types are also recognized when using these file types to publish, add to, or update hosted feature layers if the field values fall outside the range of -2147483648 to 2147483647.
Sharing and collaboration
When content is shared with collaboration participants in a distributed collaboration, the item and sublayer metadata are also shared. Only the sending organization can make edits to the metadata, and these edits can only be shared with collaboration participants.
Hosted imagery layer updates
The item pages of hosted imagery layers now include text to indicate whether the imagery layer has a collection or multidimensional type attributes.
Members assigned the Creator user type with privileges to create content and publish hosted imagery layers can now create hosted imagery layers in ArcGIS Online.

Accounts and administration
User type updates
User types have been updated to expand access to ArcGIS capabilities, apps, and services. The updates will not affect your current workflows, but will simplify access to ArcGIS, enabling your teams to work from anywhere and easily scale as organizational needs grow. Members will not lose any existing access or functionality due to these updates.
To learn more about the updated user types, please see the user types overview page.
Explore user types, roles, and privileges in our documentation.
Administrative reports
Administrators and members with the appropriate privileges can generate asynchronous reports with details about the organization’s credits, members, items, activities, and more.
With this update, the credit report has been enhanced with details about credit consumption for storage, imagery analysis, and registered app usage. Administrators can generate credit reports on the organization’s Status tab. The report includes credit consumption by each member throughout a specified time period. The credit reports show usage in different ways, including by user, by app, and by organization.
In addition, administrators can now use the enhanced item report to keep track of which items are in the organization’s recycle bin.
Premium Feature Data Store offers fixed feature data store pricing and greater support for intensive and high-volume data workflows. With this update, feature data storage capacity for organizations with M2 and M3 Premium Feature Data Stores has increased. The M2 Premium Feature Data Store has increased from 1 TB to 2 TB, while the M3 Premium Feature Data Store has increased from 1 TB to 3 TB.
With the increased storage capacity, customers can store a higher volume of feature data, providing flexibility and accommodation for larger projects and future growth. This empowers users to explore new workflow possibilities and gain valuable insights from their geospatial data.

Apps and App Builders

ArcGIS Instant Apps
ArcGIS Instant Apps is the next generation of focused web mapping applications, featuring a streamlined experience that lets you build apps quickly and easily using express or full setup modes. All Instant Apps templates can be found on the searchable Instant Apps home page.
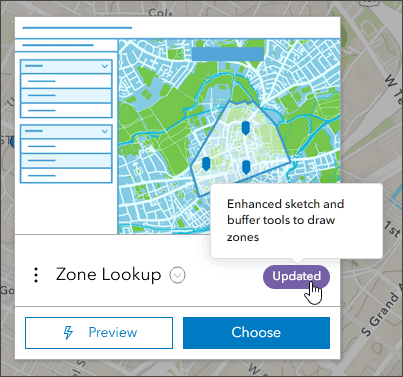
ArcGIS Instant Apps templates includes several new and updated app templates. Hover over the badges in the app cards to learn more about new, updated, or beta apps.
Language switcher
Using the language switcher, you can allow users to choose a language from a drop-down list and view text in that language inside your app. App authors can enter translated strings for user-defined text, such as the app header, details, and information panel, into one or more languages. This enables language switching within a single app, eliminating the need to configure multiple apps to support different languages.
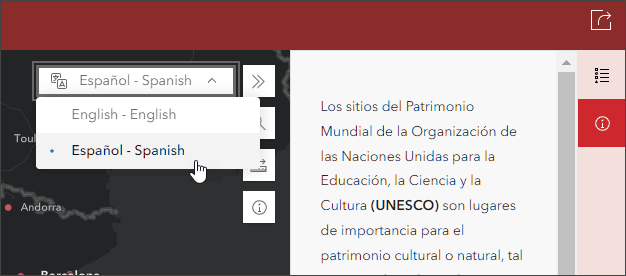
With this update, the language switcher introduces machine translation (beta) to automate the process. In addition, app authors can export text from the translation editor to Microsoft Excel, review the translations, and import the revised text.
Instant Apps home
The Instant Apps home has been improved with more live examples, providing better visibility into what can be configured with the template. The home page also includes onboarding improvements, updated descriptions, and an improved capabilities search.
New in Instant Apps
Reporter is now out of beta. Reporter offers app users the ability to view and submit issues or observations about a specific area. Reports are then added to the map used in the app. Comments and voting are also supported. Reporter also includes a basic set of map exploration tools to help navigate the map and submitted reports. For more information, see the Reporter help topic.
Instant Apps updates
Atlas enables organizations to highlight a collection of curated maps and layers. It’s an effective way to enable non-GIS users to make their own maps and explore your organization’s content. Users can easily discover and use content, as well as share the maps they create via PDF or screenshots, or after signing in can save the map. Built-in tools help users explore the map by searching locations, switching between 2D and 3D, measuring distance and area, and using the enhanced sketch tools to add text and arrows to the map.
Atlas now supports sketch layers and can be configured with an interactive legend. Atlas can now also be used as a launchpad into other apps, such as other Instant Apps, ArcGIS StoryMaps, or Map Viewer, by configuring a new Create option .
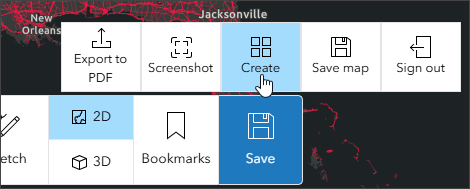
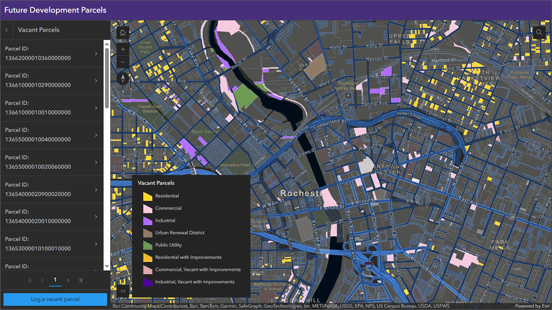
Exhibit allows app authors to tell a linear, interactive story with a single map. App viewers can move through slides defined by the app author to gain new information about the map and its data. Toggle layer visibility and change the basemap per slide to present information in different ways. Apply filters to your layers and take advantage of sketch layer capabilities available in Map Viewer to highlight different elements of your data. Exhibit has been improved with the ability to configure a side panel display for the slide list.
Attachment Viewer has been updated to support auto-play through features in the attachment-focused layout. Attachment Viewer is a good choice when you want users to view and explore images and other attachment types, such as videos and PDF files.
Other updates
- Nearby is enhanced with improved support for related records.
- Zone Lookup adds enhanced sketch and buffer tools to draw zones.
Instant Apps beta
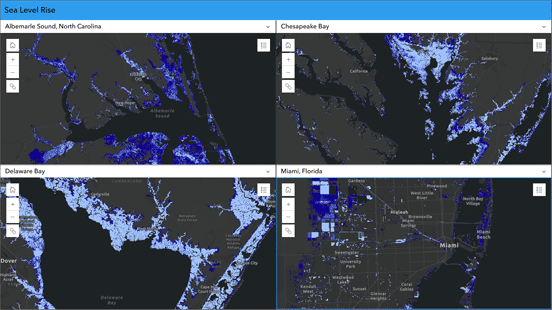
Compare is introduced in beta as an early access app template. Compare allows viewers to compare multiple maps (up to four) at the same location, or view multiple locations of the same map in a side-by-side, stacked, or quadrant layout. Choose up to four maps, scenes, or a combination of both to visualize at the same time. Map navigation can be synced throughout the views while using the app.
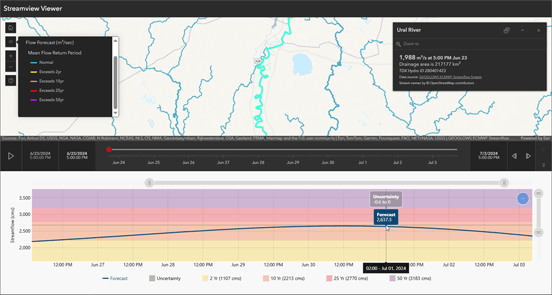
Streamflow Viewer delivers the ability to explore your streamflow forecasts. This app includes the GeoGloWS Streamflow forecast service, which is a multi-day river forecast from the European Centre for Medium-range Weather Forecasting (ECMWF) reporting streamflow in 3-hour time intervals. This Global Water Model service is updated once daily.
App viewers can interact with a chart showing the return period flow for a specific stream segment and animate changes in the forecast data for each stream segment using the time slider.
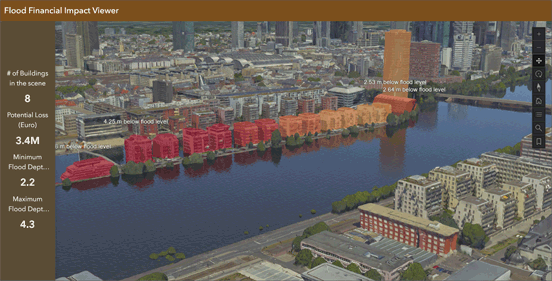
Observer is a new Instant App, introduced in beta, that is designed to provide users with the ability to explore the scene and learn more about the data. You can configure a scoreboard that will return statistics about features in the current visible extent. The template can also be configured with an optional basemap gallery and daylight tool.
For more information, see What’s new in Instant Apps.

ArcGIS Experience Builder
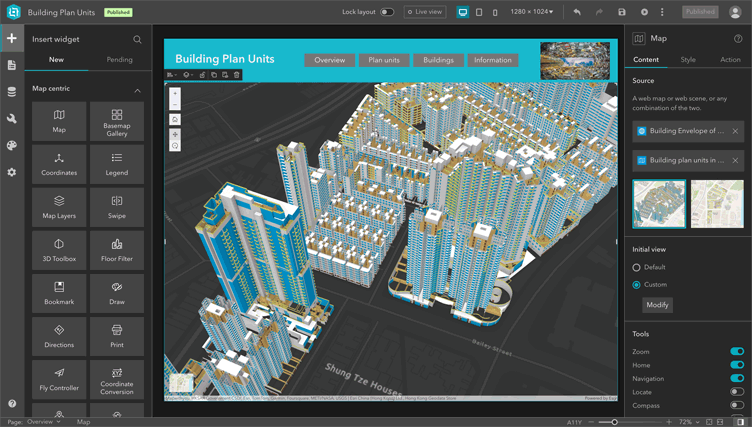
Use ArcGIS Experience Builder to build modern mapcentric or non-mapcentric web apps and webpages without writing code. Start building from scratch, or choose from an extensive library of templates that you can customize.
You can add functionality to any template with widgets you can drag, drop, and configure. You can also add custom widgets, themes, and actions with low-code development to further extend your web app.
New templates
There are three new templates available with this update. New templates can be identified by the New badge which appears on the template thumbnail in the Templates Gallery.
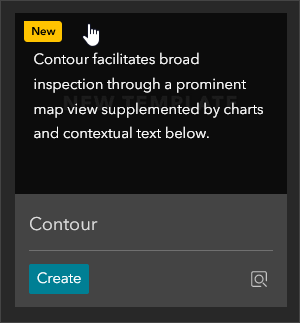
New templates include the following:
- Contour facilitates exploration via a prominent map view supplemented by charts and text.
- Tab is a map-centric template featuring tabs on the left to open different sidebar content.
- Assessor offers a compressed overview via three spotlight cards, a reference map, plus tabular data.
New widgets
Experience Builder includes many out-of-the-box widgets for creating web experiences. Most widgets have settings that you can configure and customize to tailor the app to your audience. Each widget has unique configurations. Several new widgets are introduced, including the following:
- Building Explorer filters and explores the various components of building scene layers.
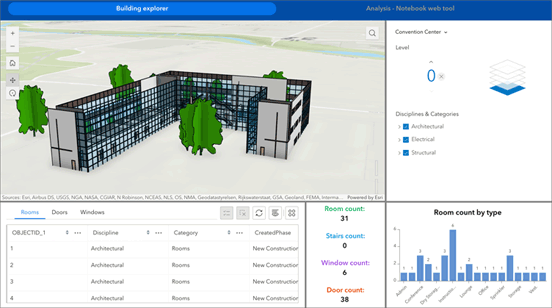
- Feature report creates high-quality reports in PDF and DOCX formats.
- Measurement calculates distances, perimeters, and areas in web maps and web scenes.
- My Location (beta) views and records your location and movement.
Other enhancements
Other enhancements in this release include the following:
- New data sources are supported, including dynamic imagery layers, tiled imagery layers, oriented imagery layers, and building scene layers.
- You can view related records using Data action in widgets like Table and Select.
- The Map widget includes a new Overview map tool.
- The Feature Info widget now displays features from multiple layers.
For more information, see What’s new in Experience Builder.

ArcGIS Dashboards
ArcGIS Dashboards enables users to convey information by presenting location-based analytics using intuitive and interactive data visualizations. Dashboards are used to help make decisions, visualize trends, monitor status in real time, and inform their communities. With this update, ArcGIS Dashboards includes several new capabilities and enhancements. Highlights are as follows:
Themes
When creating a dashboard, authors now have the option of selecting new themes or creating a customized theme with new color and styling options for their dashboard design.
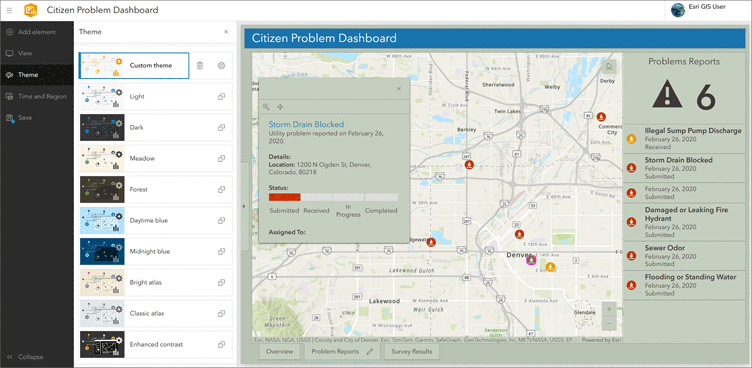
Update attributes
Dashboard authors can now update the attributes of features in a dashboard. When the layer has editing (update) enabled and the user has the privilege to edit features, they can click “edit” on a row of a table or pop-up header.
3D support
Using layer actions, dashboard authors can now select features interactively from a web scene, triggering actions when features are clicked. In addition, you can now create dashboards directly from Scene Viewer.
Other enhancements
Other enhancements in this release include the following:
- Dashboard accessibility has been improved, including better and more consistent keyboard navigation for charts.
- Chart legends can be positioned at the top, bottom, right, or left of the chart.
- You can choose from a list of predefined Period format options to control the way date and time values are displayed on a time-series serial chart.
For more information, see What’s new in ArcGIS Dashboards and Discover what’s new in ArcGIS Dashboards (June 2024).

ArcGIS Data Pipelines
ArcGIS Data Pipelines is a new native data integration capability in ArcGIS Online, offering a drag-and-drop visual diagramming interface for creating data integration workflows. You can connect to data, either from disk or in the cloud, use common engineering tools to easily clean and transform the data, and then write the processed results out to a hosted feature layer, ready for use across the ArcGIS system.
Data pipelines can be run interactively or on a recurring schedule, helping you to ensure that data is kept up to date even when the source data is changing.
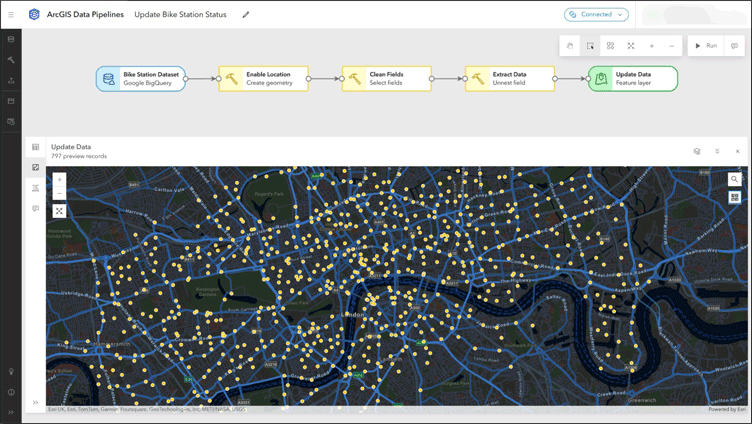
Updates include the following capabilities and enhancements:
New inputs
- Support for GeoParquet files from Amazon S3, Microsoft Azure Storage, and Public URLs.
- Support for File Geodatabase datasets from ArcGIS Online content, Amazon S3, and Microsoft Azure Storage
Enhanced tools
- Create and process geometries to build your data using the new support for Arcade geometry functions in Calculate field.
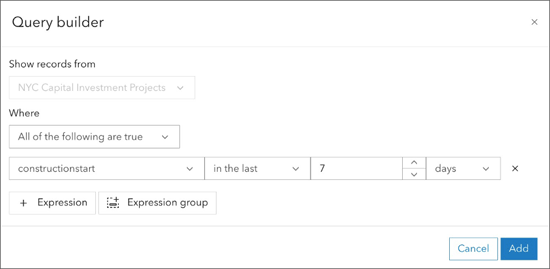
- Support for querying date fields using “in the last” and “not in the last” expressions in the Filter by attribute tool.
Other enhancements
- A new button to disconnect all editors to stop consuming credits.
- More flexibility for scheduling, with the option to run data pipelines at 15-minute intervals.
For more information, see the ArcGIS Data Pipelines What’s New help topic or What’s new in ArcGIS Data Pipelines (June 2024).

More information
For more information and additional details about this update, see the What’s new help topic or view all posts related to this release. You can also watch an introductory video to see new capabilities in action.
Visit the ArcGIS Online Esri Community to ask questions, view blogs, learn from peers, and submit your ideas for future enhancements.


Commenting is not enabled for this article.