ArcGIS Online lets you understand the world around you by using interactive maps to connect people, locations, and data. You get smart, data-driven styles and intuitive analysis tools that deliver location intelligence. ArcGIS Online gives you the ability to make maps and apps to share your insights with your organization or the world. It can be used as a complete, cloud-based solution, or use it to extend and complement the capabilities of ArcGIS Pro and ArcGIS Enterprise.
Don’t have an ArcGIS account? See Create an ArcGIS Account.
Quick links
Use the links below to jump to sections of interest.
- Partnered collaboration
- New Map Viewer
- New ArcGIS Dashboards
- ArcGIS Notebooks
- Home page customization
- Configurable apps
- ArcGIS Experience Builder
- ArcGIS Web AppBuilder
- 3D visualization
- Data management
- Accounts and administration

Partnered collaboration
ArcGIS Online organizations can now more easily collaborate with other organizations by establishing a partnered collaboration. A partnered collaboration establishes trust between two or more organizations to share, contribute, and update content securely using groups.
Members from different organizations can build maps or apps together through a shared update group. Adding content to a collaboration can be limited to group owners and managers, ensuring the right content is curated and shared.
Default administrators and those with the correct privileges can start and manage collaborations in the Collaborations tab in the organization settings.
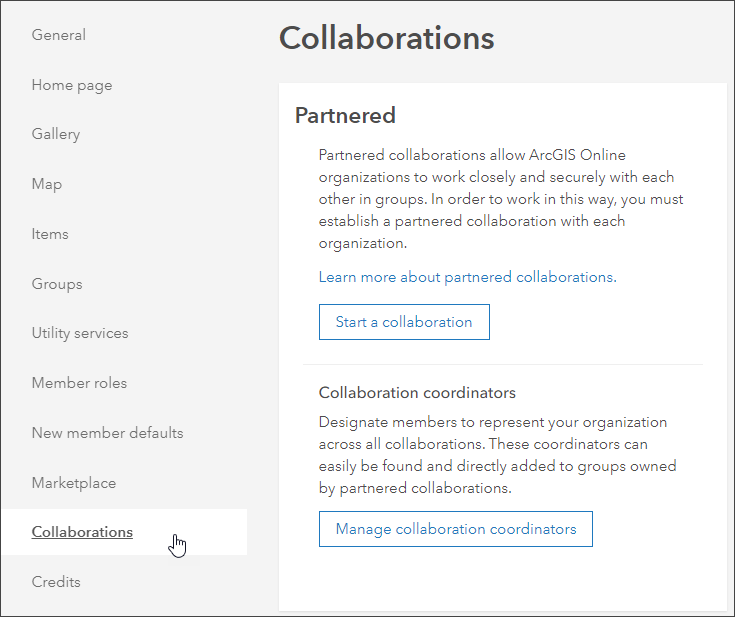
By assigning the new Facilitator role, administrators can designate organization members as collaboration coordinators to represent their organization in collaboration groups. Facilitators can create and manage partnered collaboration groups, invite members from another organization into groups, and create shared update groups.
For more information, see Understand collaborations.

New Map Viewer
The new Map Viewer is out of beta. Organizations and individual members can configure the new Map Viewer or Map Viewer Classic (formerly known as Map Viewer) as the primary map viewer to use when working with maps and layers. Both will be available, and some workflows (such as analysis) will require Map Viewer Classic. Both Map Viewer and Map Viewer Classic can be opened via the app launcher regardless of the primary viewer specified.
The primary map viewer is configured by the administrator in the Map section of the organization settings.
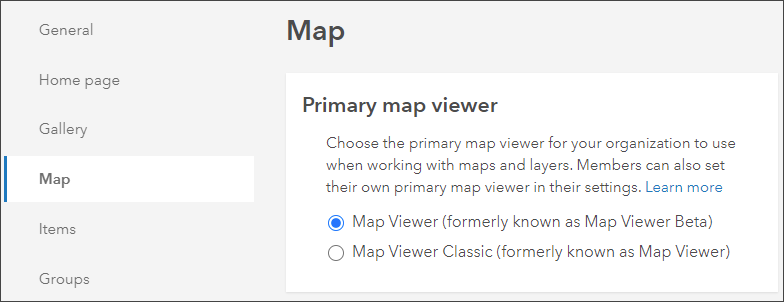
Members can also choose which map viewer they would like to use as the default by going to My settings, opening the General tab, and choosing the option they want in the Primary map viewer section.

Highlights of the new Map Viewer include the following:
- Draw features and place stamps on the map using the new Sketch tool.
- Switch quickly between layers when styling, configuring pop-ups, and making other changes to multiple map layers.
- Hide interface elements to expand the size of the map display. Expand the entire map using full-screen mode.
-
Pop-up field lists, attachments, and media groups can now display unique titles and descriptions
- Create an app from your map using ArcGIS Instant Apps, ArcGIS Dashboards, or ArcGIS StoryMaps.
- Create charts (beta) to help uncover patterns, trends, and relationships in your data. The supported chart types include bar charts, histograms, and scatter plots.
For more information, see Get started with Map Viewer, Try the new Map Viewer and New Map Viewer in general availability.

New ArcGIS Dashboards
ArcGIS Dashboards enables users to convey information by presenting location-based analytics using intuitive and interactive data visualizations on a single screen. Dashboards are essential information products, like maps and apps, providing a critical component to your geospatial infrastructure.
The new ArcGIS Dashboards is now out of beta and is the default ArcGIS Dashboards experience. The previous version of ArcGIS Dashboards is now called ArcGIS Dashboards Classic.
Highlights of the new ArcGIS Dashboards include the following:
-
Support for using ArcGIS Arcade in dashboards to create data expressions and for advanced formatting of list and indicator elements.
- Additional supported data sources for elements, including feature collections and CSV web layers.
- Selection-based display for configuring elements to only render when a selection is made elsewhere on the dashboard.
- Improved load and draw performance.
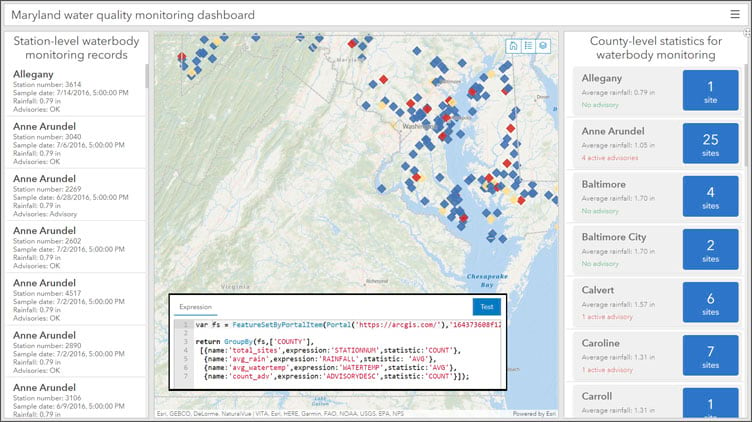
For more information, see What’s New in ArcGIS Dashboards.

ArcGIS Notebooks
ArcGIS Notebooks provide a versatile, Jupyter notebook interface for geospatial data analysis. With notebooks, you can perform analysis, automate workflows, and immediately visualize data and analysis results in a geographic context.
You can now schedule a notebook to run automatically on a recurring basis in ArcGIS Notebooks. This new feature lets you automate routine tasks, run large or lengthy processes during off hours, or update data frequently. You can also pass parameters into a notebook to run analytical scenarios, or automatically populate variables.
When working in a notebook, you can create a snapshot of the notebook to capture its current state. Choose to restore your notebook to the captured state or download the snapshot as a notebook item.
For more information, see What’s new in ArcGIS Notebooks. To learn how to use notebooks, see Get started with notebooks.

Home page customization
Organizations can now configure colors to apply to their home page content. Administrators can choose from eight preset color themes, or create their own custom theme if their organization has specific color or branding requirements.
Each color theme contains color styles that define the text, background, headline, and button or link colors on the home page. After selecting a theme, you can easily apply different colors to each content block on your home page.
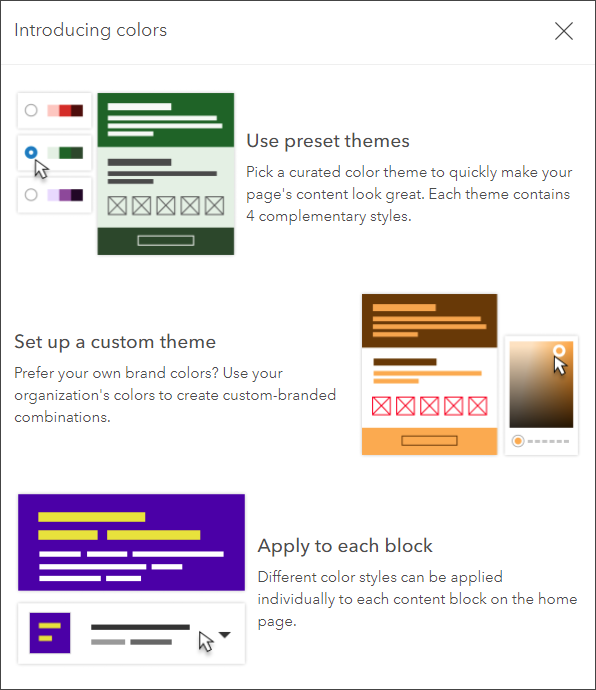
To help ensure your colors meet WCAG 2.1 accessibility standards, the home page editor also indicates when colors are not legible relative to the background color.

ArcGIS Configurable Apps
ArcGIS Configurable Apps are template applications that you can configure easily, without any coding. They help you publish apps quickly to support a variety of users and workflows. Configurable apps are the fastest and easiest way to go from a map to a shareable app. This release includes continued enhancements to the ArcGIS Configurable Apps templates.
Instant apps feature the latest streamlined configuration experience, letting you build apps quickly and easily using express setup mode, or you can switch to full setup mode to select additional tools and settings.
Create a web app has a new Use instant apps category for quick access to instant apps.
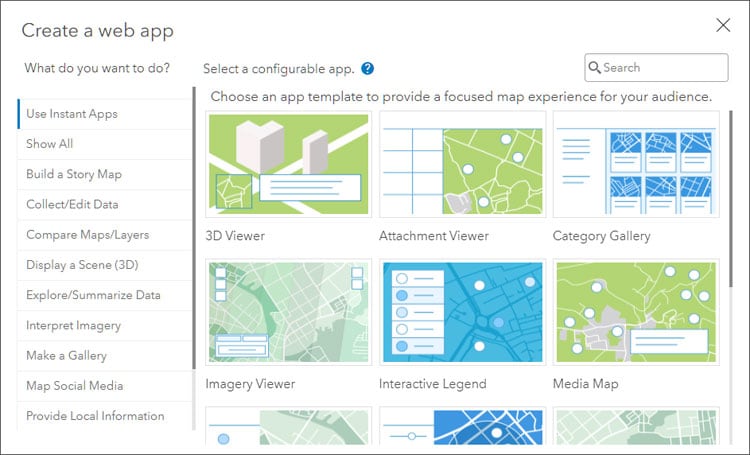
The Create app button in the new Map Viewer provides access to the ArcGIS Instant Apps Gallery.
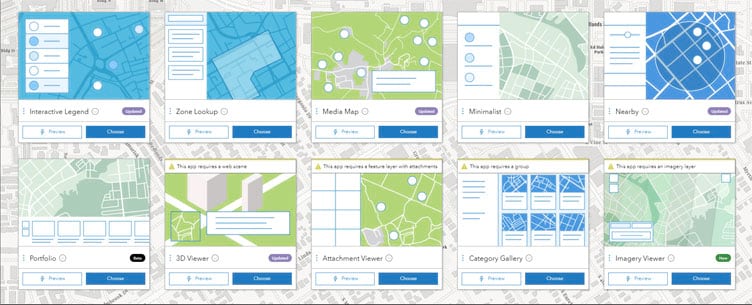
Instant apps now include the following:
3D Viewer lets you display and explore a scene with 3D navigation tools. Other tools can be configured to enable line-of-sight analysis, 3d measurement, and slicing through 3D data in the scene.
Attachment Viewer lets you view photos, videos, and PDF files stored as feature layer attachments and offers a choice of map focused or attachment focused layout options.
Category Gallery works with a group, providing filtering capabilities on organization categories or categories defined in the group. Item cards can be configured to display specific information.
Imagery Viewer is a new addition to the gallery, enabling you to visualize and explore imagery using tools for navigating through time, recording locations, measure, and more.
Interactive Legend lets you filter data based on your map legend.
Media Map offers a variety of useful tools, including navigation tools, time animation, and swipe. You can optionally configure hover pop-ups, or add print and screenshot tools.
Minimalist delivers a simplified layout to highlight your map, plus the ability to configure a navigation boundary to keep the focus on a specific area.
Nearby guides viewers to points of interest based on a location search within a specific distance, and includes directions.
Portfolio (beta) lets you create a showcase of different content all in a single application.
Zone Lookup allow viewers to search for locations within a specific zone or region.
For more information, see What’s New in Configurable Apps.

ArcGIS Experience Builder
Use ArcGIS Experience Builder to transform your data into compelling web apps without writing a single line of code. Build mapcentric or nonmapcentric mobile adaptive adaptive experiences for your audiences.
ArcGIS Experience Builder introduces four new widgets: Branch Version Management, Chart, Query, and Coordinate Conversion.
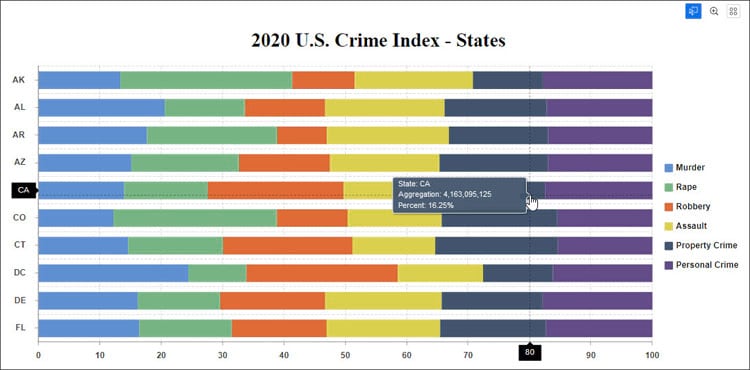
The Table widget is out of beta and supports attribute editing by checking data capabilities and user credentials.
When setting a data source throughout your app, you can now choose a selected features view or use output data generated by Query and Chart widgets.
Use the new data actions settings to provide an action menu in supported widgets, so end users can process data at runtime, such as exporting to a file or showing selected features in a target widget. Other highlights include advanced snap lines that help you position widgets, support for customizing windows in different screen sizes, and the addition of app and page templates for monitoring data.
For more information, see What’s new in Experience Builder.

ArcGIS Web AppBuilder
ArcGIS Web AppBuilder delivers a way for you to easily create web apps that run on any device, using a gallery of ready-to-use-widgets. You can customize the look of your apps with configurable themes and can host your apps online or on your own server.
Multiple enhancements have been added to ArcGIS Web AppBuilder:
- District Lookup has an option to customize the message that appears when no results are found.
- Info Summary adds the option to sort records at the feature and group level.
- Situation Awareness has an option to show numeric values of each layer with or without formatting.
- Editable layers added to the app using the Add Data widget can now be edited using the Smart Editor widget.
- When defining a Coordinates Attribute Action to collect location information in a feature’s attributes, you can now determine the coordinates based on the location of the user editing the feature by selecting the My Location option.
For more information, see What’s new in ArcGIS Web AppBuilder.

3D visualization
Use Scene Viewer in ArcGIS Online for viewing and exploring 3D scenes.
With this release, you can now create elevation profile charts in Scene Viewer. Using these charts you can compare the heights for terrain and/or other 3D objects. To create a profile, draw or select a line in your scene and interactively explore the elevation and view statistics, such as the elevation gain or slope.
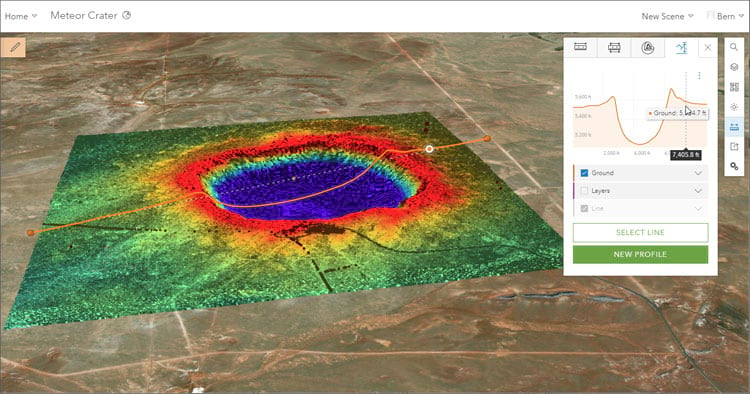
Other enhancements:
- Scene Viewer now allows you to identify the source and shape of shadows by selecting buildings and other 3D models in your scene.
- A default quality setting provides improved rendering of Physically Based Rendering (PBR) materials and enhanced visual quality of scene layers.
- Transparency rendering is enhanced for scenes with a semi-transparent ground.
- Scenes with only a single semi-transparent tiled layer now have reduced memory consumption.
To learn how to use Scene Viewer, see Get started with Scene Viewer.

Data management
Item and content pages now have an option to open maps directly in ArcGIS Field Maps when configuring them for use in the field.

Accounts and administration
A new public GitHub repository includes detailed documentation on configuring third-party identity providers (IDPs) for your organization’s OpenID Connect logins. The repository currently includes documentation for Amazon Cognito, Azure Active Directory, and Google and will support more in future updates.

More information
For more information and additional details about this release, see the What’s new help topic or view all posts related to this release.
For other information, see the ArcGIS Online blog articles and ArcGIS Online at the Esri Community.
For news, updates, and information about other products, see the ArcGIS Blog and product resources at the Esri Community.

Commenting is not enabled for this article.