As a GIS analyst, you often need to use subsets of data for analysis, but can only find data that is larger than needed. Maybe your dataset spans all of Europe, but you only want to analyze one country. Or perhaps the data encompasses thousands of years, and you only need a select few.
There are multiple ways to create subsets of data for analysis. This blog will review and assess four common methods:
- Applying filters: This is a quick way to reduce the number of features that will be analyzed by applying attribute-based queries to your data in Map Viewer.
- Running the Find by Attributes and Location analysis tool: This tool supports simple and complex attribute and spatial expressions that can interact with each other.
- Using the processing extent: This limits the features that will be used for analysis by only analyzing features within specified geographical boundaries.
- Creating hosted view layers: This creates a view that references your underlying data while choosing which features to reference using a combination of attribute expressions, spatial filters, and field filtering.
Applying Filters
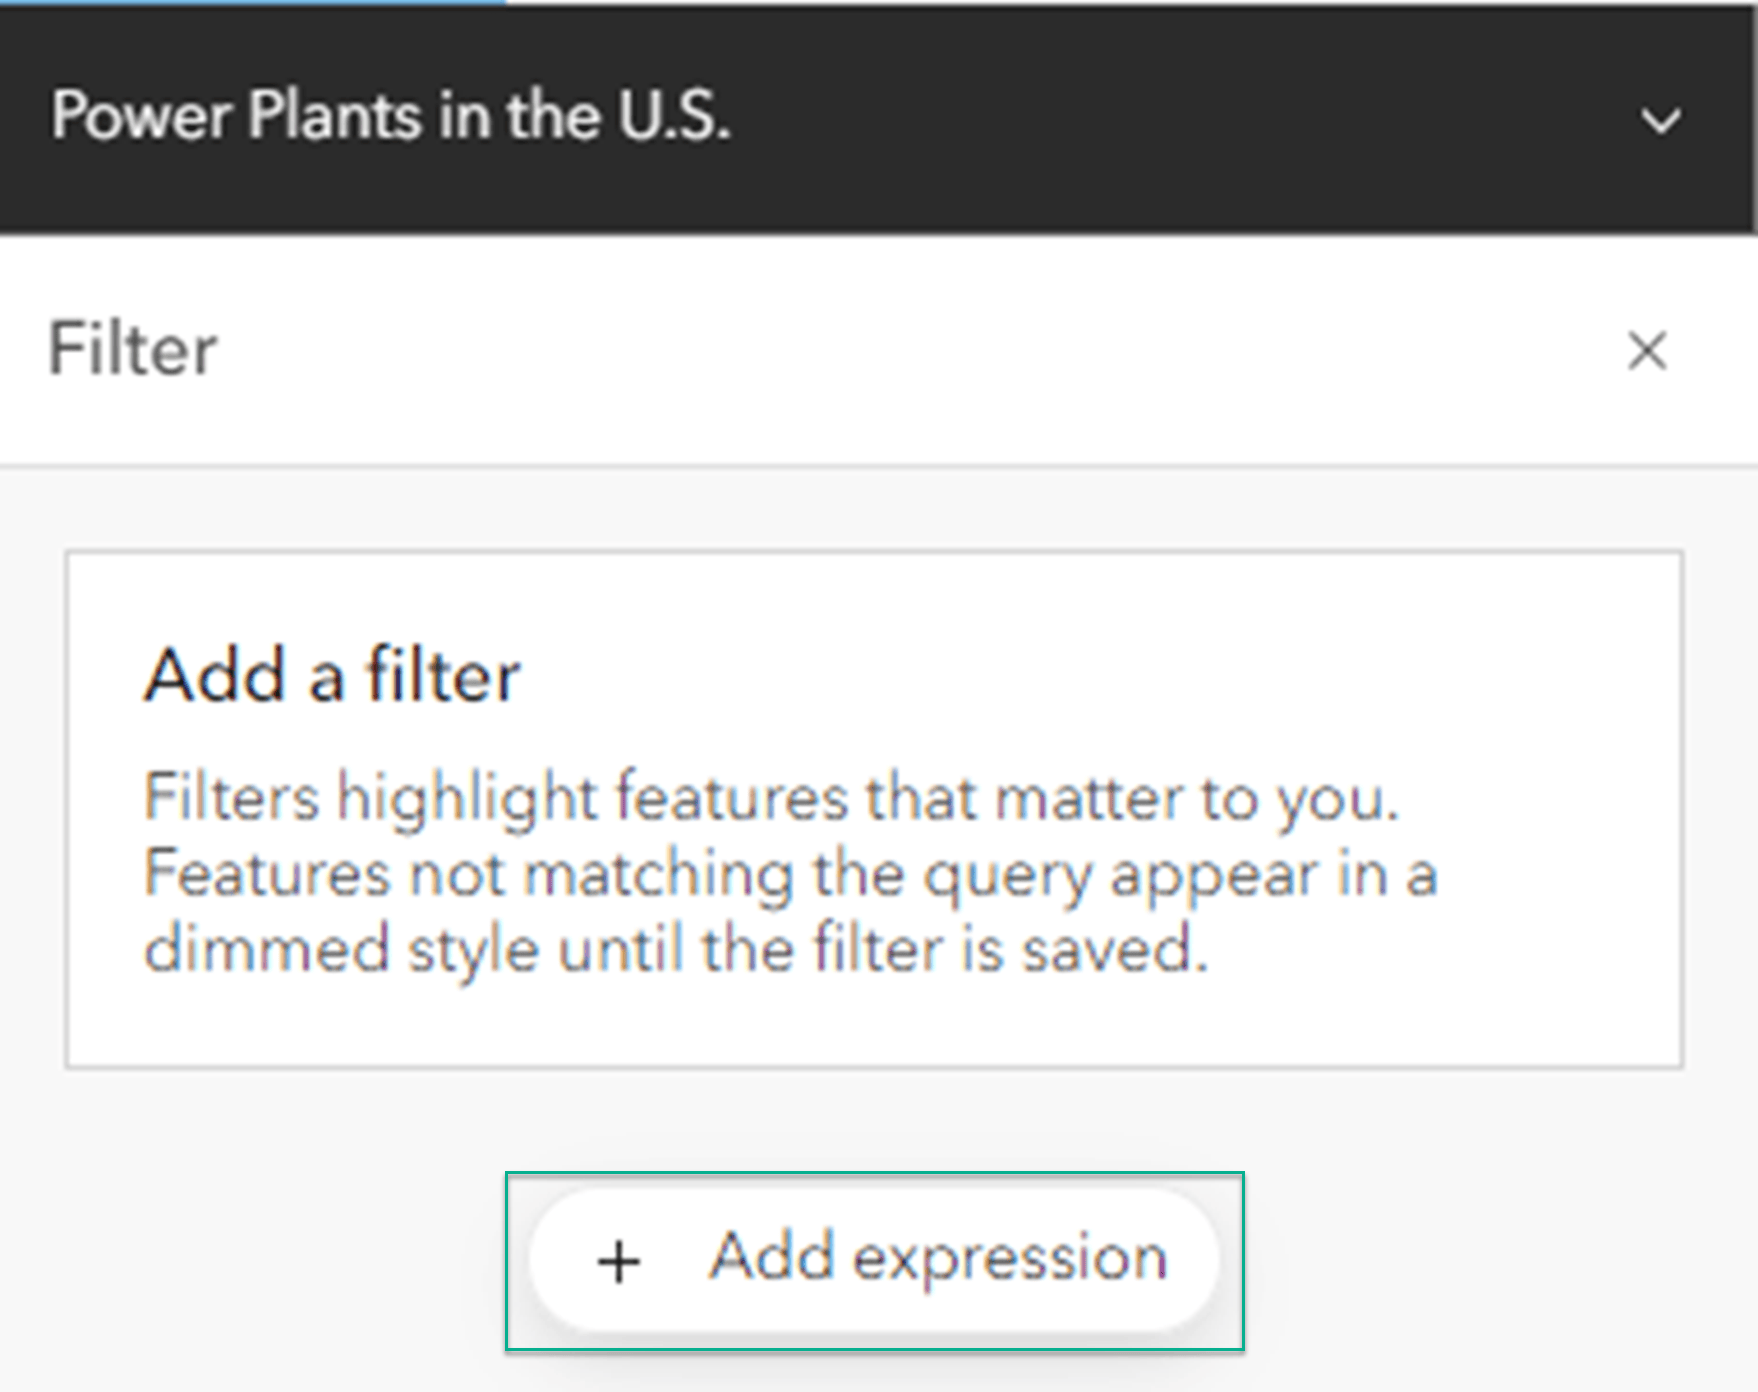
Filters only show features that match attribute expressions you set. You can set simple expressions, as well as more complex expressions that use grouping. The example below uses a filter to find a subset of data that has a plant name called Bear Creek. To create filters, go to the Settings (light) toolbar, and click on the tab called Filter.
- Click Add expression.
- Fill out the expression to find the feature that has a Plant Name of Bear Creek.
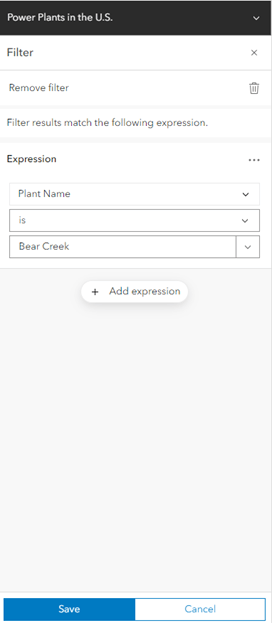
- Click Save.
You now have a subset of your data that can be used in further analysis. Notice that only the features that match the filter condition are drawn on the map or used as the input in analysis tools.
Filters are useful when you want to quickly subset your data in the map based on certain attribute values, and don’t need to permanently save the layer for future use. Filters do not cost credits. Learn more about applying filters in Map Viewer here.
Running the Find by Attributes and Location Tool
If you need to create a permanent subset of your data based on attribute values, spatial relationships, or both, use the Find by Attributes and Location analysis tool. This tool can combine spatial and attribute queries in one analysis run and produces a new layer that can be used for further analysis. Running this analysis tool will cost credits. The following example uses attribute and spatial expressions to create a subset of data that includes electric utility power plants that are within 50 miles of state parks and forests.
- Add one or more layers to your map.
- In the Settings (light) toolbar, click Analysis.
- Next, click Tools. In the search bar, type “Find by Attributes and Location”. Click on the tool to open it.
- Select Build new query from within the Find by Attributes and Location tool. From here, you can select which layer to perform queries on, and if you want to start with an attribute or a spatial expression. Create an attribute expression first.
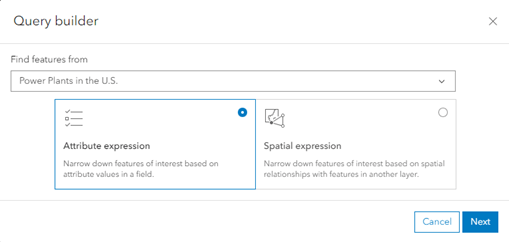
- This tool allows one or multiple expressions, where All of the following are true, or One of the following are true. Ensure that All of the following are true is selected.
- Then, you can create a Spatial expression with a second data layer.
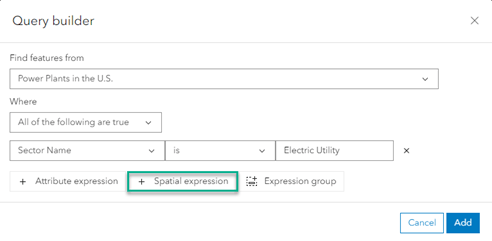
- Change the spatial relationship to Within a distance of and specify a distance of 50 Miles.
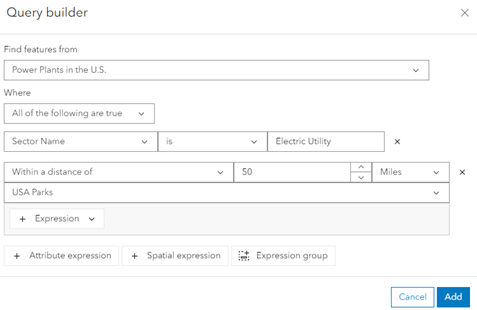
It’s also possible to create expression groups of spatial and attribute expressions.
- Click the Expression dropdown, then Attribute expression.

- Add an attribute expression to specify that the parks within 50 miles of electric utility power plants must be state parks or forests. From the field dropdown, select FEATTYPE, choose is from the relationship dropdown, and choose State park or forest from the value dropdown.
- Click Add.
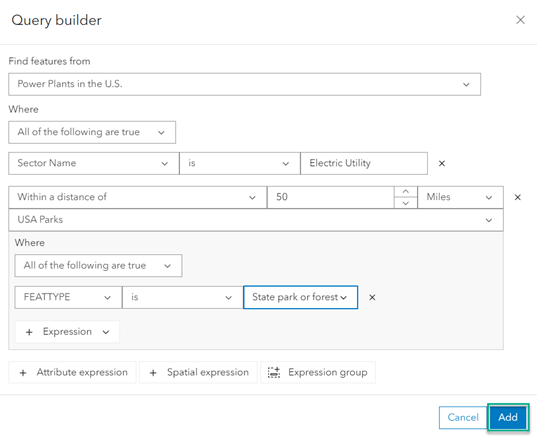
- Provide a meaningful name, click Estimate credits, then Run the tool.
Once the tool completes, the output is a hosted feature layer that contains the subset of your original data that meets the specified criteria. You can use this result layer as the input for other analysis tools. Learn more about the Find by Attributes and Location tool here.
Using the Processing Extent
Within Analysis, you can limit the input data to use a subset of data by specifying a processing extent. Setting the processing extent specifies the extent or boundary for which features from the input layer will be used in analysis. Only features within that extent will be used in analysis. This is helpful to reduce the estimated credit cost because it is an easy way to limit the number of features being analyzed within a tool. Below is an example of how to use Processing extent to create a subset of data by reducing the extent from the entire United States to just the Eastern portion of the U.S.
There are four options for the processing extent:
- Full extent (default): Uses the default extent as calculated from the input
- Coordinates: Allows you to specify the coordinates of the sides of the bounding rectangle, or populate them from the current map extent
- Display extent: Uses the extent of the map displayed when running the tool
- Layer: Uses the extent of a layer you specify
- Open the Find Centroids tool and fill out the tool.
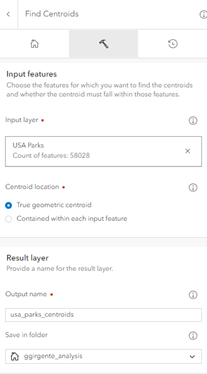
- Scroll down to the Environment settings section and click on the arrow for the dropdown under Processing extent.
- Choose Display extent, then zoom into the U.S. so that only the Eastern U.S. is shown on your map.
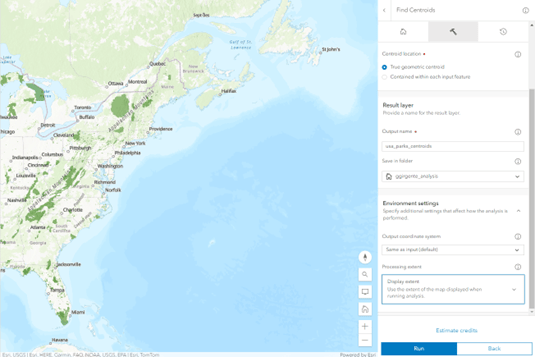
- Click Estimate credits, then click Run. Note, the estimated credit amount will vary based on the amount you zoom in.
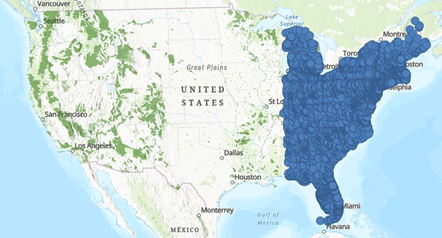
The tool only analyzed the features that were within the processing extent, creating an output of data around the Eastern United States. The new subset of data can be used in further analysis. Click here to learn more about using the Processing extent.
Creating a Hosted View Layer
A hosted feature layer view is a way to create a more permanent yet dynamic subset of your data based on fields, features, or geographical areas. Creating a view layer creates a new item that references the original data, meaning that edits made to the data in the source layer appear in the view. To create a view from a layer, you must own the layer or be an administrator.
The following example uses attribute expressions, spatial filters, and field filtering to create a subset of data that includes only national parks and forests that are within the Appalachian Mountain region.
- Go to the item details page for a hosted feature layer.
- On the righthand side, click the dropdown for Create View Layer, and click View Layer.
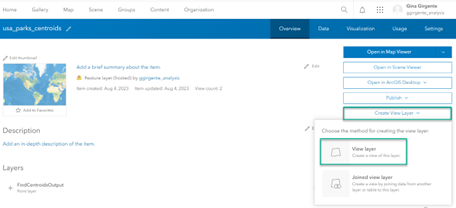
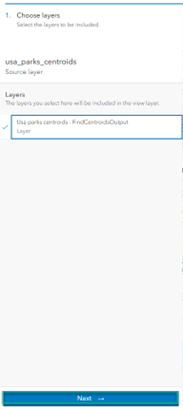
- Click Next to set a definition for the layer, then click the layer name to access the three different ways you can control a layer.
- Select Add filter.
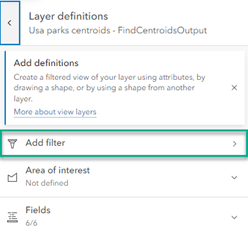
- This feature has the same functionality as the Filter feature in Map Viewer. Select Add expression and create a query.
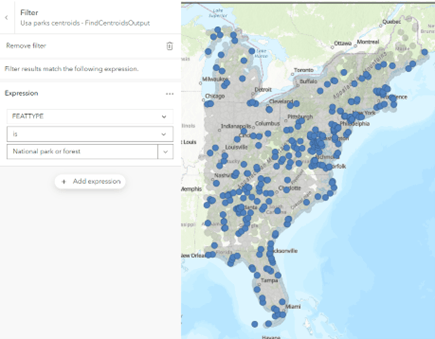
- Press the back arrow to add another definition. Click Area of interest.
- Choose the polygon option and draw a shape around the area of interest for the view layer.
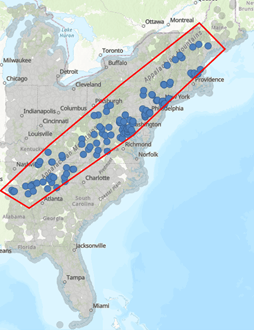
- Then click the Fields dropdown. This controls what fields users will see.
- Remove all but one of the fields by clicking the x beside the field names.
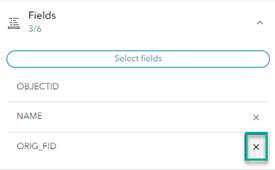
- At the top ribbon, click on Create view.
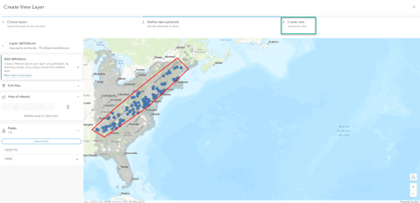
- Give the view a title and select Create.
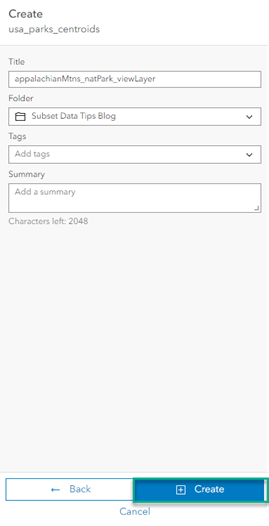
- Return to the Contents page and notice the added view layer. Click on the name to open the layer’s information page, then click Open in Map Viewer.

You now have a hosted view layer showing a subset of data with only one field, that is filtered, and is only within the specified extent. This can now be used in more analysis. Learn more about hosted view layers here.
Summary
You’ve now learned four different ways subsets of data can be created to complete analysis in Map Viewer:
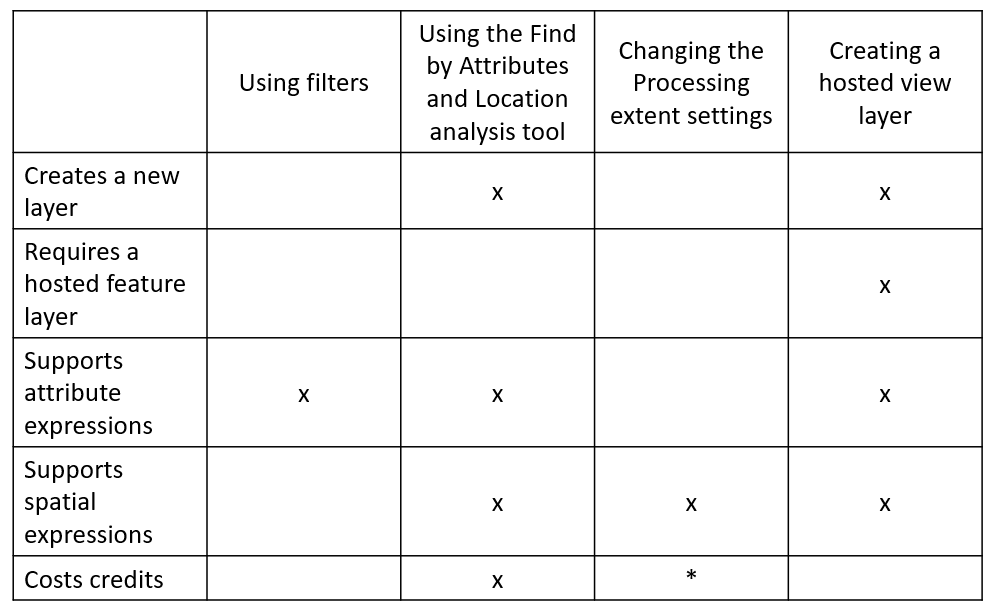
*Changing the Processing extent settings does not cost credits but running the tool that the settings are being changed for will cost credits.
Have questions? Tell us what you think in the comments section below.

Article Discussion: